This site is in beta — data may be incomplete and features are still being added.

DocumentsPresentationJan 20, 2020Pages 34–54

2020 BUDGET - West Shore Parks & Recreation (presentation / appendix)

Attached scanned/graphic budget document submitted by West Shore Parks & Recreation Society for 2020, containing detailed financial tables, charts and program information.

6.b West Shore Parks and Recreation Society 2020 Budget - Staff Report (Finance)

Key facts

  • Document: 2020 budget for West Shore Parks & Recreation serving Colwood, Highlands, Langford, Metchosin, View Royal
  • Source pages are image-dominant/scanned (pages 34-54)
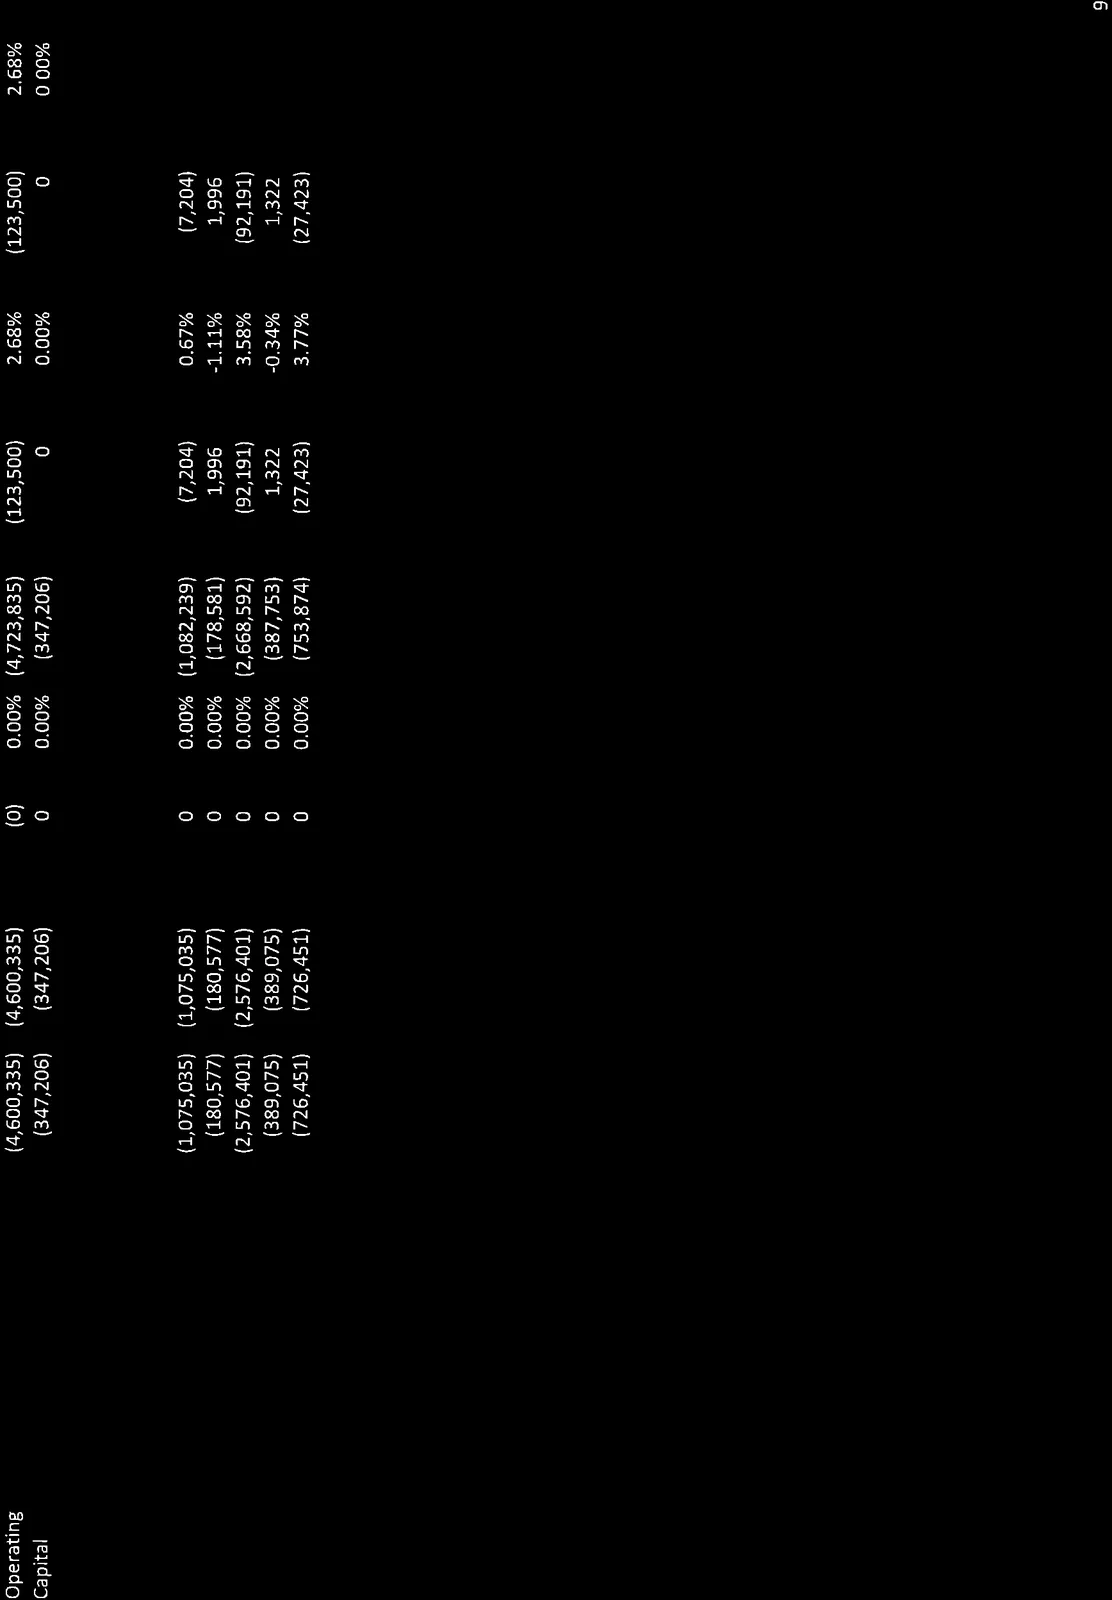
  • Supports staff report that Langford's requisition share increased by $92,191
Page 34–54

BOARD OF DIRECTORS

1767 Island Highway Victoria BC V9B 1J1 PH: 250 478-8384 FX: 250 474-8650 www.jdfrecreation.com

STAFF REPORT

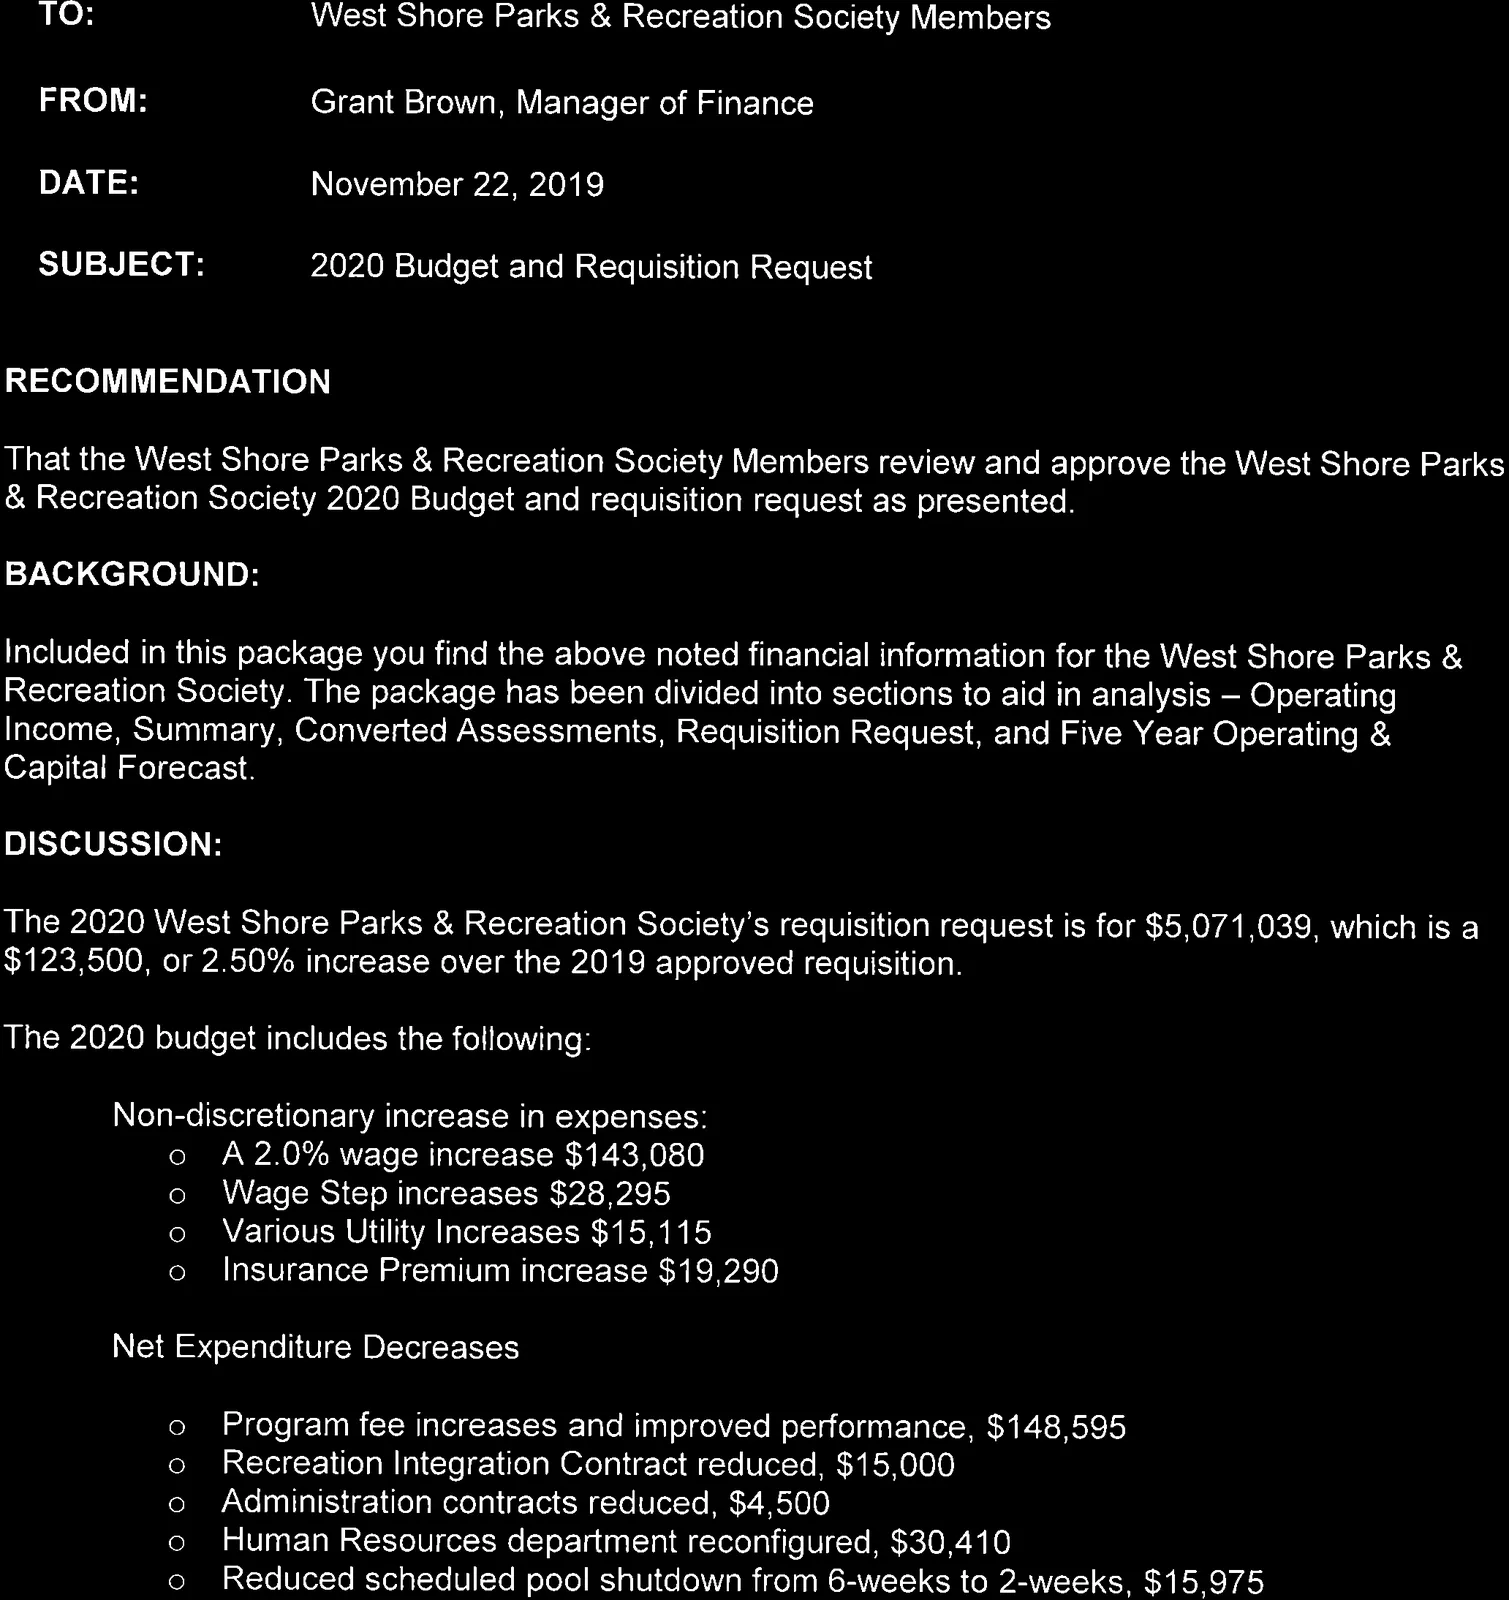
  • TO: West Shore Parks & Recreation Society Members
  • FROM: Grant Brown, Manager of Finance
  • DATE: November 22, 2019
  • SUBJECT: 2020 Budget and Requisition Request

RECOMMENDATION:

That the West Shore Parks & Recreation Society Members review and approve the West Shore Parks & Recreation & Recreation Society 2020 Budget and requisition request as presented.

BACKGROUND:

Included in this package you find the above noted financial information for the West Shore Parks & Recreation Society. The package has been divided into sections to aid in analysis – Operating Income, Summary, Converted Assessments, Requisition Request, and Five Year Operating & Capital Forecast.

DISCUSSION:

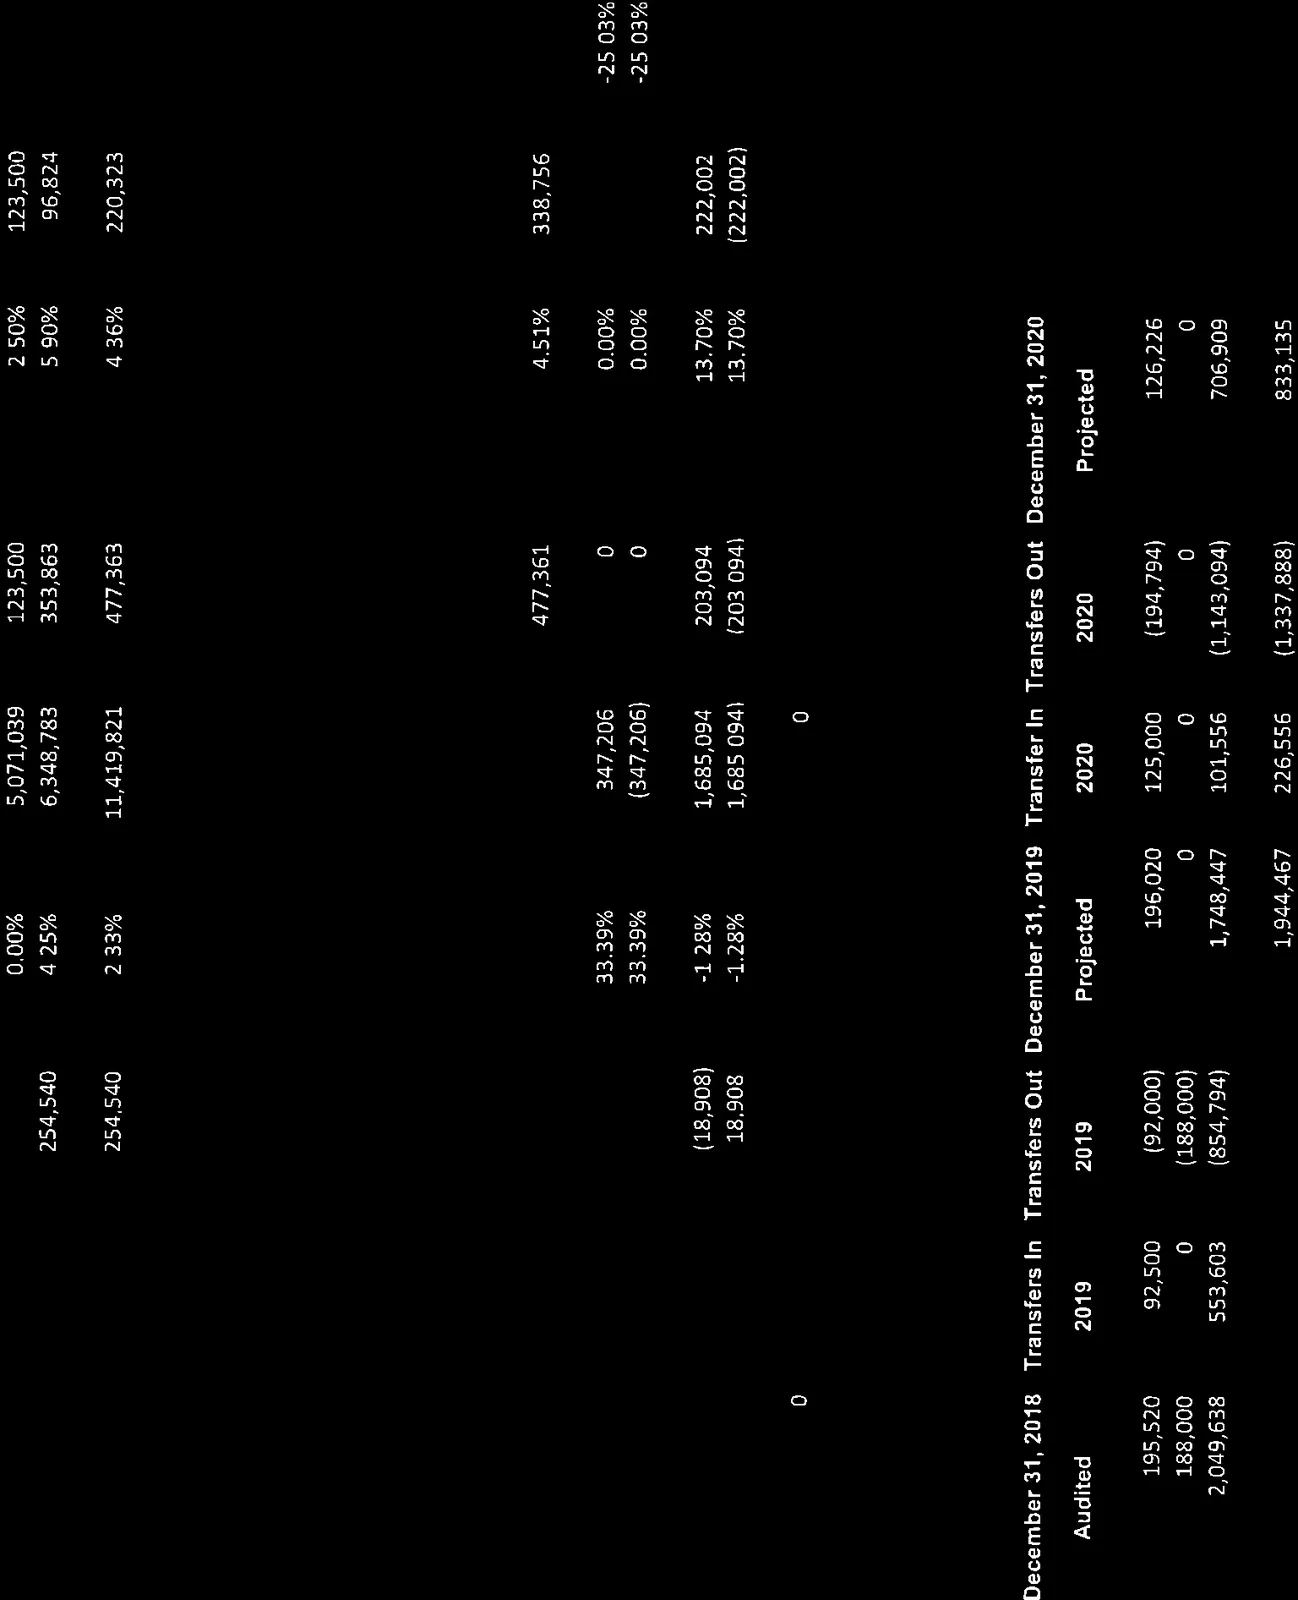
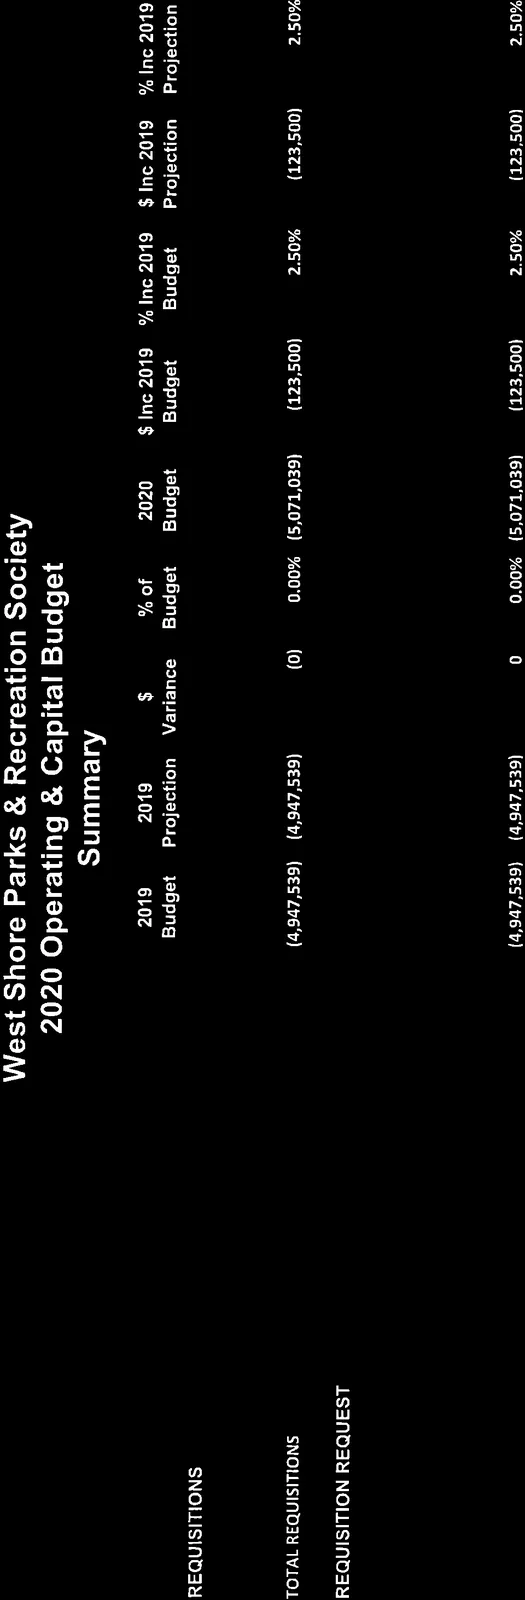
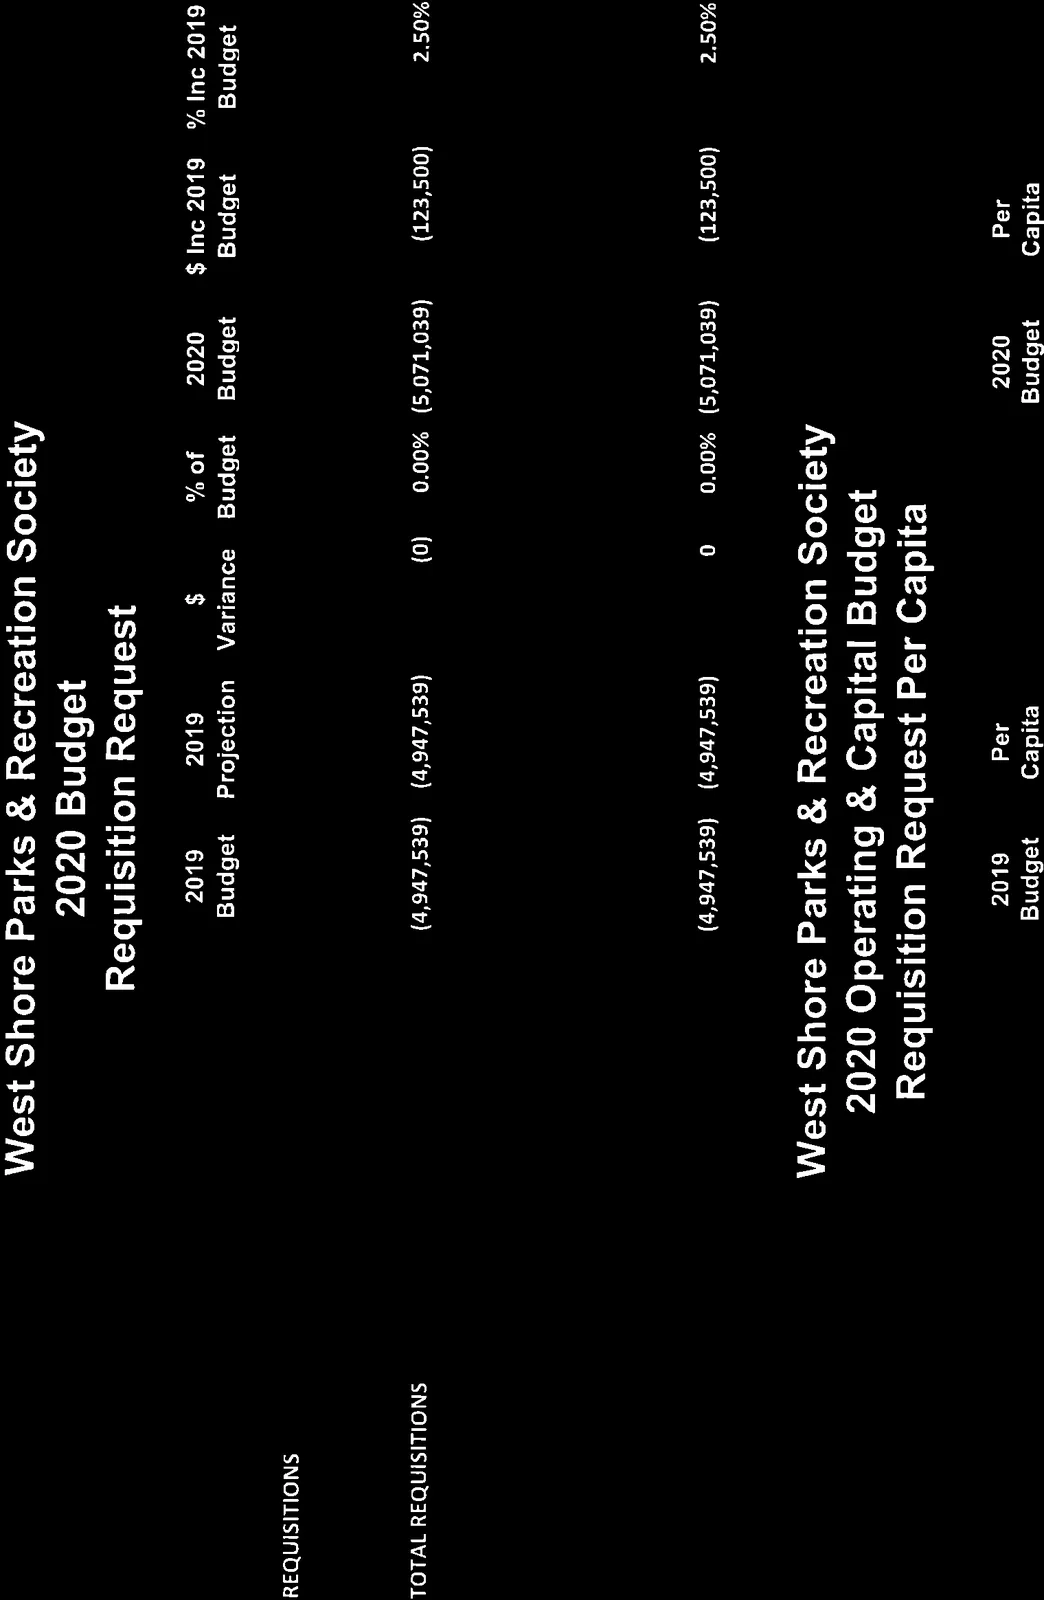
The 2020 West Shore Parks & Recreation Society’s requisition request is for $5,071,039, which is a $123,500, or 2.50% increase over the 2019 approved requisition.

The 2020 budget includes the following:

  • Non-discretionary increase in expenses:

    • A 2.0% wage increase $143,080
    • Wage Step increases $28,295
    • Various Utility Increases $15,115
    • Insurance Premium increase $19,290
  • Net Expenditure Decreases:

    • Program fee increases and improved performance, $148,595
    • Recreation Integration Contract reduced, $15,000
    • Administration contracts reduced, $4,500
    • Human Resources department reconfigured, $30,410
    • Reduced scheduled pool shutdown from 6-weeks to 2-weeks, $15,975
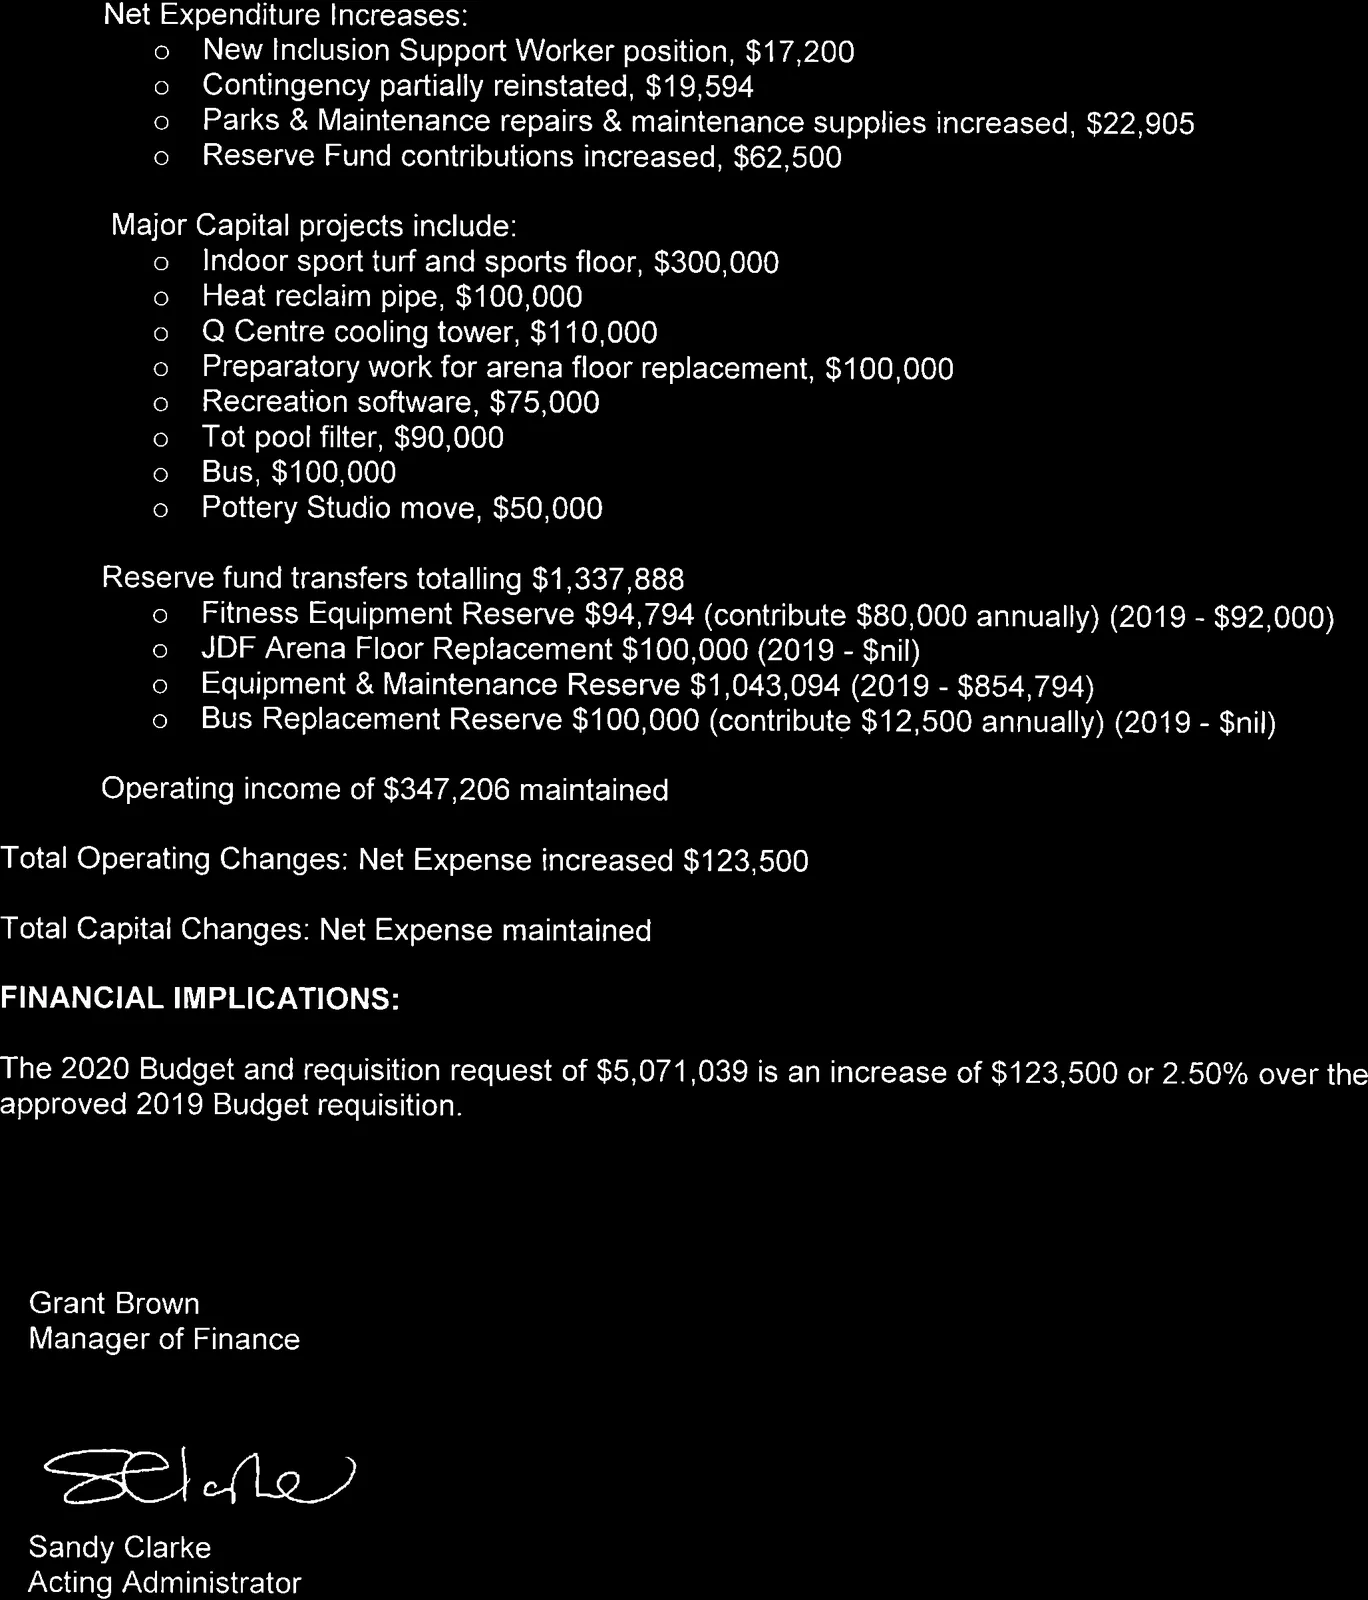
  • Net Expenditure Increases:

    • New Inclusion Support Worker position, $17,200
    • Contingency partially reinstated, $19,594
    • Parks & Maintenance repairs & maintenance supplies increased, $22,905
    • Reserve Fund contributions increased, $62,500
  • Major Capital projects include:

    • Indoor sport turf and sports floor, $300,000
    • Heat reclaim pipe, $100,000
    • Q Centre cooling tower, $110,000
    • Preparatory work for arena floor replacement, $100,000
    • Recreation software, $75,000
    • Tot pool filter, $90,000
    • Bus, $100,000
    • Pottery Studio move, $50,000
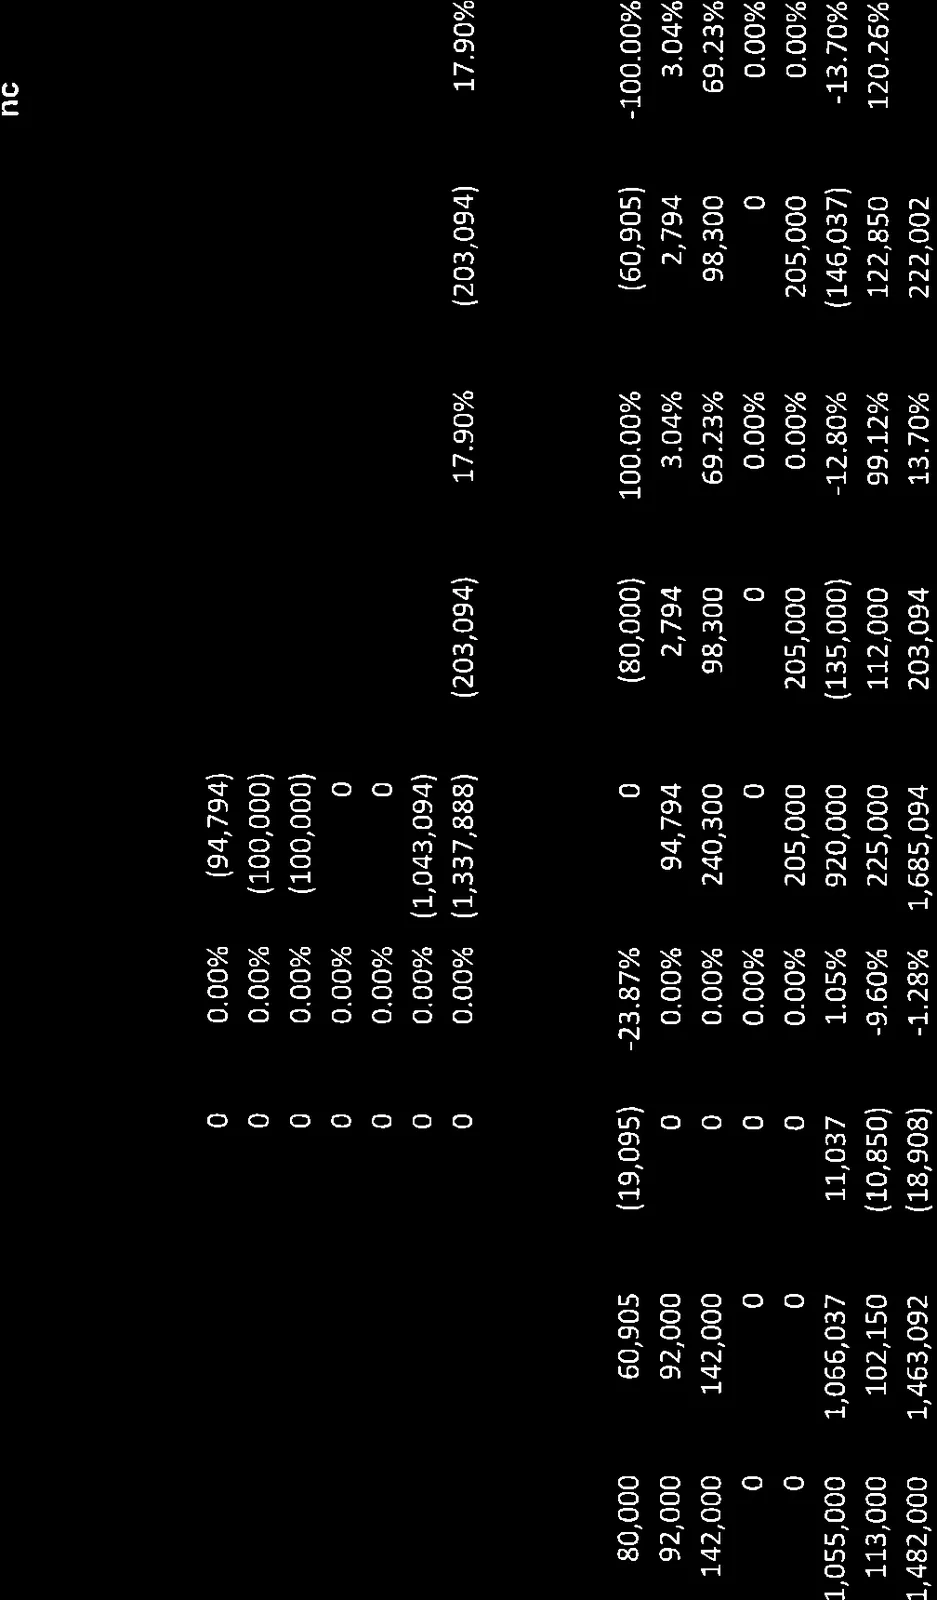
  • Reserve fund transfers totalling $1,337,888

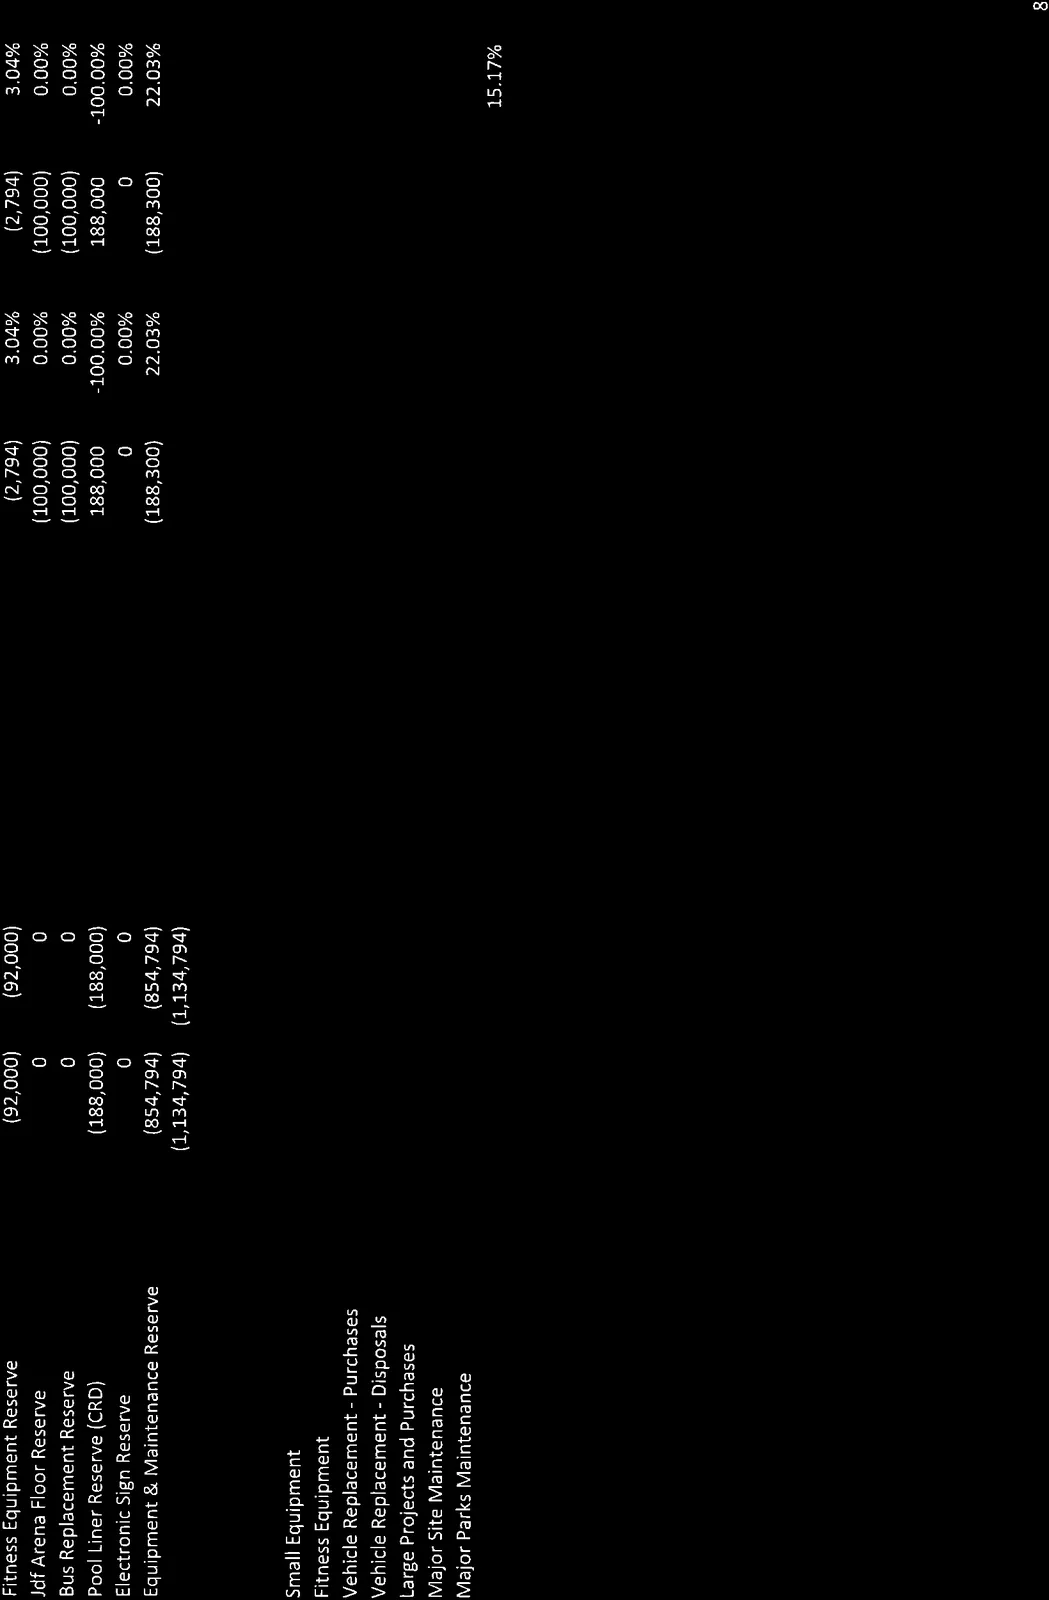
    • Fitness Equipment Reserve $94,794 (contribute $80,000 annually) (2019 - $92,000)
    • JDF Arena Floor Replacement $100,000 (2019 - $nil)
    • Equipment & Maintenance Reserve $1,043,094 (2019 - $854,794)
    • Bus Replacement Reserve $100,000 (contribute $12,500 annually) (2019 - $nil)
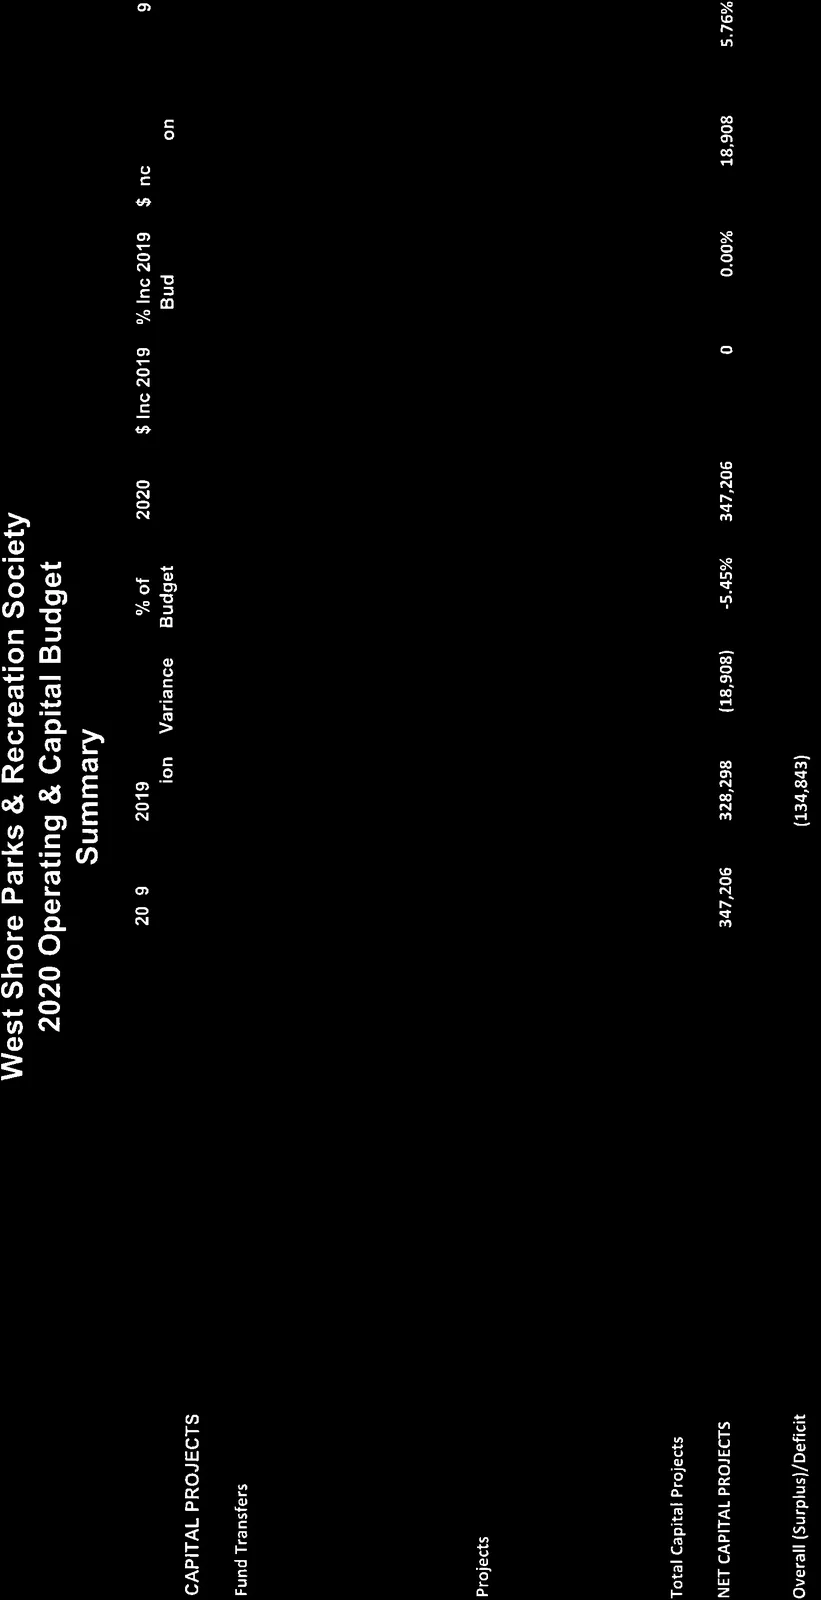
  • Operating income of $347,206 maintained

Total Operating Changes: Net Expense increased $123,500

Total Capital Changes: Net Expense maintained

FINANCIAL IMPLICATIONS:

The 2020 Budget and requisition request of $5,071,039 is an increase of $123,500 or 2.50% over the approved 2019 Budget requisition.


Grant Brown
Manager of Finance

Sandy Clarke
Acting Administrator


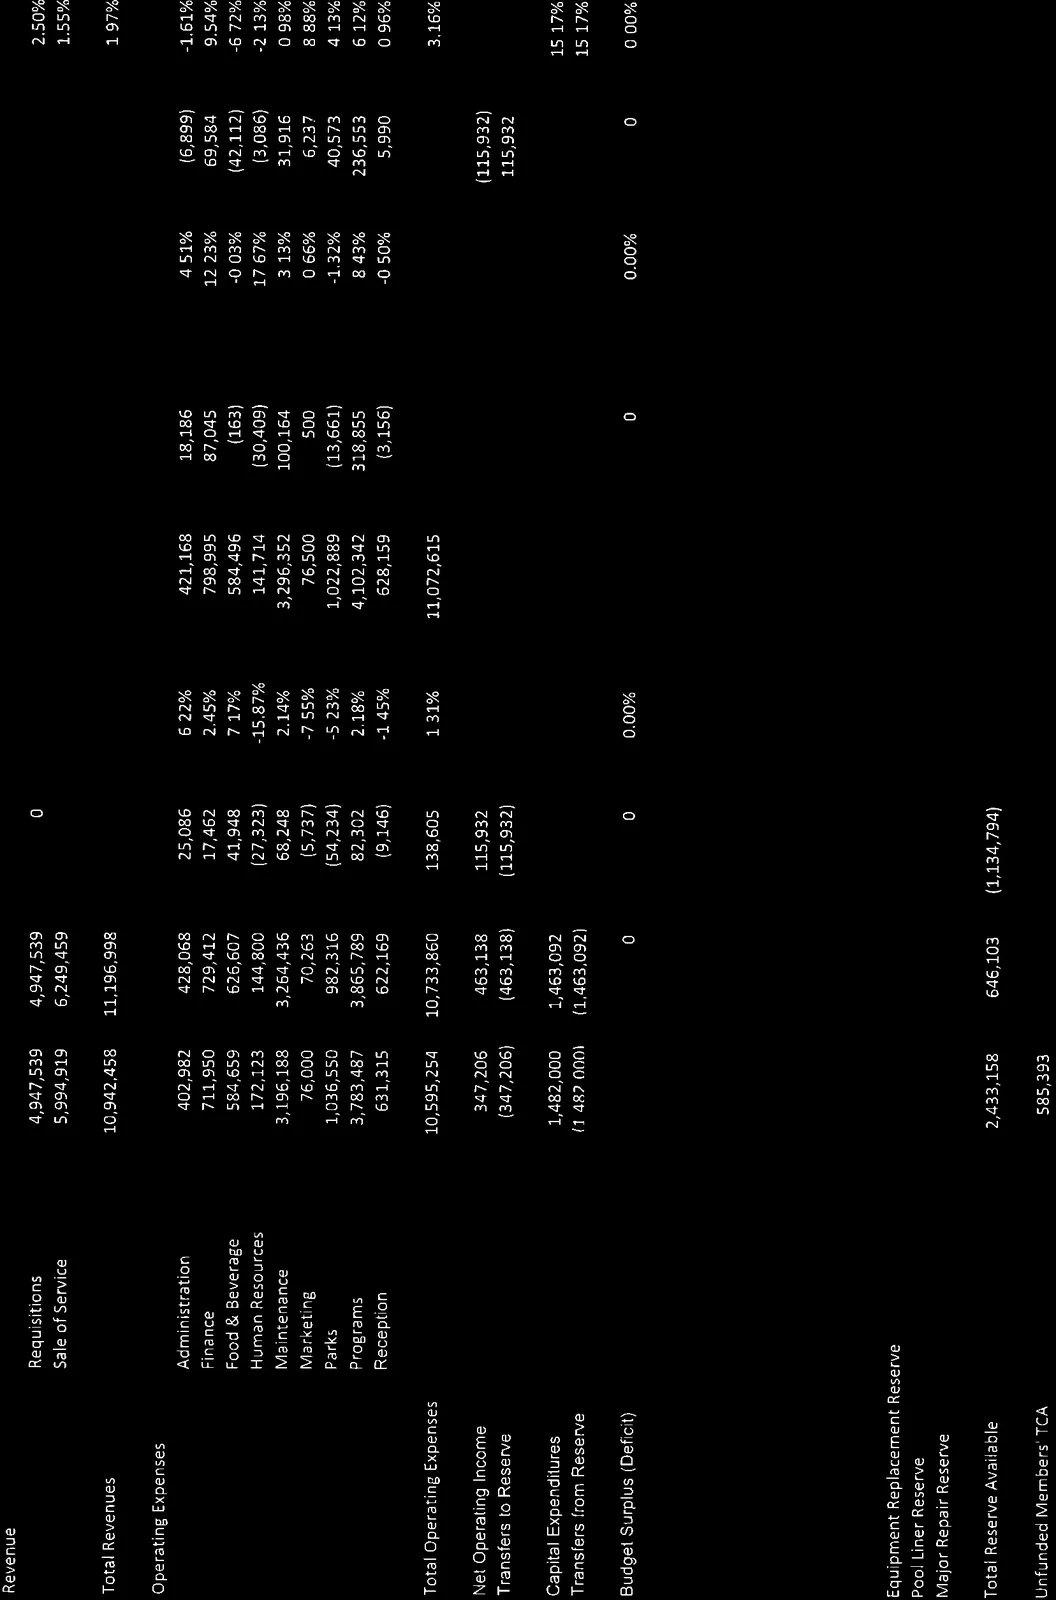
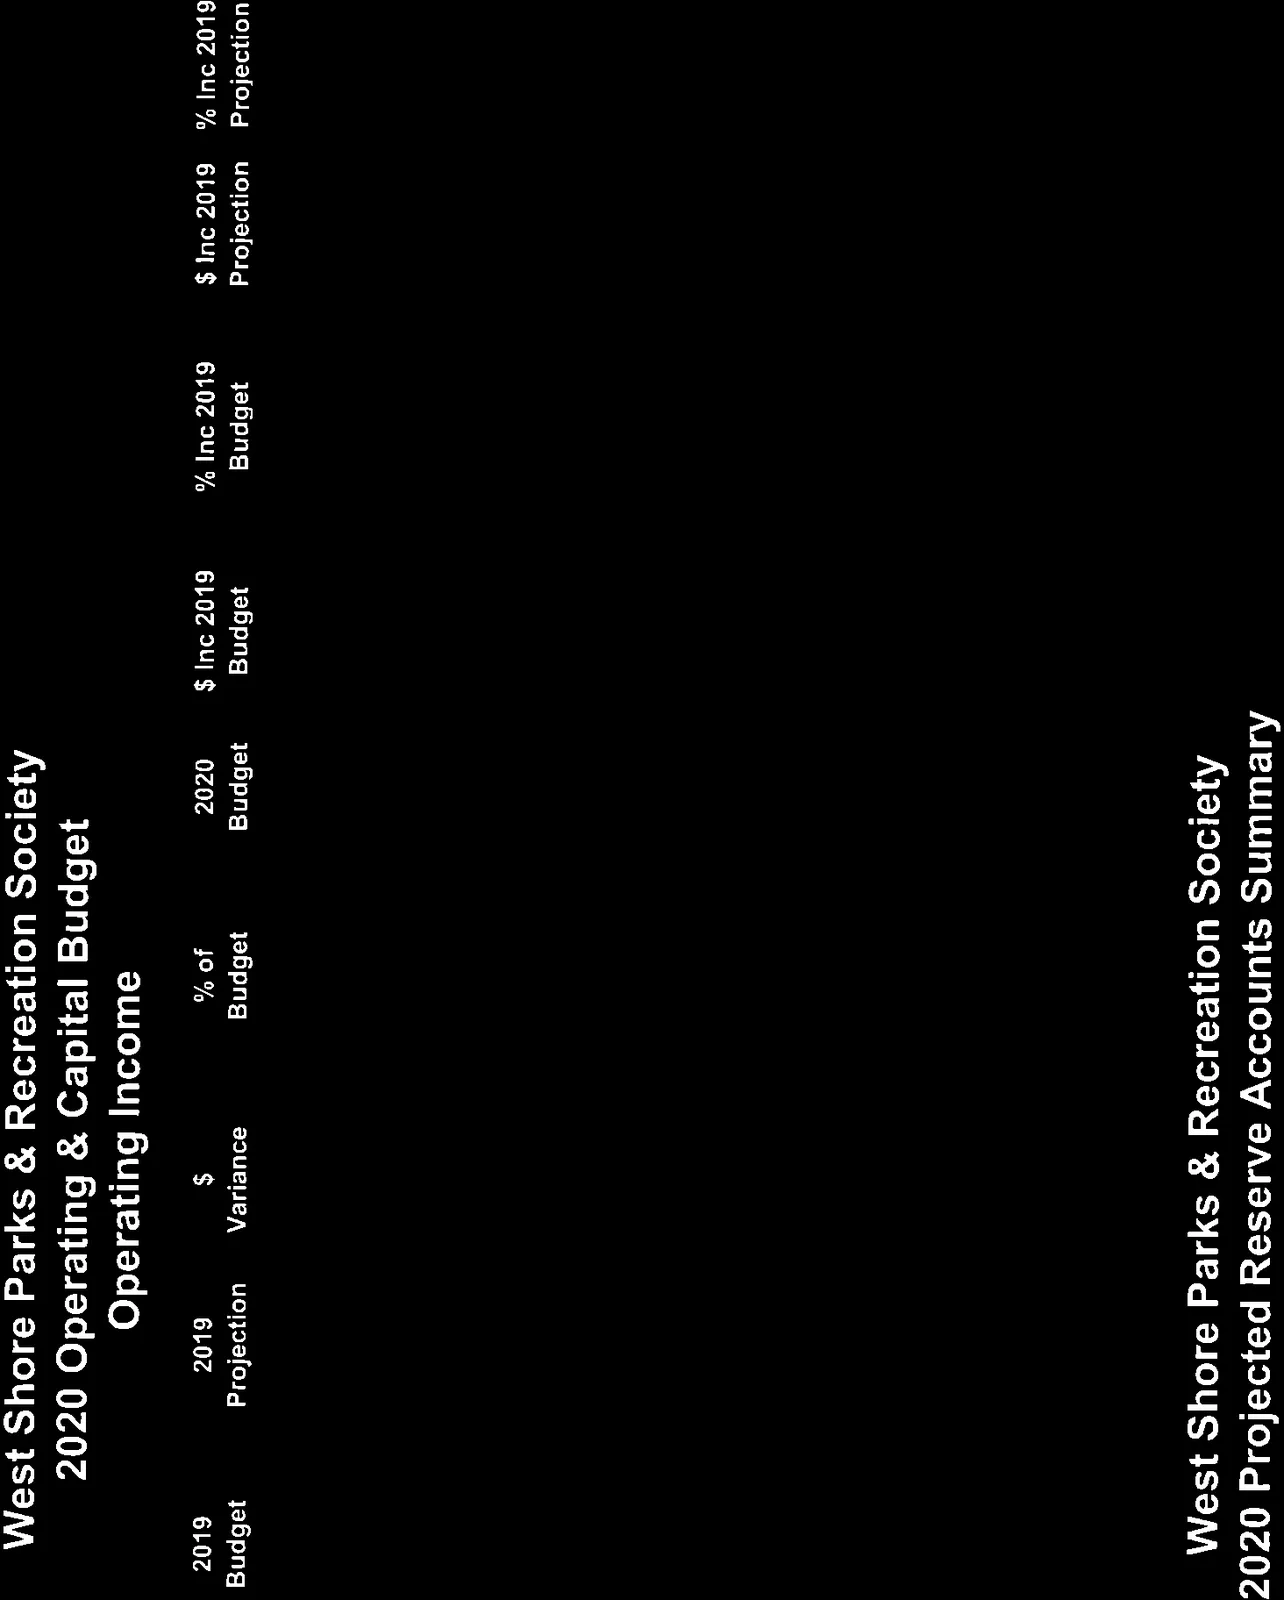
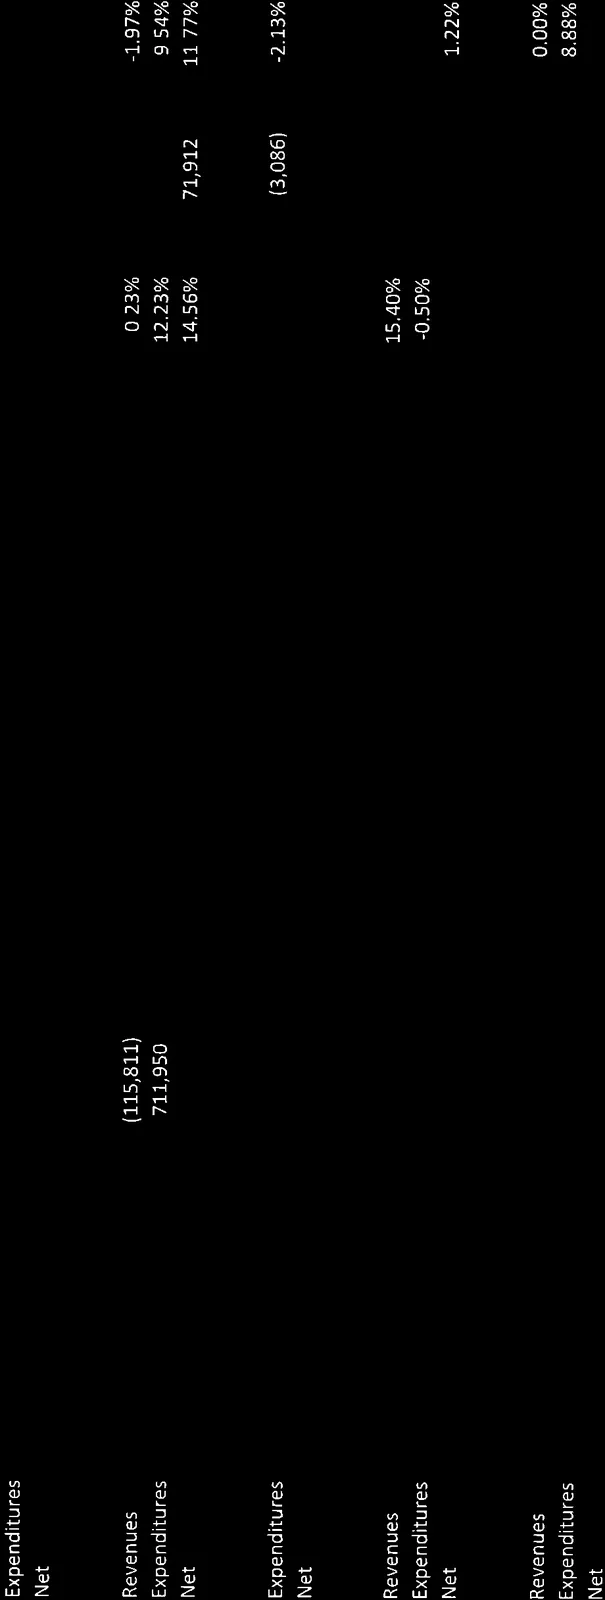
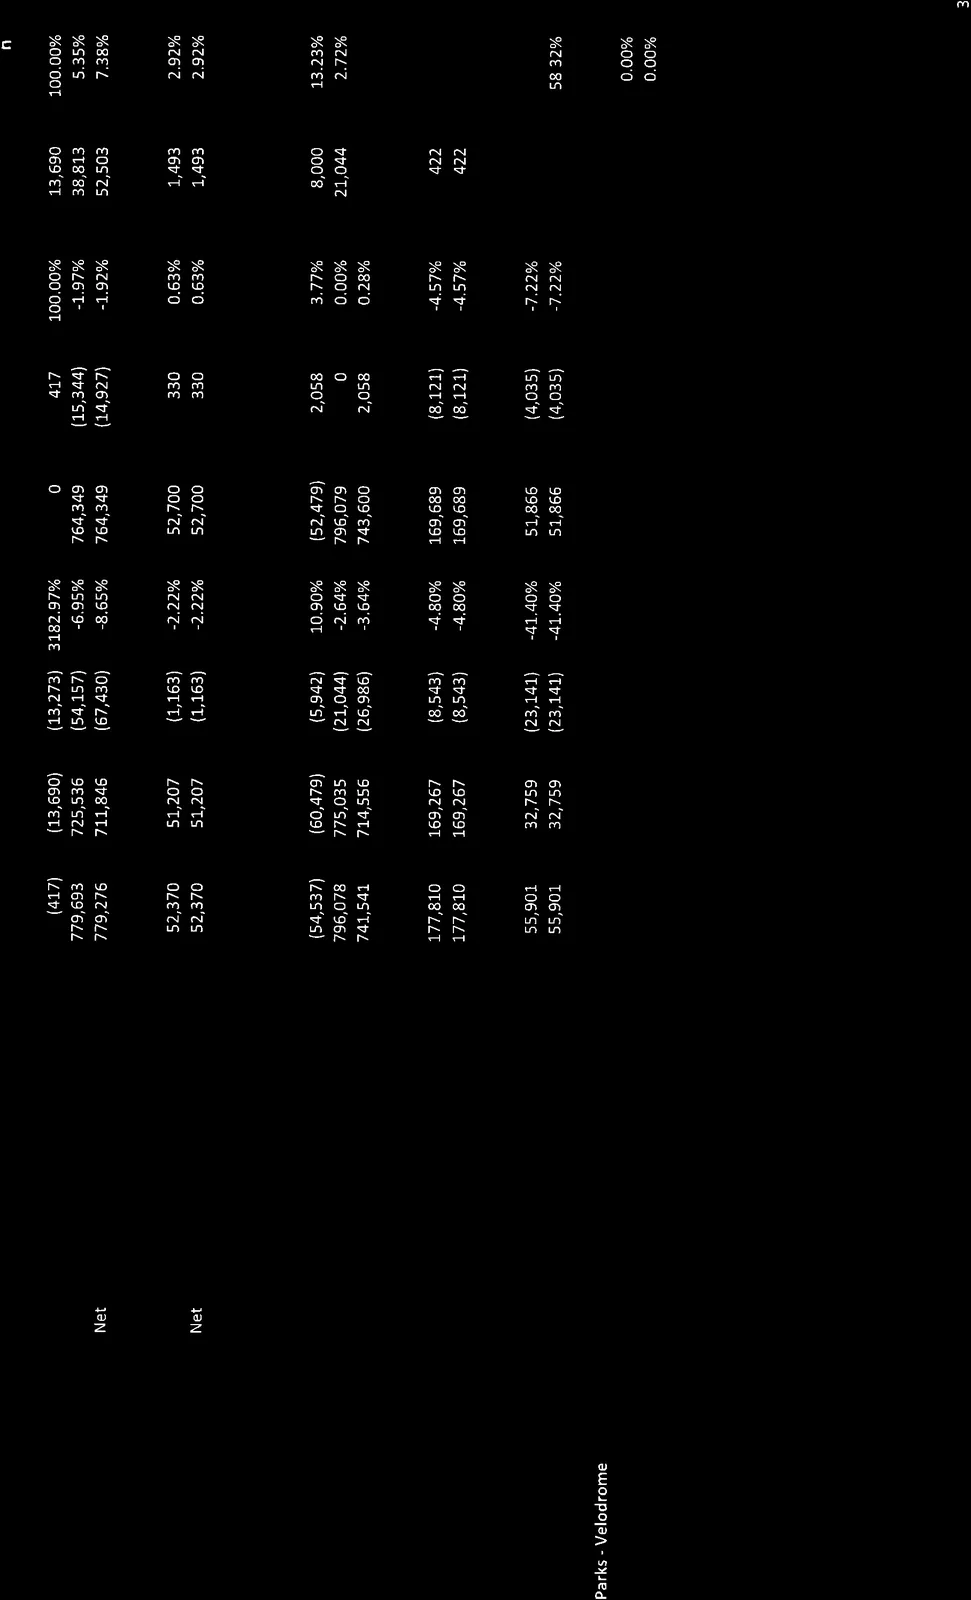
Detailed financial table: "West Shore Parks & Recreation Society 2020 Operating & Capital Budget Operating Income" (rotated table spanning revenues, expenditures, projections, variances)
Page 34–54

SUMMARY

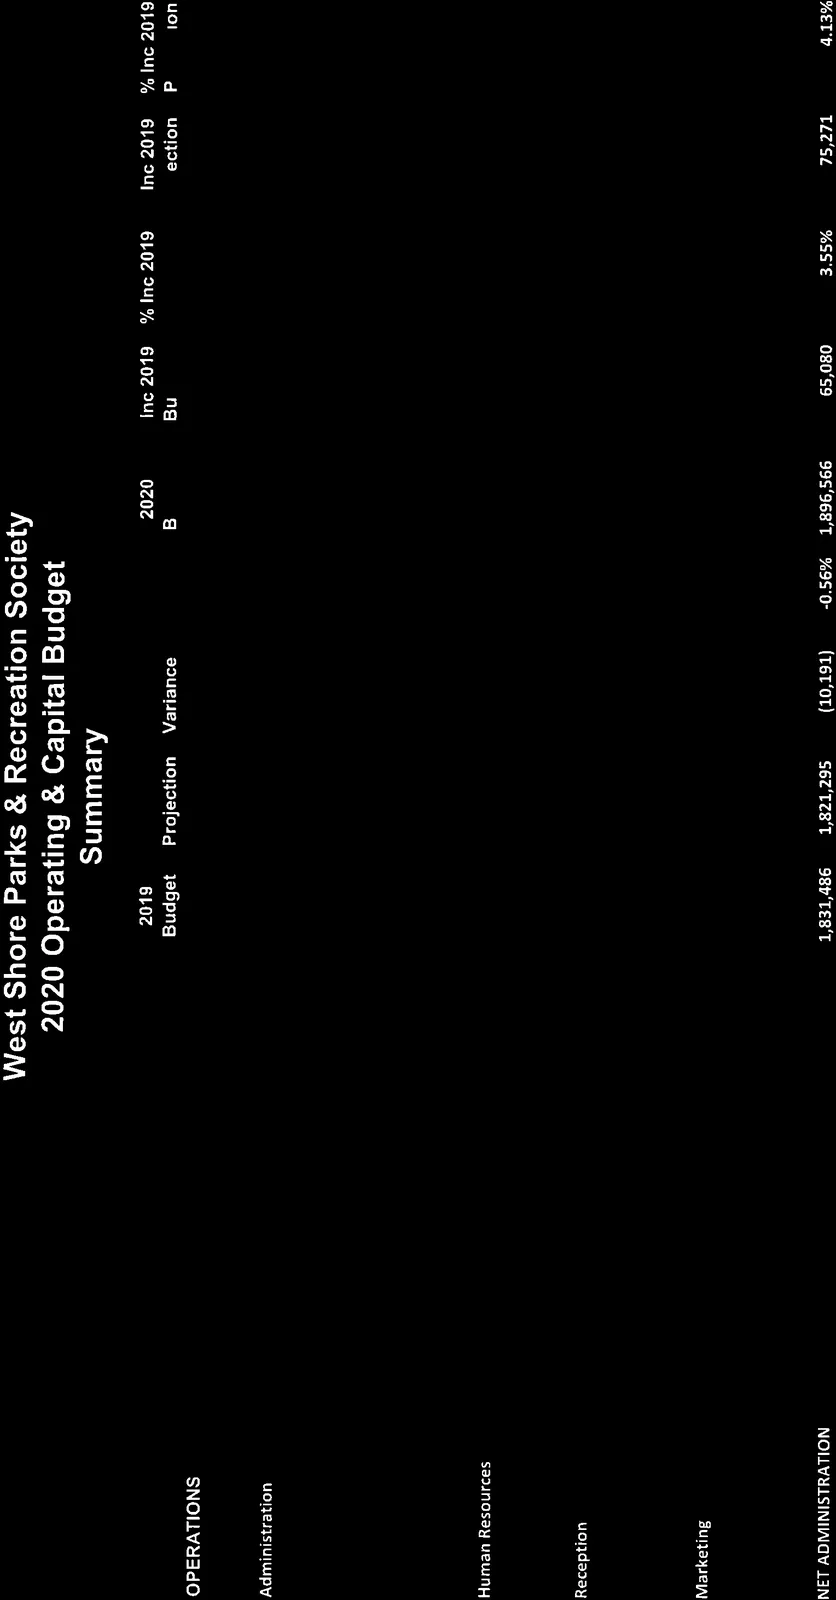
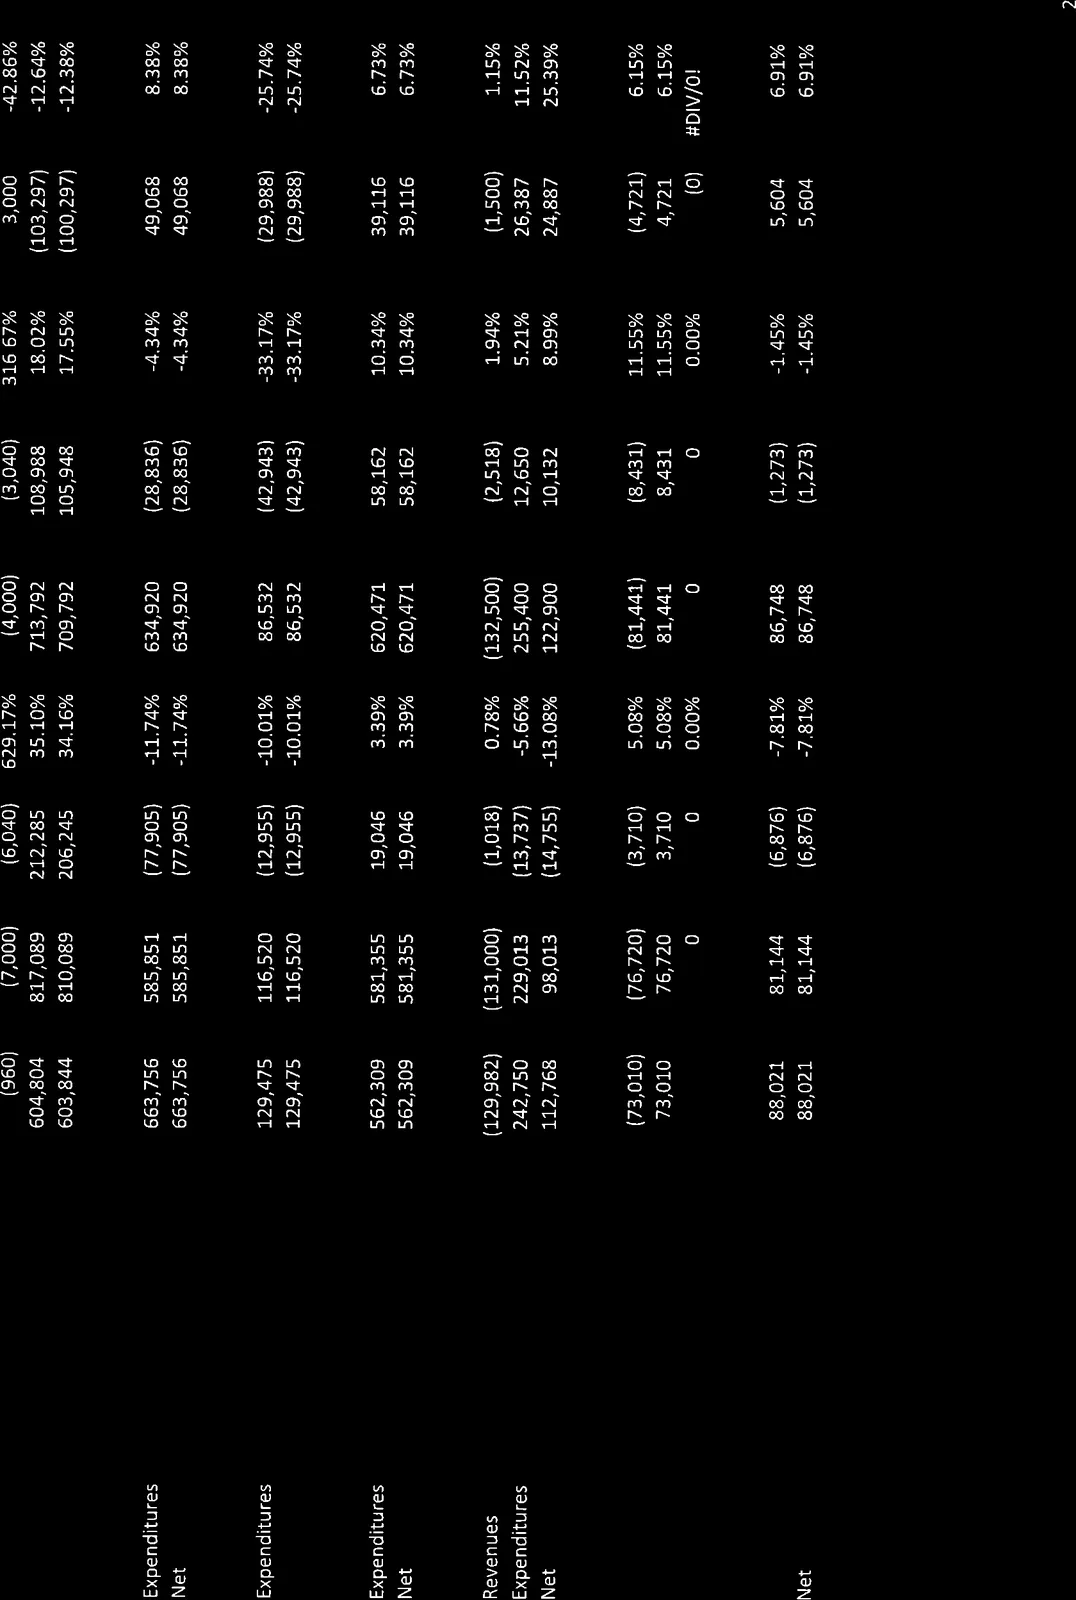
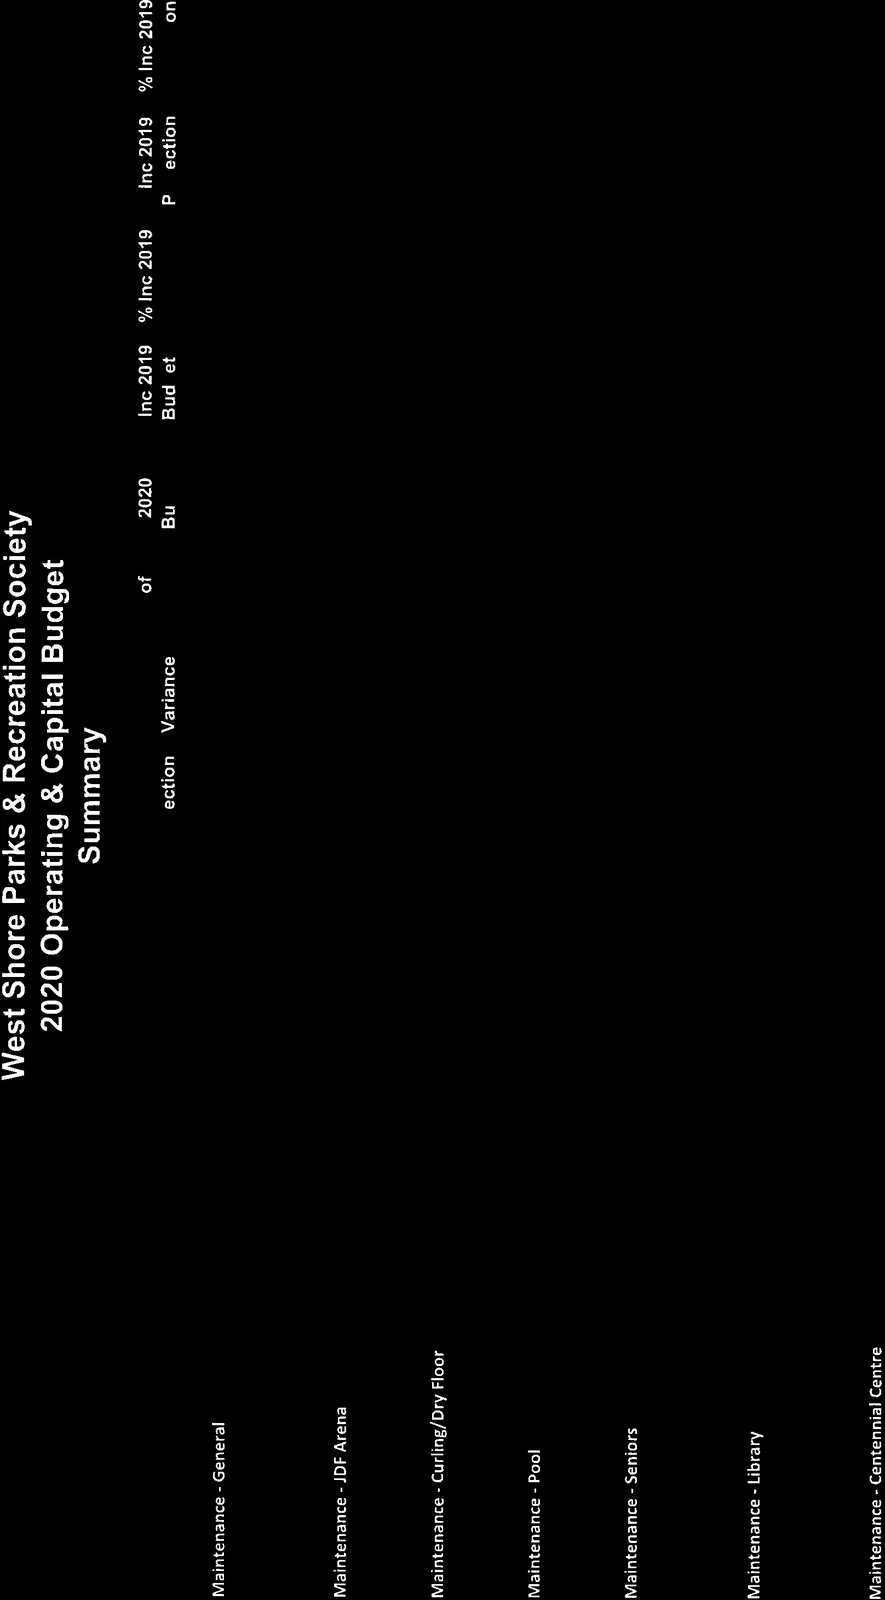
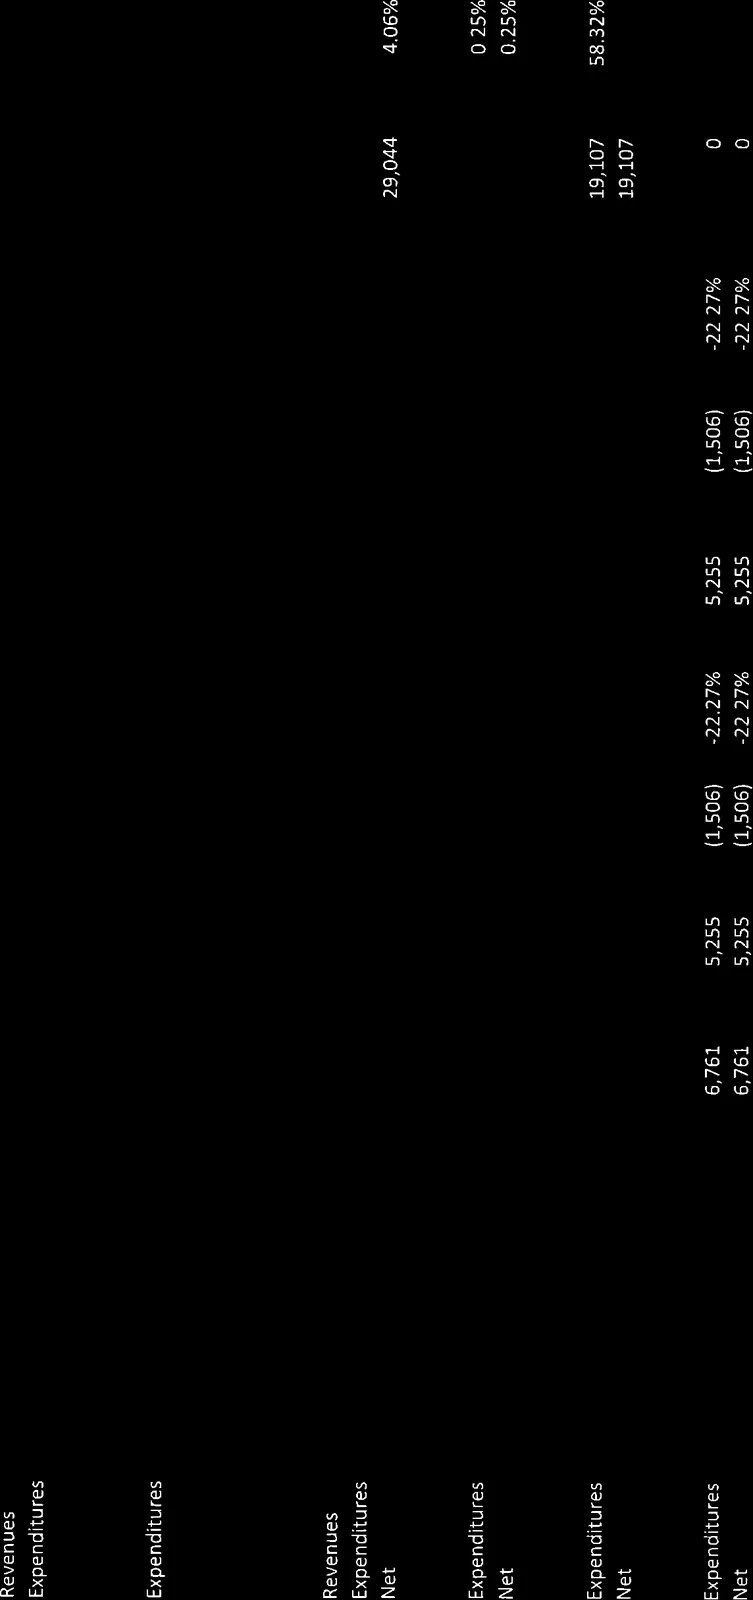
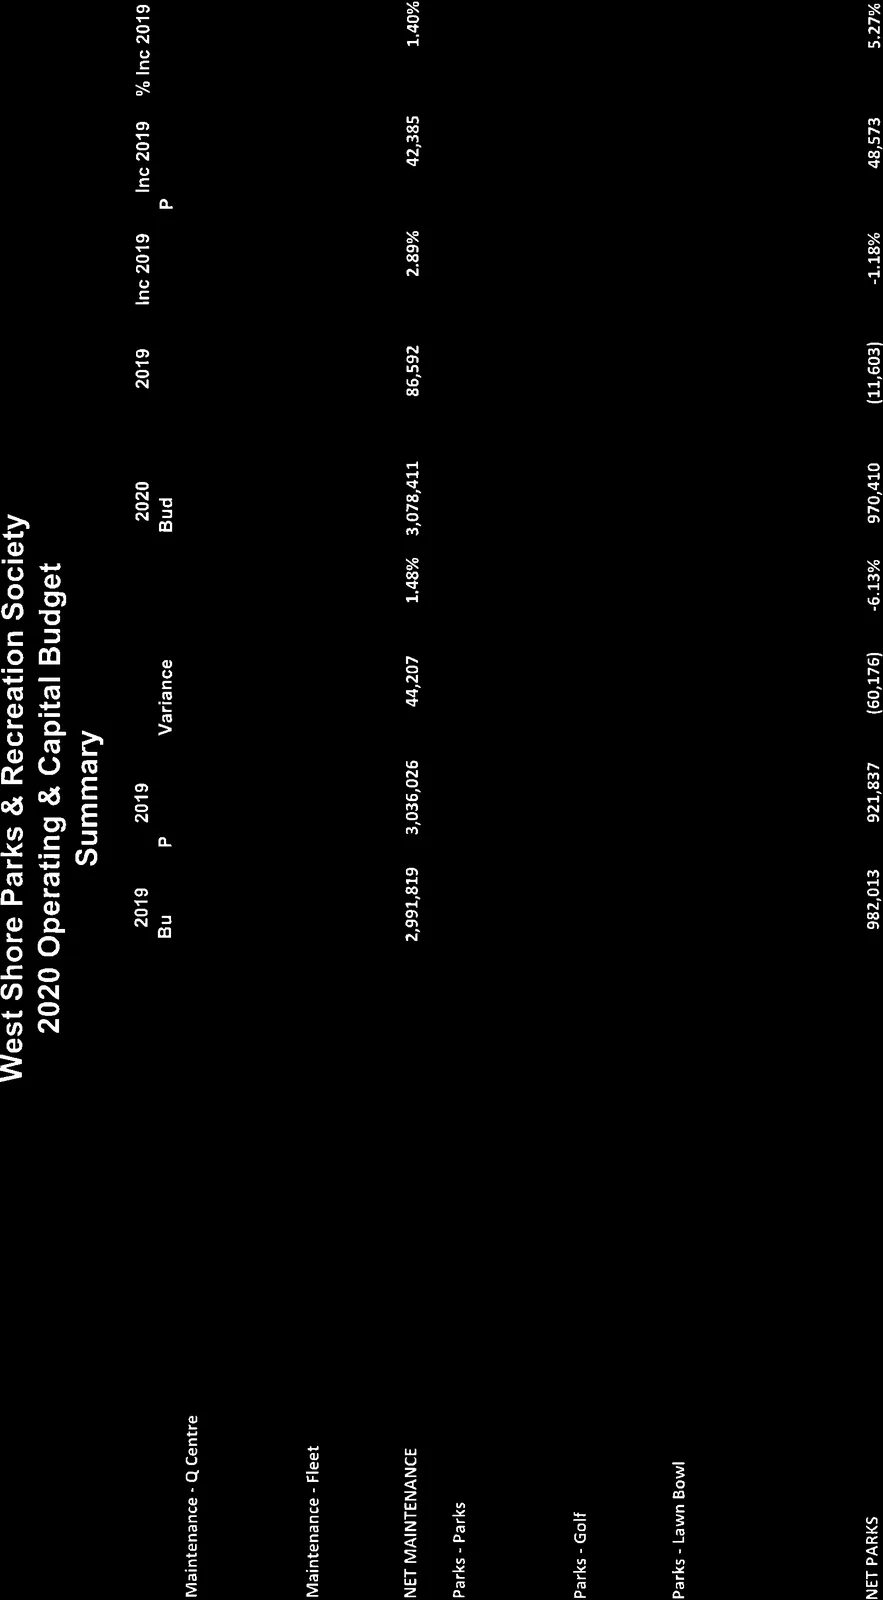
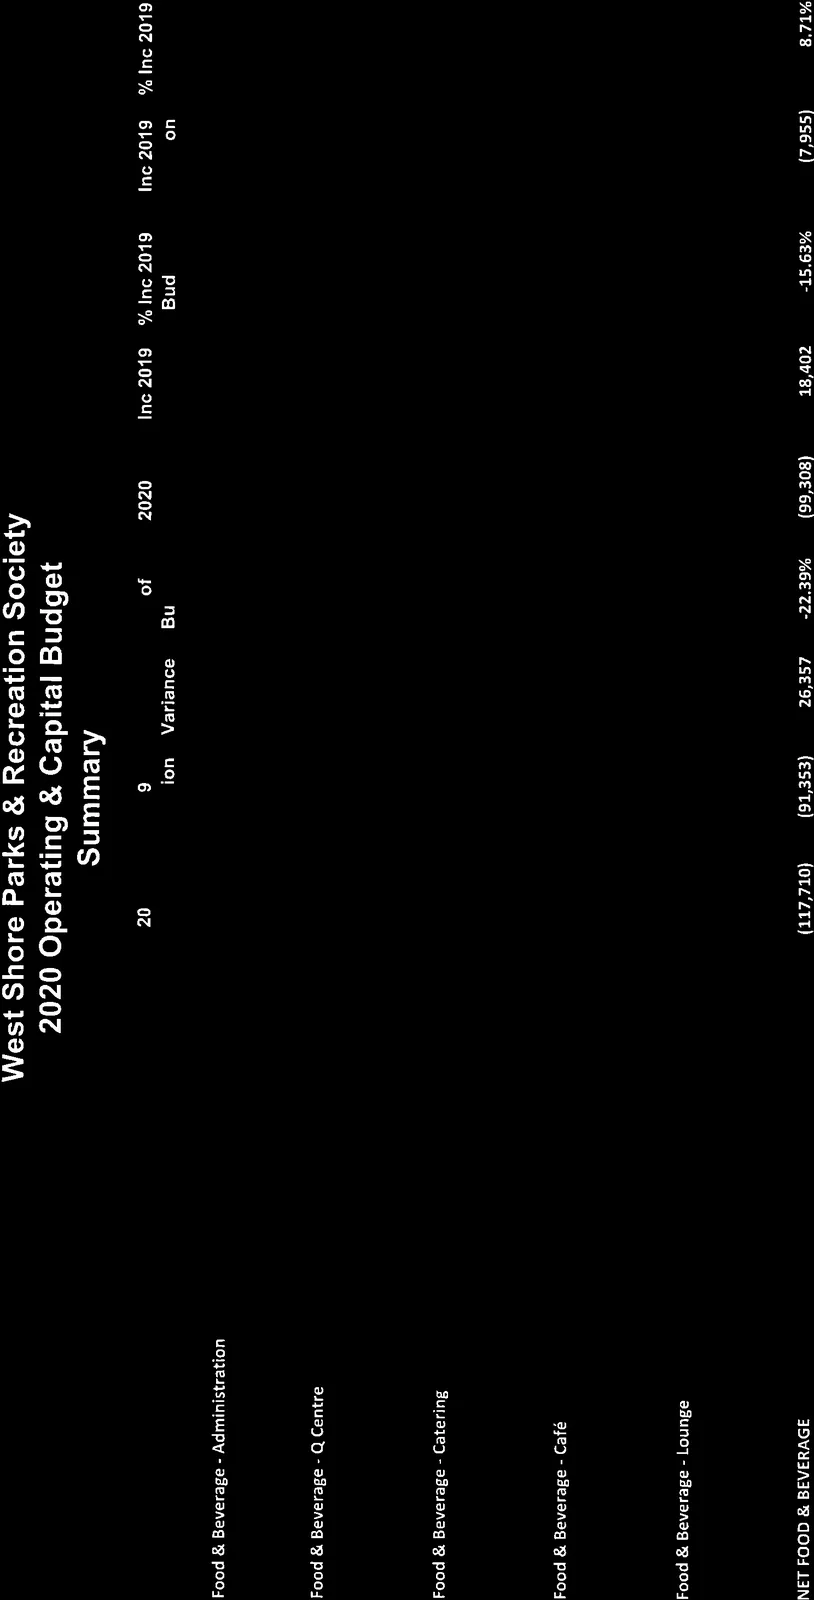
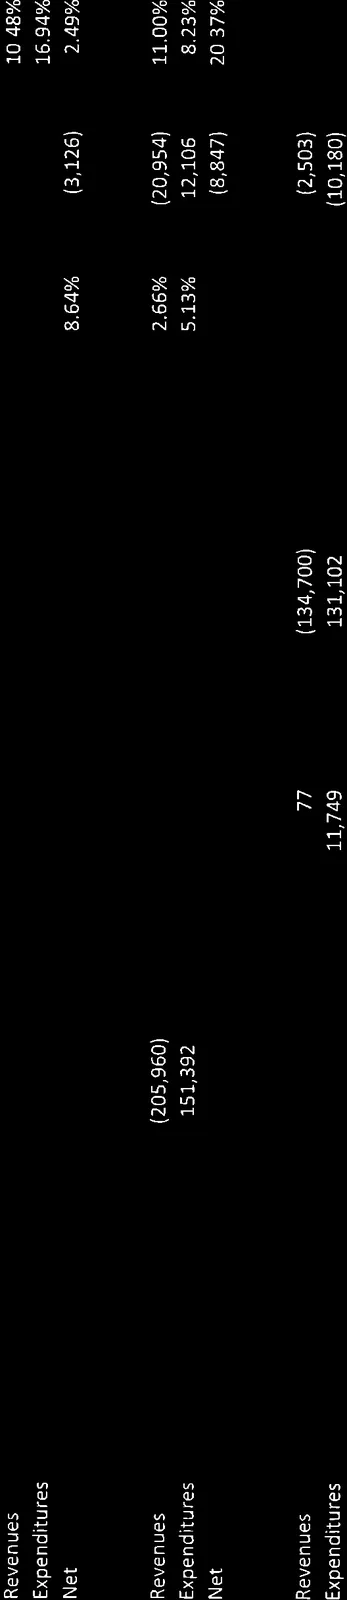
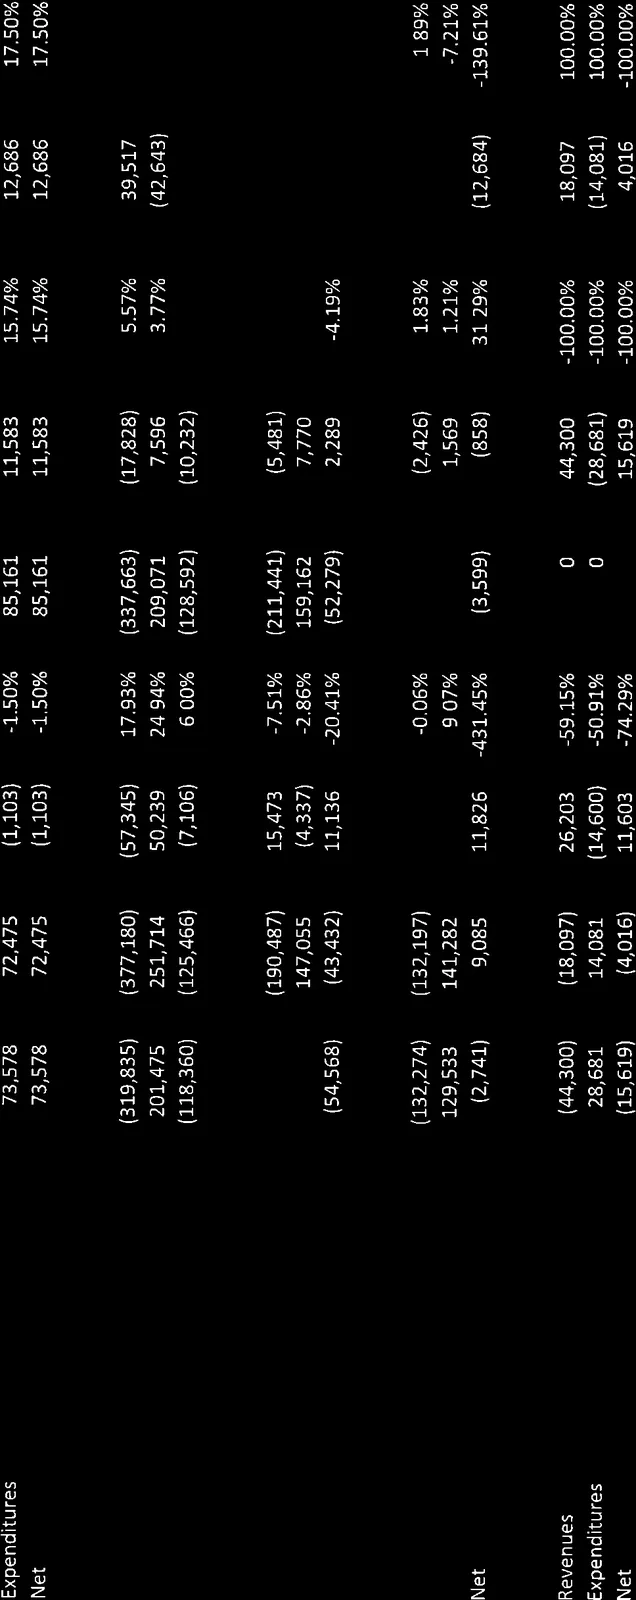
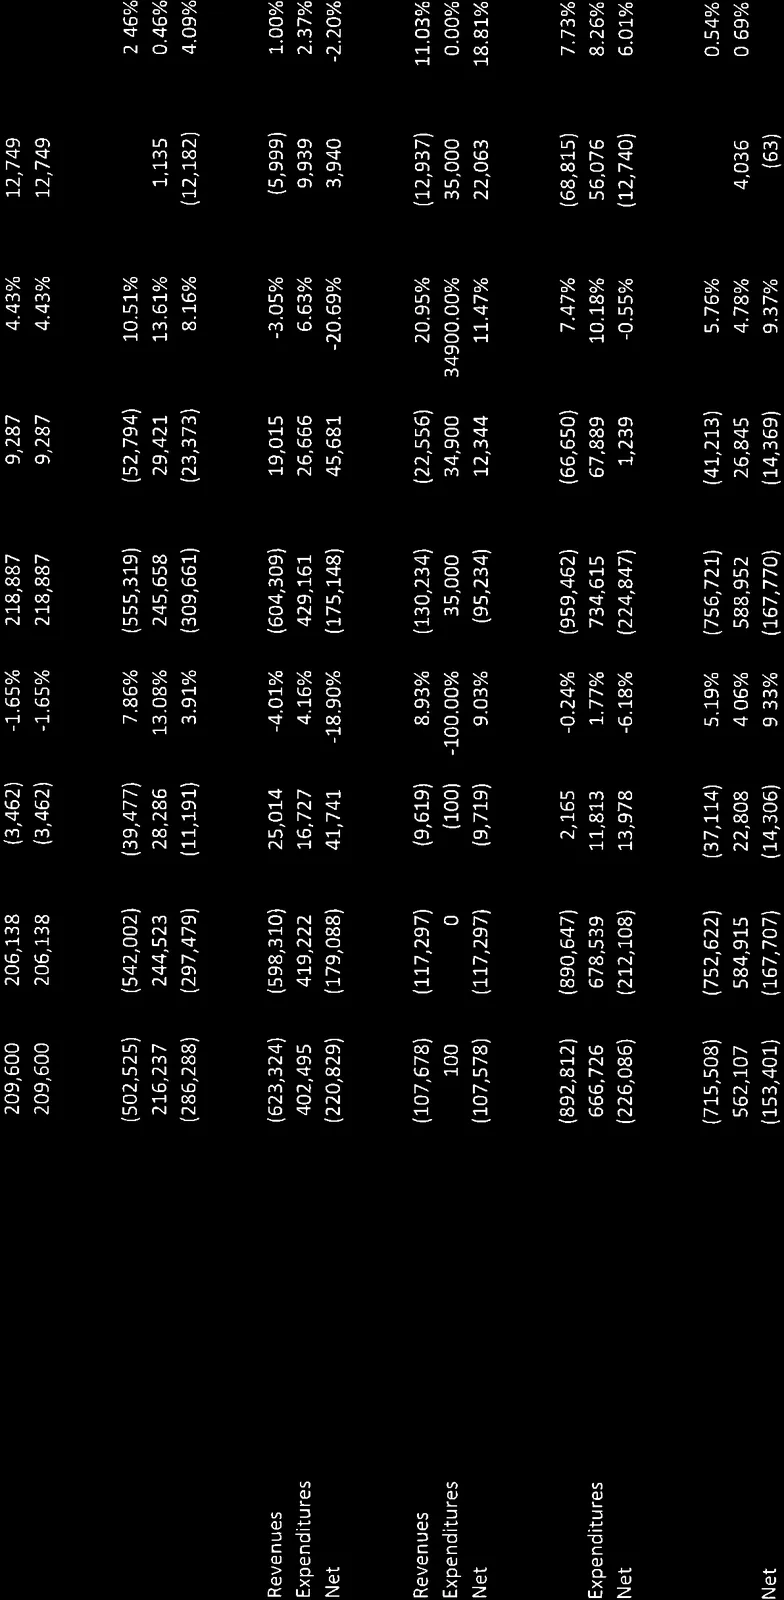
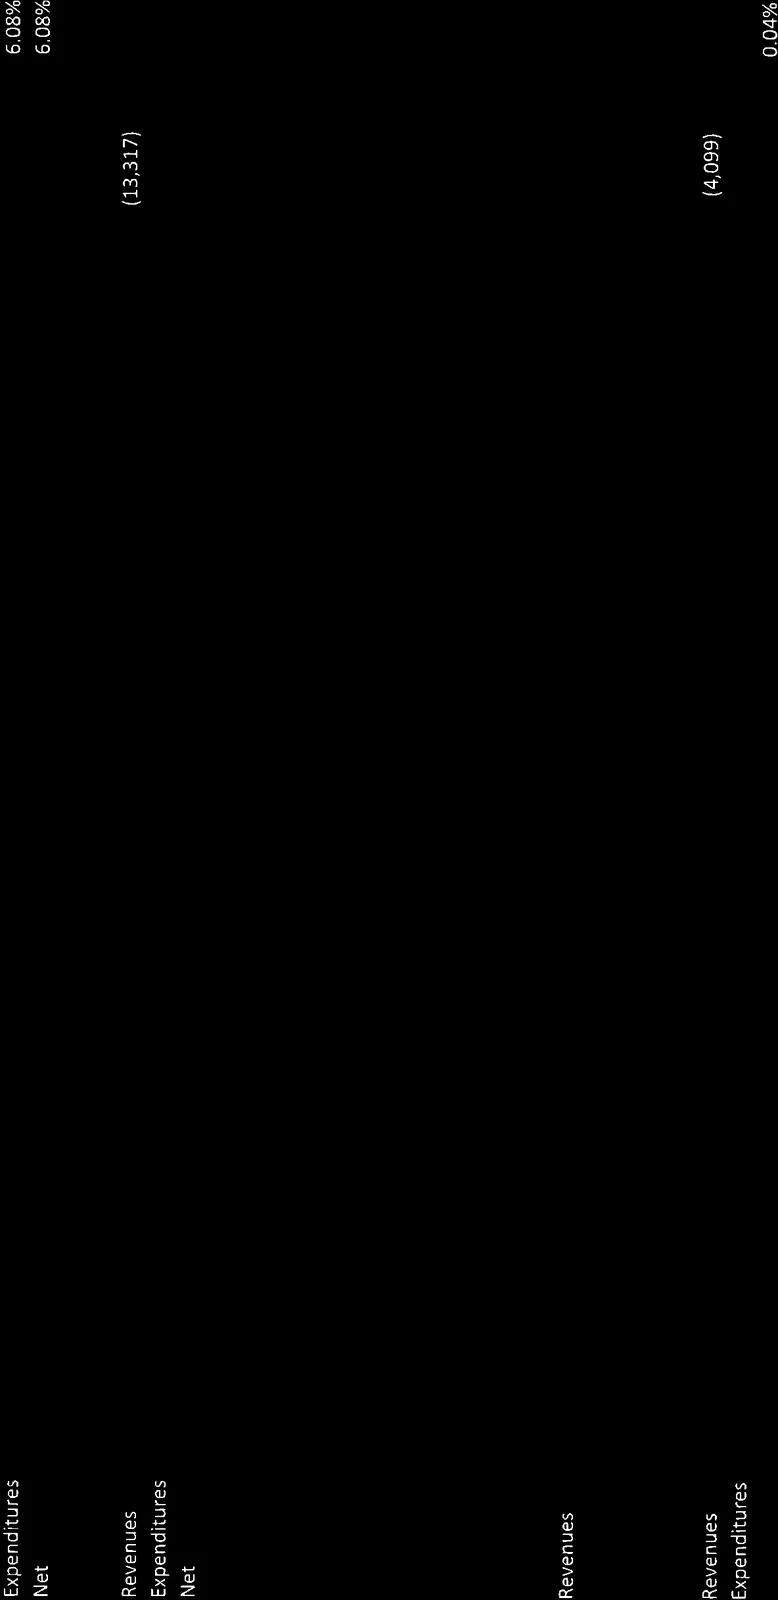
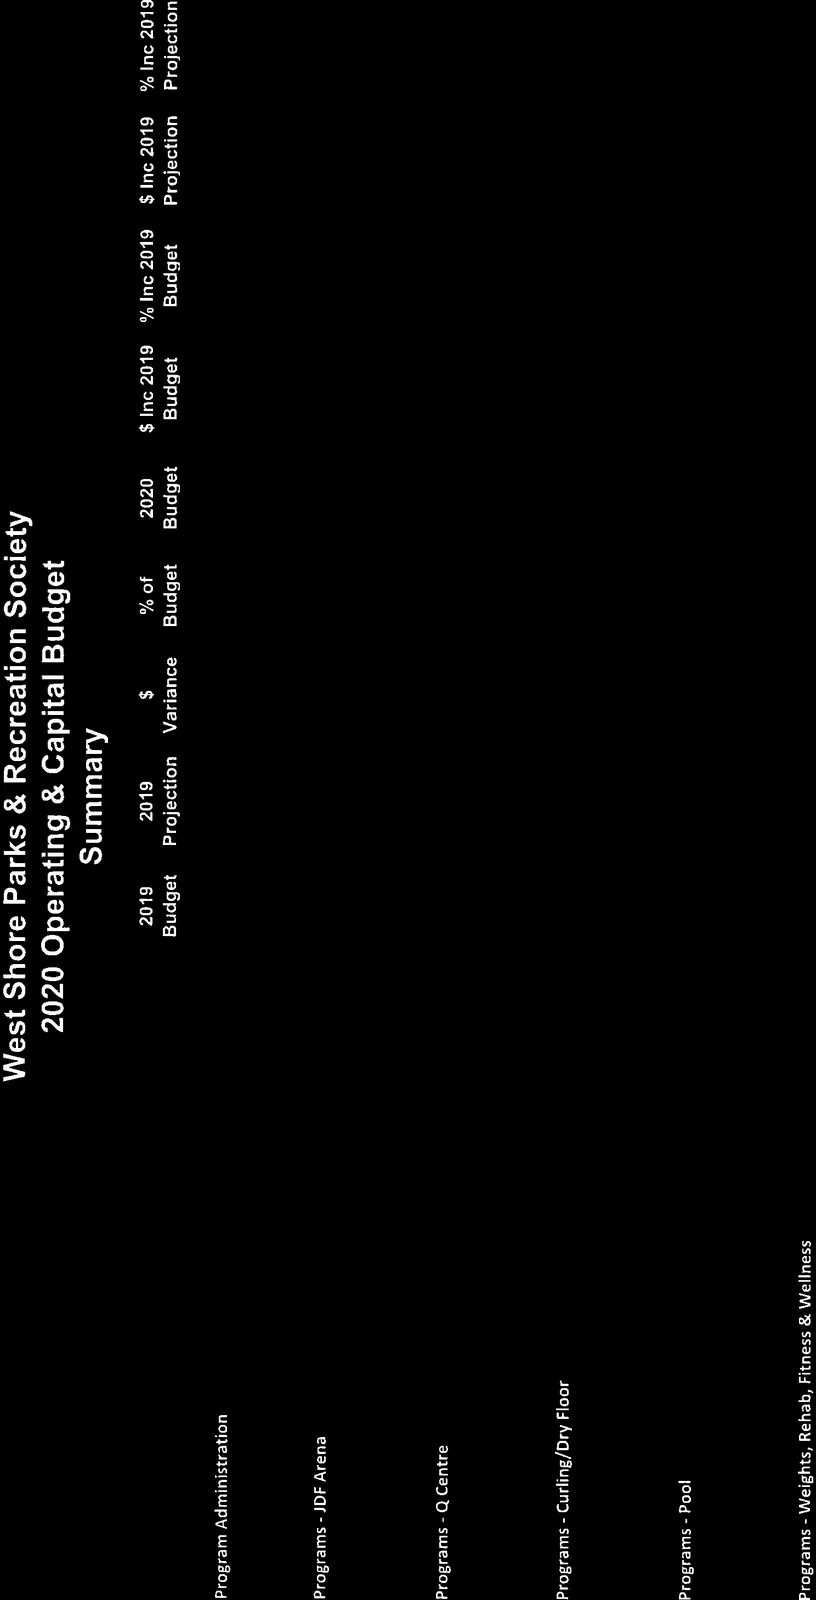
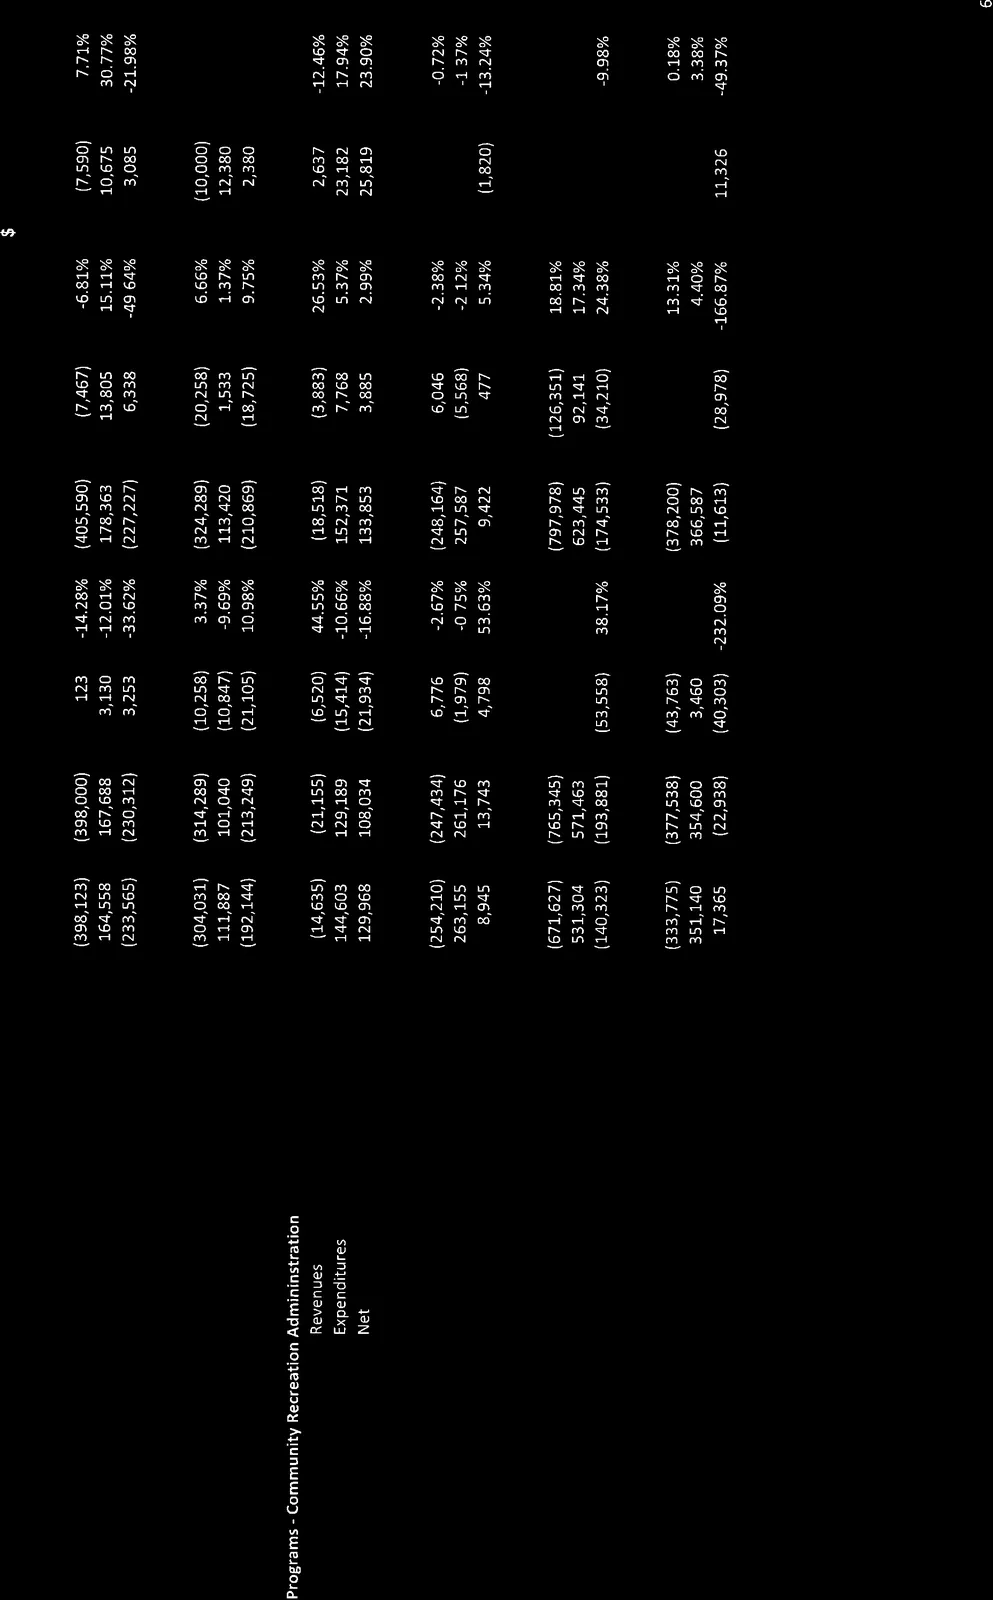
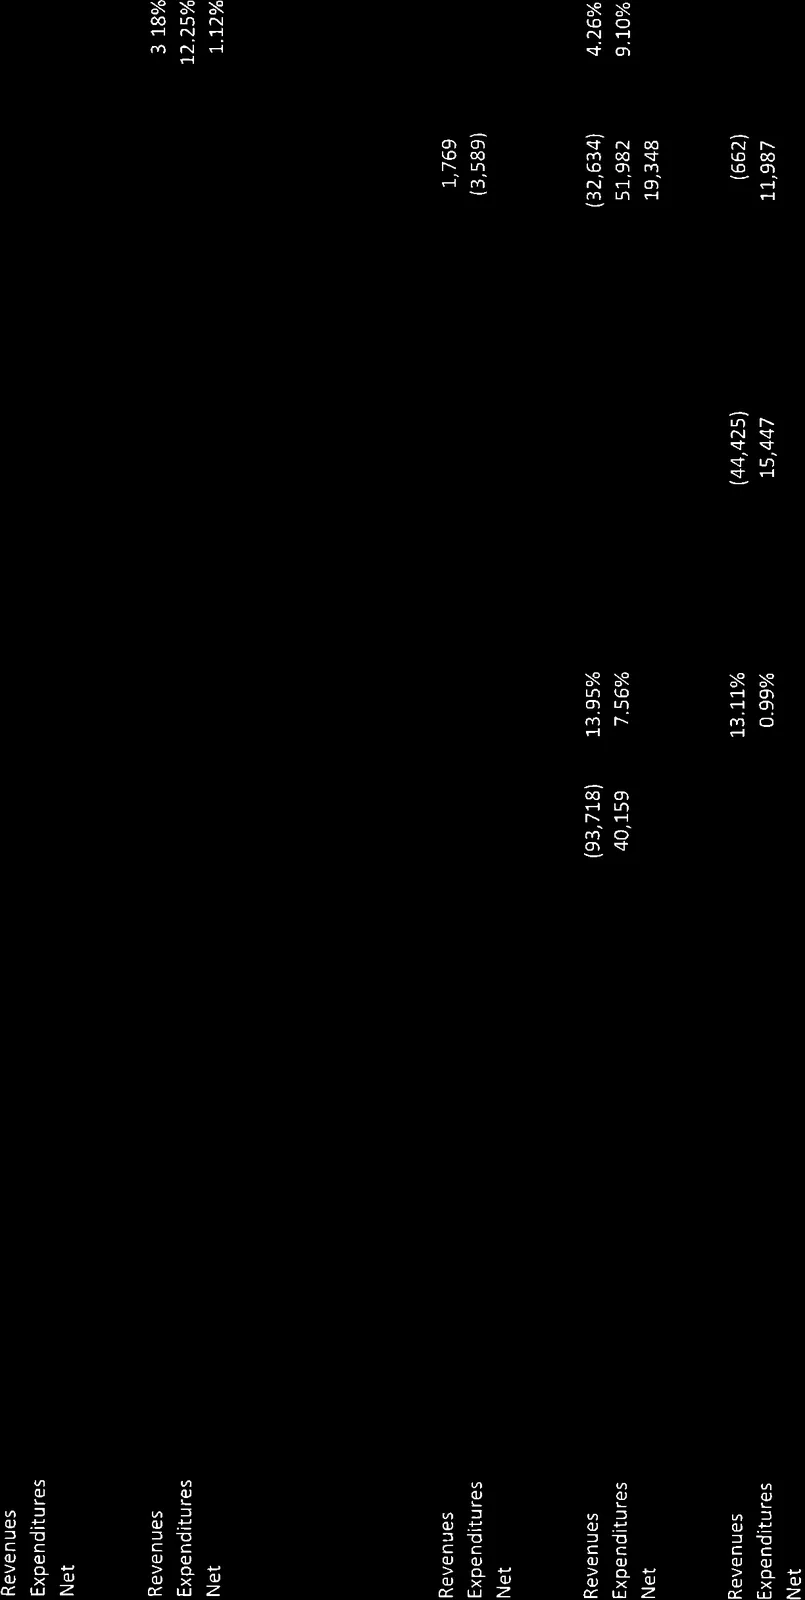
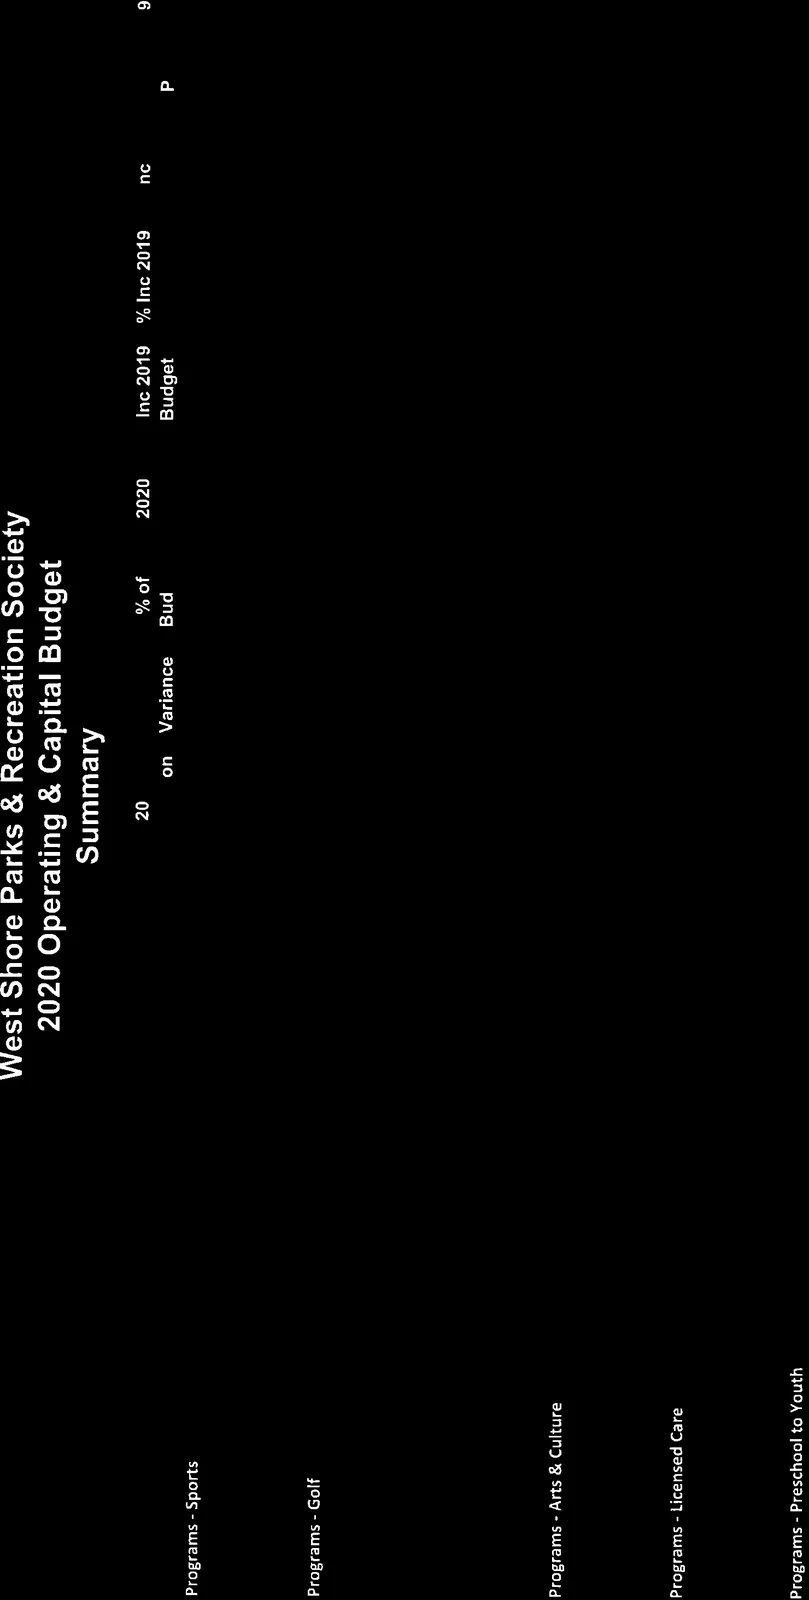
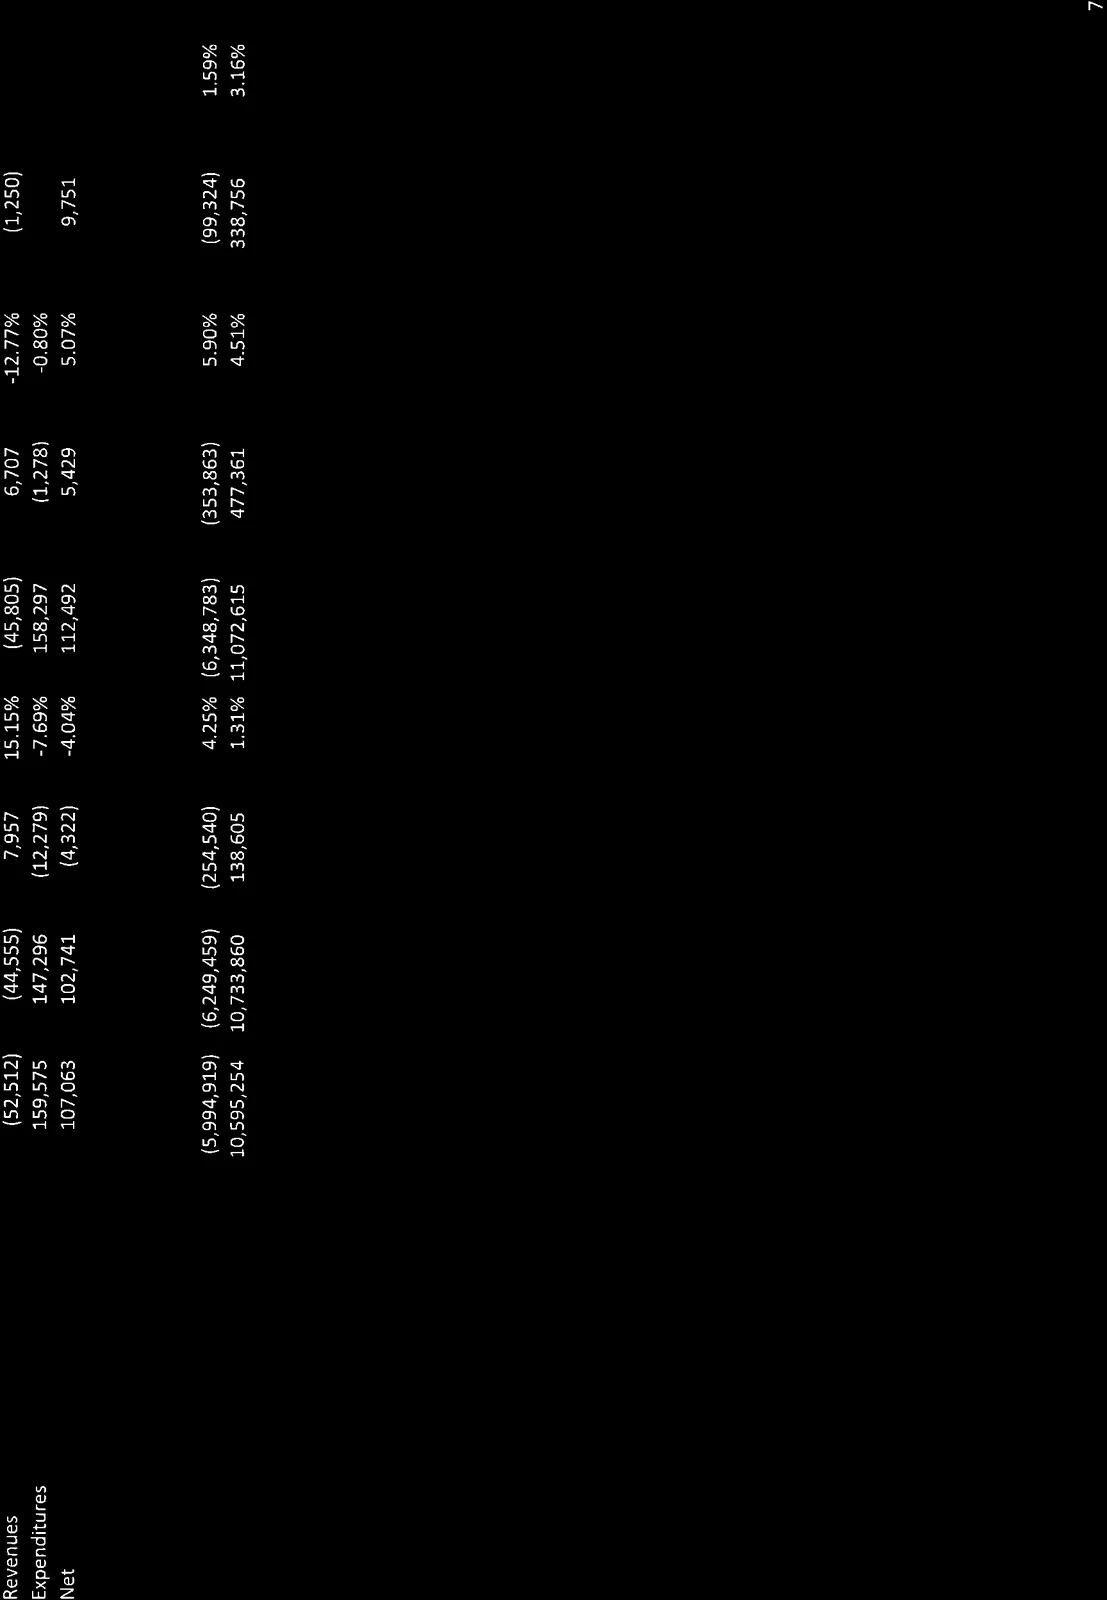
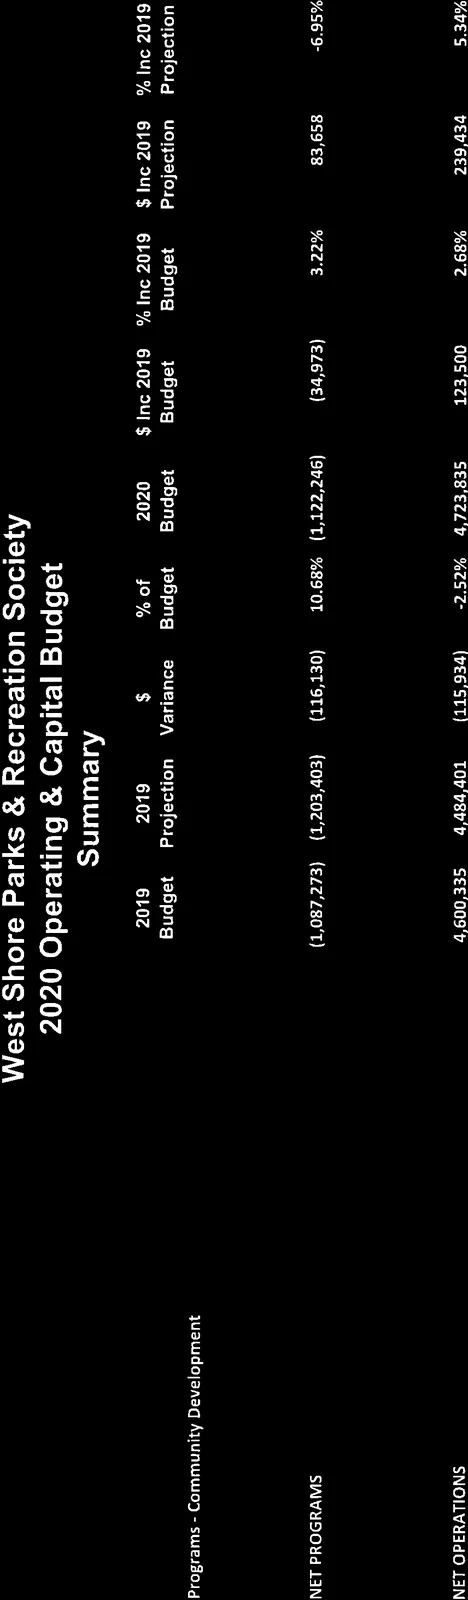
Large summary tables for departmental revenues, expenditures, and net amounts titled "West Shore Parks & Recreation Society 2020 Operating & Capital Budget Summary" (multiple rotated pages of tables)
  • The Summary section contains detailed departmental breakdowns including Administration, Finance, Human Resources, Reception, Marketing, Maintenance (General, JDF Arena, Curling/Dry Floor, Pool, Seniors, Library, Centennial Centre, Centre, Fleet), Parks (Parks, Golf, Lawn Bowl, Velodrome), Food & Beverage (Administration, Q Centre, Catering, Café, Lounge), Programs (Administration, JDF Arena, Q Centre, Curling/Dry Floor, Pool, Weights, Rehab, Fitness & Wellness, Sports, Golf, Community Recreation Administration, Arts & Culture, Licensed Care, Preschool to Youth), NET Programs/Operations, and NET Parks/ Food & Beverage.

  • The departmental tables show 2019 Budget, 2019 Projection, Variance, 2020 Budget, % Inc 2019 vs 2019 Projection, and $ Inc 2019 vs 2019 Projection for Revenues, Expenditures, and Net.

Page with capital projects summary and fund transfers titled "CAPITAL PROJECTS" with Fund Transfers and Projects listed and amounts

CAPITAL PROJECTS (summary)

  • Fund Transfers and Projects include:
    • Fitness Equipment Reserve
    • Bus Replacement Reserve
    • JDF Arena Floor Replacement Reserve
    • Equipment & Maintenance Reserve
    • Small Equipment
    • Fitness Equipment
    • Vehicle Replacement - Purchases
    • Vehicle Replacement - Disposals
    • Large Project and Purchases
    • Major Plant Maintenance
Table showing Total Capital Projects and NET CAPITAL PROJECTS and Overall (Surplus)/Deficit; includes numbers such as $347,206 Operating income maintained and capital totals
Page 34–54

REQUISITIONS

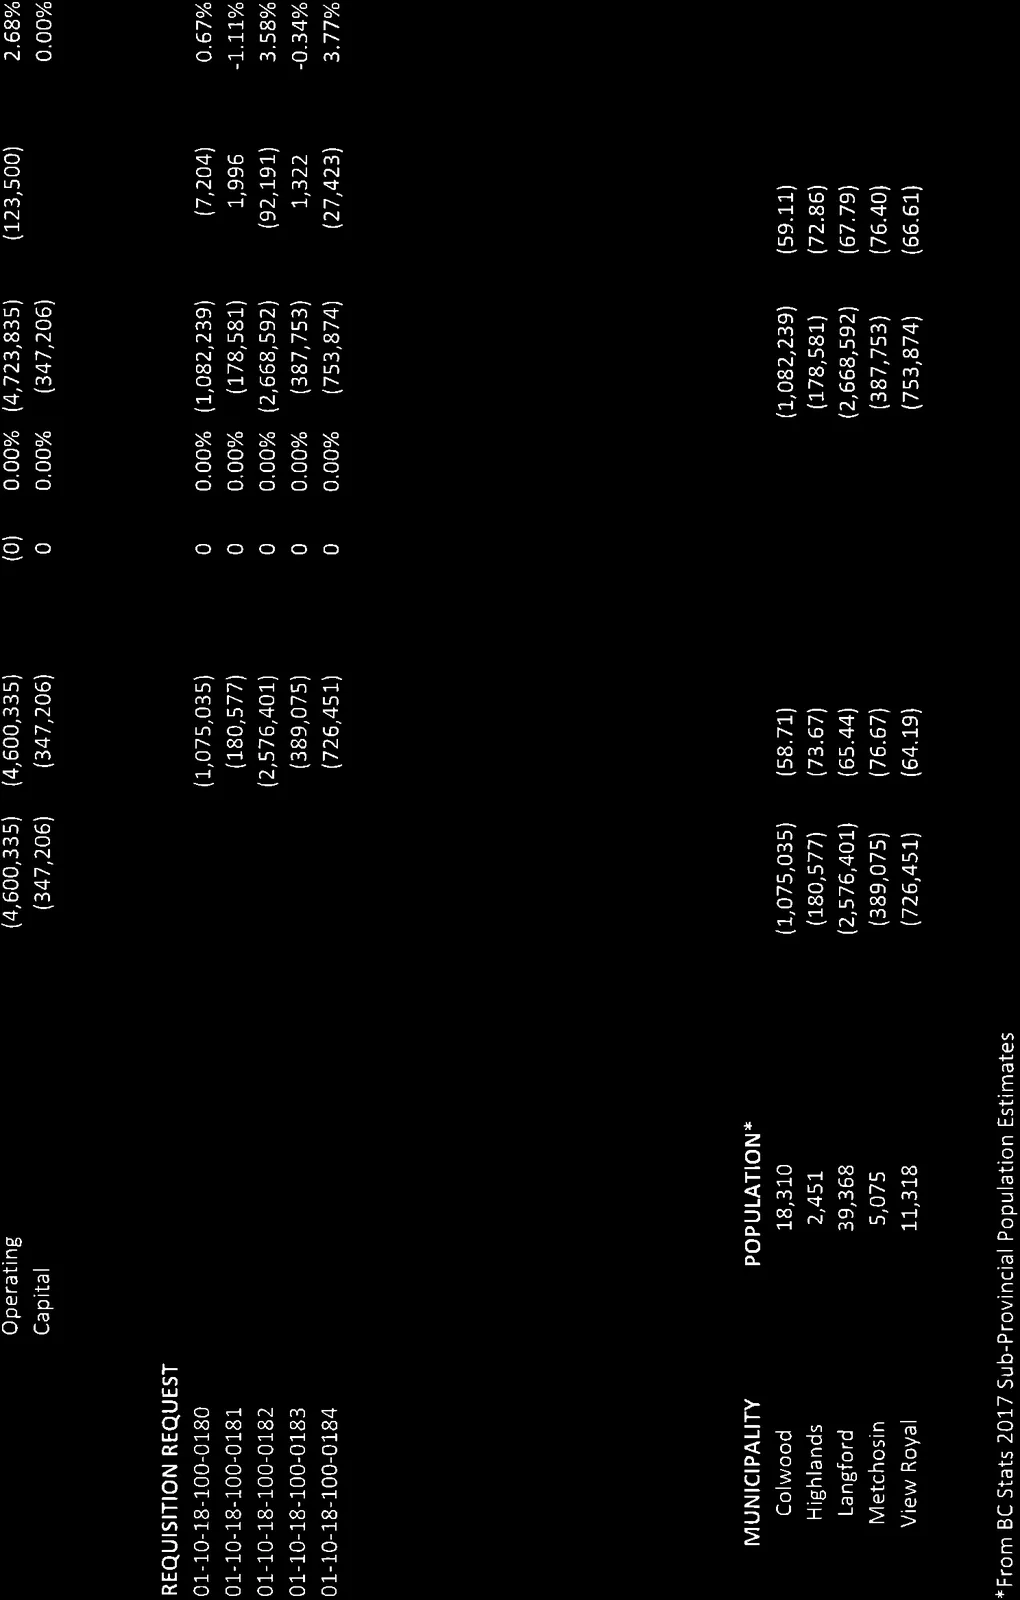
Table titled "West Shore Parks & Recreation Society 2020 Budget Requisition Request" — contains requisition totals and per-member requisition details
  • TOTAL REQUISITIONS: (line items for operating and capital requisitions split per municipality)
    • REQUISITION REQUEST 01-18-100-00-00-0? (multiple requisition codes listed for Colwood, Highlands, Langford, Metchosin, View Royal) — totals and per capita amounts provided.
    • Requisition totals include amounts and show the change from 2019 to 2020 (e.g., 2.50% overall).

Page with rotated "REQUISITION REQUEST" details and a small table with population and per capita amounts

Requisition Detail (per capita / population)

  • POPULATION (from BC STATS 2017 Sub-Provincial Population Estimates)

    • Colwood: 19,004
    • Highlands: 2,431
    • Langford: 39,358
    • Metchosin: 5,075
    • View Royal: 11,318
    • Total: 76,522
  • The Requisition Request per capita and per municipality are provided in the requisition table.

Page 34–54

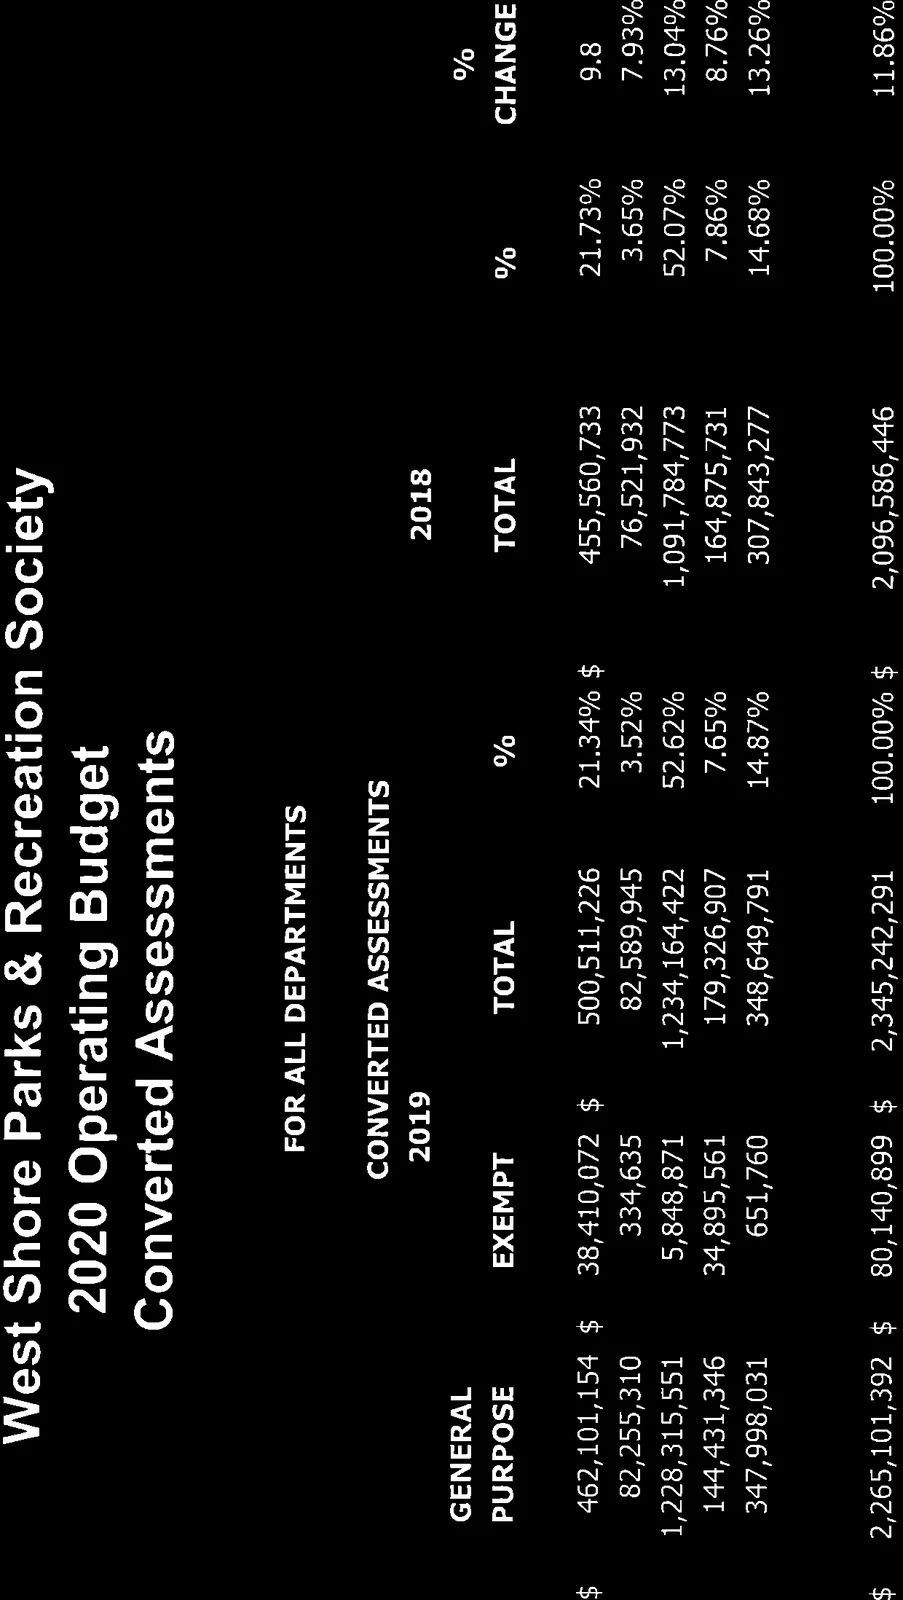
CONVERTED ASSESSMENTS

Heading page "CONVERTED ASSESSMENTS"
Table titled "West Shore Parks & Recreation Society 2020 Operating Budget Converted Assessments" showing Converted Assessments for all departments across member municipalities and percentage changes vs prior year; includes columns such as GENERAL PURPOSE, EXEMPT, TOTAL, % and $ CHANGE. Municipalities listed: City of Colwood, District of Highlands, City of Langford, District of Metchosin, Town of View Royal. Totals for 2019 and 2018 are provided.
Page 34–54

REQUIRED TABLES & SUMMARIES

Several pages of rotated financial tables including departmental line-by-line budgets, projections, variances, and percent changes
  • These tables include all detailed line items for each department and program with 2019 Budget, 2019 Projection, 2020 Budget, Variance, % changes, and $ changes.
  • They also include NET OPERATIONS, NET PARKS, NET FOOD & BEVERAGE, NET PROGRAMS, and aggregated NET OPERATIONS totals.
Page 34–54

5 YEAR OPERATING & CAPITAL FORECAST (2020-2024)

Heading page "5 YEAR OPERATING & CAPITAL FORECAST"

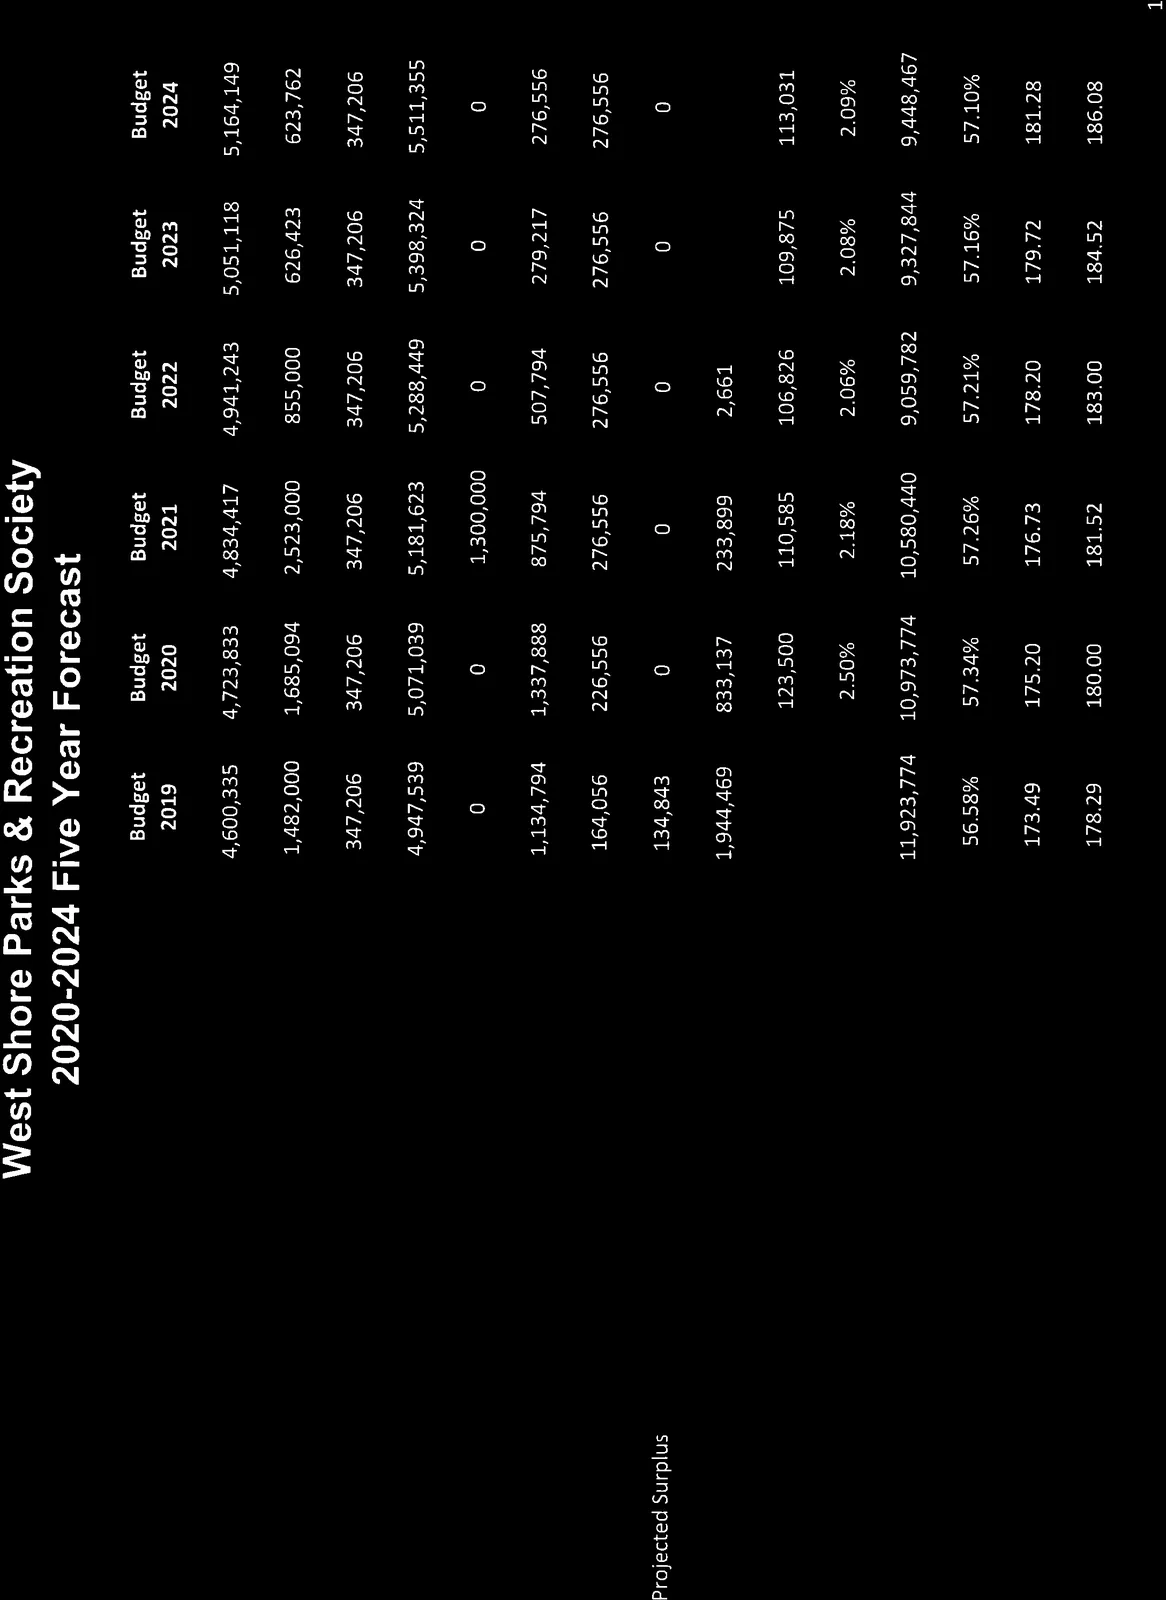
West Shore Parks & Recreation Society 2020-2024 Five Year Forecast
Table with columns by year: 2019 Budget, 2020 Budget, 2021 Budget, 2022 Budget, 2023 Budget, 2024 Budget and rows including Operating - Net Expense, Capital Projects, Operating Income - Maintain $347,206, Requisition, Grant Funds, Reserve Fund Transfers, Operating Surplus, Projected Surplus, Reserve Status Year End, Requisition Increase %, Unfunded 2.0 Year Capital, Operating User Pay Ratio, Operating Cost per Capita, Overall Cost per Capita. Includes figures such as:
- 2019 Budget Operating - Net Expense: 4,600,335
- 2020 Budget Operating - Net Expense: 4,723,383
- 2020 Requisition: 5,071,039
- 2020 Projected Reserve Fund Transfers: 1,337,888
- Other year-by-year totals and per capita figures (e.g., Overall Cost per Capita 2019: 178.29, 2020: 180.00, 2024: 186.08)
Table with columns by year: 2019 Budget, 2020 Budget, 2021 Budget, 2022 Budget, 2023 Budget, 2024 Budget and rows including Operating - Net Expense, Capital Projects, Operating Income - Maintain $347,206, Requisition, Grant Funds, Reserve Fund Transfers, Operating Surplus, Projected Surplus, Reserve Status Year End, Requisition Increase %, Unfunded 2.0 Year Capital, Operating User Pay Ratio, Operating Cost per Capita, Overall Cost per Capita. Includes figures such as: - 2019 Budget Operating - Net Expense: 4,600,335 - 2020 Budget Operating - Net Expense: 4,723,383 - 2020 Requisition: 5,071,039 - 2020 Projected Reserve Fund Transfers: 1,337,888 - Other year-by-year totals and per capita figures (e.g., Overall Cost per Capita 2019: 178.29, 2020: 180.00, 2024: 186.08)
  • Population and User Pay information included alongside expense and revenue forecasts, with User Pay % and per-capita amounts shown.
Page 34–54

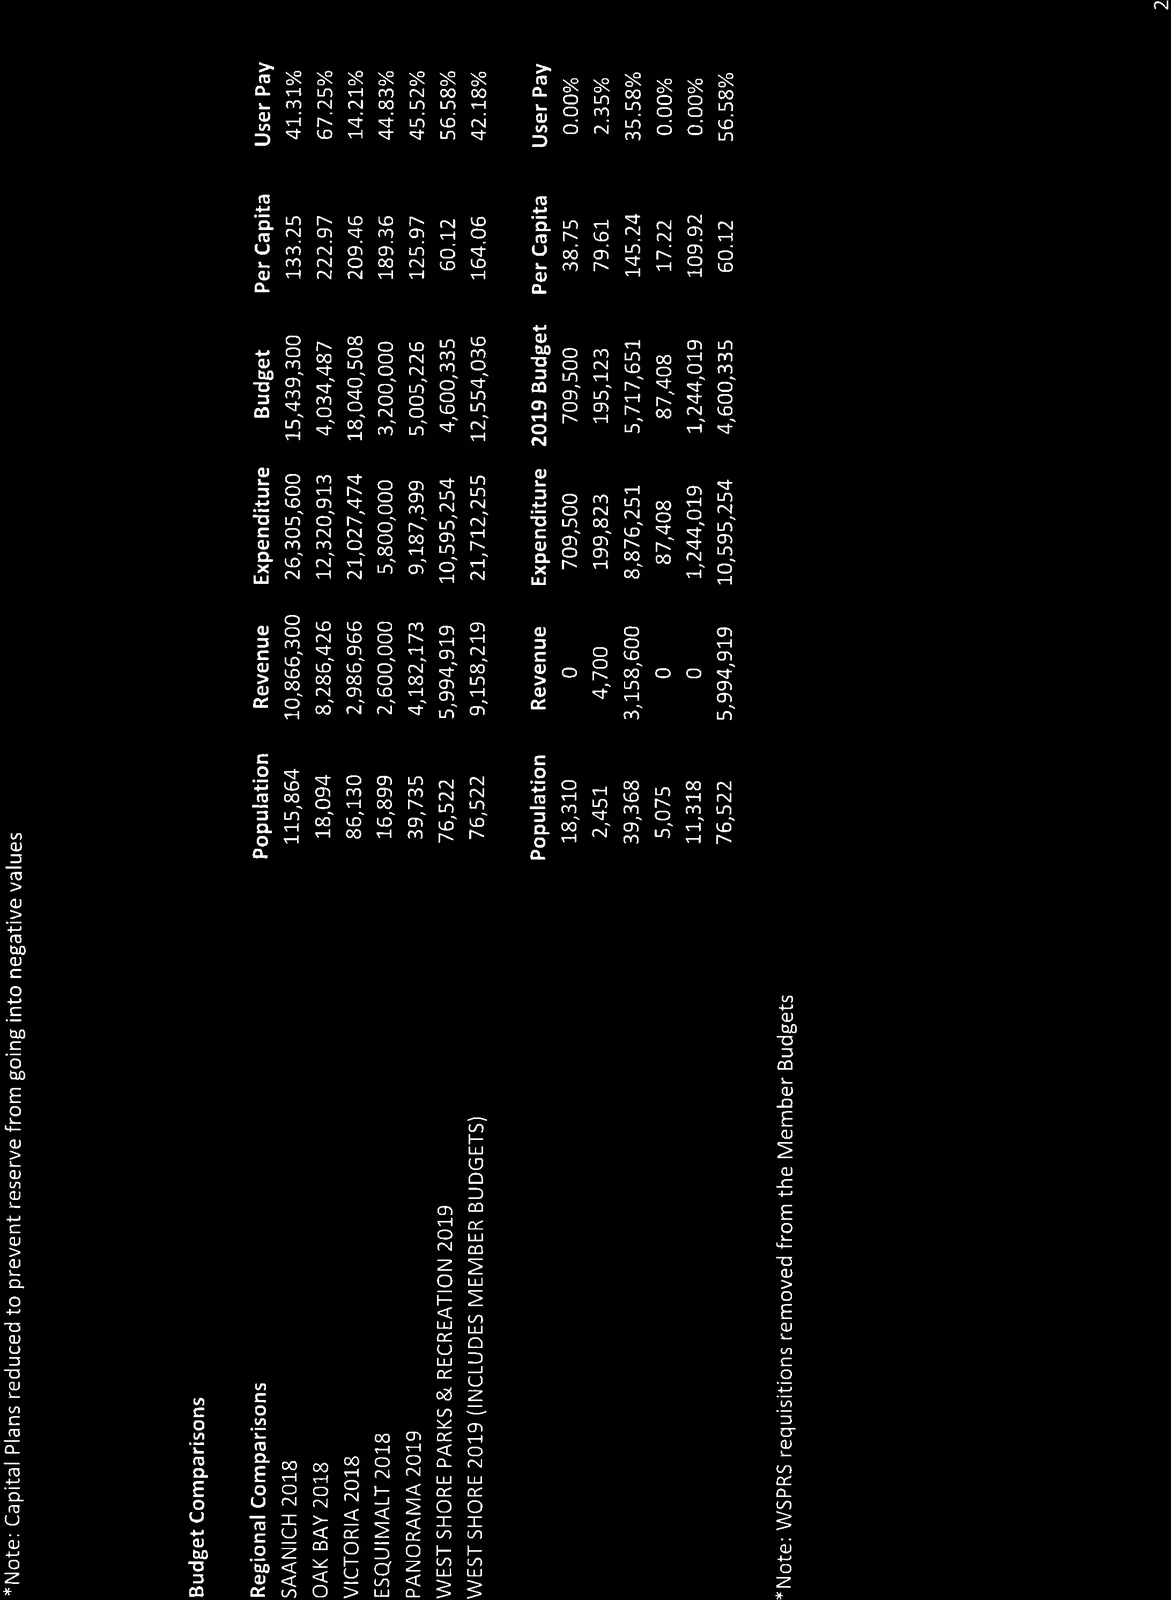
BUDGET COMPARISONS

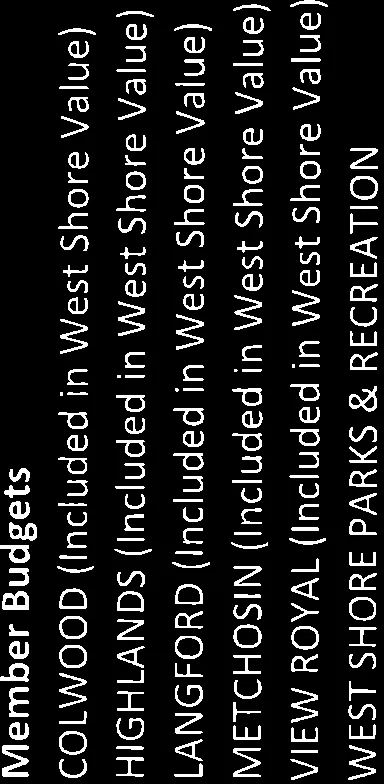
Page with budget comparisons: "Budget Comparisons" listing regional comparisons (Saanich 2018, Oak Bay 2018, Victoria 2018, Esquimalt 2018, Panorama 2018, West Shore 2019) and Member Budgets listing amounts included in West Shore budgets for HIGHLANDS, LANGFORD, METCHOSIN, VIEW ROYAL, and WEST SHORE PARKS & RECREATION. Includes totals and percentages.
Page 34–54

MEMBER BUDGETS

Page showing Member Budgets and notes such as "*Note: WSPRS requisitions removed from the Member Budgets"
  • Member budget allocations and how they are included in the West Shore totals are shown.

Notes:

  • Several pages contain detailed tabular financial data presented as rotated multi-column tables. Those pages include line-by-line departmental budgets, projections, variances, capital project detail, reserve fund transfers, and five-year forecast figures. These are represented above as image placeholders to indicate their presence and content focus.
  • All dollar amounts, dates, addresses, and line items referenced in the textual content above are preserved exactly as presented in the source pages.
  • Staff recommendation is included verbatim in the RECOMMENDATION section above.
Page 34–54

Document Images

(62)
Document image
Document image
Document image
Document image
Document image
Document image
Document image
Document image
Document image
Document image
Document image
Document image
Document image
Document image
Document image
Document image
Document image
Document image
Document image
Document image
Document image
Document image
Document image
Document image
Document image
Document image
Document image
Document image
Document image
Document image
Document image
Document image
Document image
Document image
Document image
Document image
Document image
Document image
Document image
Document image
Document image
Document image
Document image
Document image
Document image
Document image
Document image
Document image
Document image
Document image
Document image
Document image
Document image
Document image
Document image
Document image
Document image
Document image
Document image
Document image
Document image
Document image
Extracted from: 20200120-Agenda-Package(86 pages total)