DocumentsAppendixJul 20, 2026Pages 7–37
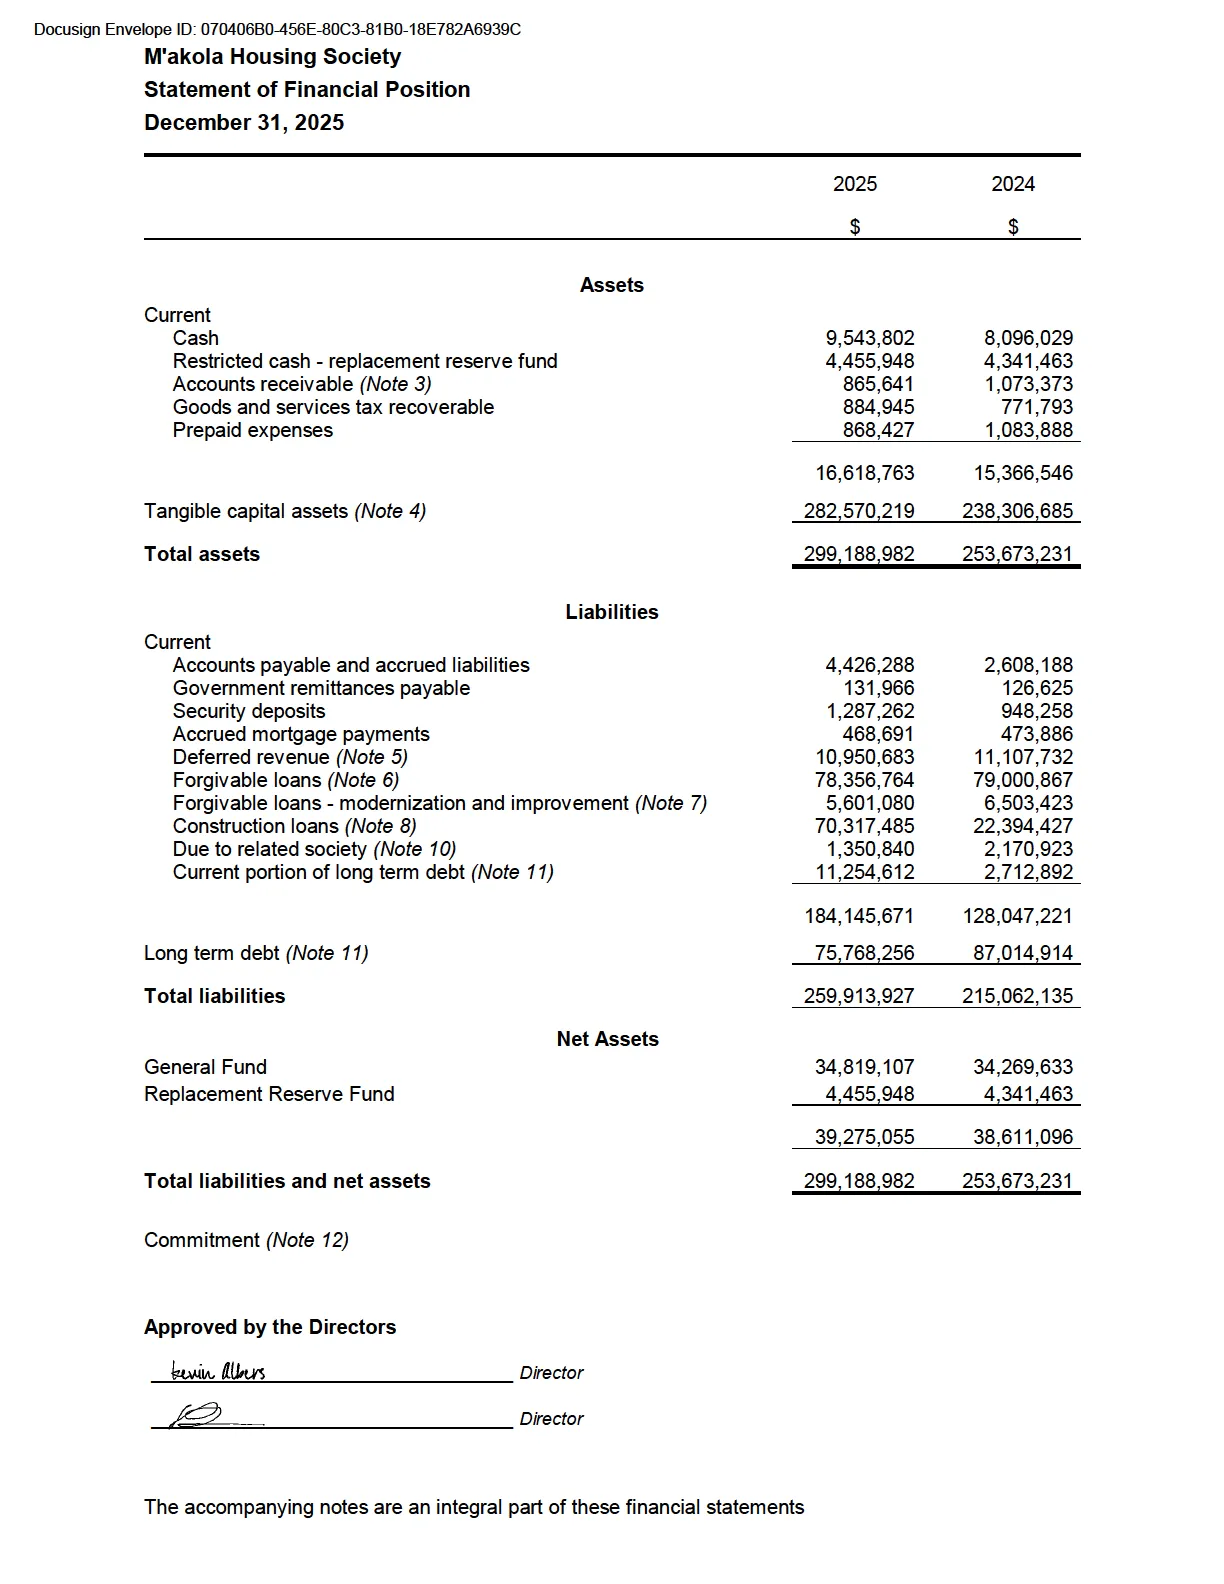
M'akola Housing Society Financial Statements Year Ended December 31, 2025
Audited financial statements for M’akola Housing Society for the year ended December 31, 2025, including notes and schedules detailing program revenues, expenditures, salary allocations, and replacement reserves.
Key facts
- Financial year ended December 31, 2025
- Auditor’s report dated April 15, 2026
- 2025 revenues and expenditures excess: $392,073
- Net assets at year end: $39,275,055
- Cash at year end: $13,999,750
M'akola Housing Society Financial Statements
Year Ended December 31, 2025
Independent Auditor's Report
To the Members of M'akola Housing Society
Report on the Financial Statements
Opinion
We have audited the financial statements of M'akola Housing Society (the "Society"), which comprise the statement of financial position as at December 31, 2025, and the statements of changes in net assets, revenues and expenditures and cash flows for the year then ended, and notes to the financial statements, including a summary of significant accounting policies and other explanatory information.
In our opinion, the accompanying financial statements present fairly, in all material respects, the financial position of the Society as at December 31, 2025, and the results of its operations and cash flows for the year then ended in accordance with the financial reporting provisions of the Agreement between the Society and the Aboriginal Housing Management Association (the "Agreement").
Basis for Opinion
We conducted our audit in accordance with Canadian generally accepted auditing standards. Our responsibilities under those standards are further described in the Auditor's Responsibilities for the Audit of the Financial Statements section of our report. We are independent of the Society in accordance with ethical requirements that are relevant to our audit of the financial statements in Canada, and we have fulfilled our other ethical responsibilities in accordance with these requirements. We believe that the audit evidence we have obtained is sufficient and appropriate to provide a basis for our opinion.
Emphasis of Matter
We draw attention to Note 2 of the financial statements, which describes the basis of accounting. The financial statements have been prepared to assist the Society to comply with the financial reporting provisions of the Agreement noted above. As a result, the financial statements may not be suitable for another purpose. Our opinion is not modified in respect of this matter. Our report is intended solely for the Directors of the Society, the Aboriginal Housing Management Association, and the British Columbia Housing Management Commission.
Responsibilities of Management and Those Charged with Governance for the Financial Statements
Management is responsible for the preparation and fair presentation of the financial statements in accordance with the financial reporting provisions of the Agreement, and for such internal control as management determines is necessary to enable the preparation of financial statements that are free from material misstatement, whether due to fraud or error.
In preparing the financial statements, management is responsible for assessing the Society's ability to continue as a going concern, disclosing, as applicable, matters related to going concern and using the going concern basis of accounting unless management either intends to liquidate the Society or to cease operations, or has no realistic alternative but to do so.
Those charged with governance are responsible for overseeing the Society's financial reporting process.
Independent Auditor's Report (continued)
Auditor's Responsibilities for the Audit of the Financial Statements
Our objectives are to obtain reasonable assurance about whether the financial statements as a whole are free from material misstatement, whether due to fraud or error, and to issue an auditor’s report that includes our opinion. Reasonable assurance is a high level of assurance, but is not a guarantee that an audit conducted in accordance with Canadian generally accepted auditing standards will always detect a material misstatement when it exists. Misstatements can arise from fraud or error and are considered material if, individually or in the aggregate, they could reasonably be expected to influence the economic decisions of users taken on the basis of these financial statements.
As part of an audit in accordance with Canadian generally accepted auditing standards, we exercise professional judgment and maintain professional skepticism throughout the audit. We also:
- Identify and assess the risks of material misstatement of the financial statements, whether due to fraud or error, design and perform audit procedures responsive to those risks, and obtain audit evidence that is sufficient and appropriate to provide a basis for our opinion. The risk of not detecting a material misstatement resulting from fraud is higher than for one resulting from error, as fraud may involve collusion, forgery, intentional omissions, misrepresentations, or the override of internal control.
- Obtain an understanding of internal control relevant to the audit in order to design audit procedures that are appropriate in the circumstances, but not for the purpose of expressing an opinion on the effectiveness of the Society’s internal control.
- Evaluate the appropriateness of accounting policies used and the reasonableness of accounting estimates and related disclosures made by management.
- Conclude on the appropriateness of management’s use of the going concern basis of accounting and, based on the audit evidence obtained, whether a material uncertainty exists related to events or conditions that may cast significant doubt on the Society’s ability to continue as a going concern. If we conclude that a material uncertainty exists, we are required to draw attention in our auditor’s report to the related disclosures in the financial statements or, if such disclosures are inadequate, to modify our opinion. Our conclusions are based on the audit evidence obtained up to the date of our auditor’s report. However, future events or conditions may cause the Society to cease to continue as a going concern.
- Evaluate the overall presentation, structure and content of the financial statements, including the disclosures, and whether the financial statements represent the underlying transactions and events in a manner that achieves fair presentation.
We communicate with those charged with governance regarding, among other matters, the planned scope and timing of the audit and significant audit findings, including any significant deficiencies in internal control that we identify during our audit.
Report on Other Legal and Regulatory Requirements
Our audit was made for the purpose of forming an opinion of the financial statements taken as a whole. The supplementary information included in Schedules 1 through 4 is presented for the purpose of additional analysis and is not a required part of the financial statements. Such information has been subjected to the auditing procedures applied in the audit of the financial statements and, in our opinion, is fairly stated in all material aspects in relation to the financial statements taken as a whole.
As required by the Societies Act of British Columbia, we report that, in our opinion, the accounting policies applied in preparing and presenting the financial statements in accordance with the financial reporting provisions of the Agreement have been applied on a basis consistent with that of the preceding year.
Victoria, British Columbia
April 15, 2026
Chartered Professional Accountants
Statement of Changes in Net Assets
Year Ended December 31, 2025
| General Fund ($) | Replacement Reserve Fund ($) | 2025 ($) | 2024 ($) | |
|---|---|---|---|---|
| Net assets - beginning of year | 34,269,633 | 4,341,463 | 38,611,096 | 37,784,739 |
| Excess (deficiency) of revenues over expenditures | 262,646 | 129,427 | 392,073 | (2,157,669) |
| Replacement reserve provision | - | 1,234,684 | 1,234,684 | 983,406 |
| Replacement reserve expenses | - | (1,249,626) | (1,249,626) | (483,097) |
| AHMA reimbursement (Note 19) | 286,828 | - | 286,828 | 2,483,717 |
| Net assets - end of year | 34,819,107 | 4,455,948 | 39,275,055 | 38,611,096 |
The accompanying notes are an integral part of these financial statements.
Statement of Revenues and Expenditures
Year Ended December 31, 2025
| General Fund ($) | Replacement Reserve Fund ($) | 2025 ($) | 2024 ($) | |
|---|---|---|---|---|
| Revenues | ||||
| Rental income | 19,847,320 | - | 19,847,320 | 15,450,707 |
| AHMA subsidies | 7,916,273 | - | 7,916,273 | 8,580,393 |
| Island Health subsidies | 1,414,391 | - | 1,414,391 | 1,304,225 |
| Other revenue | 1,406,520 | - | 1,406,520 | 1,476,005 |
| Commercial rental income | 615,567 | - | 615,567 | - |
| Other COVID funding | 584,217 | - | 584,217 | 436,466 |
| Strata revenue | 376,686 | - | 376,686 | - |
| Donations and grants | 337,700 | - | 337,700 | 331,000 |
| Loan forgiveness (Note 6) | 16,852 | - | 16,852 | (185,373) |
| Total revenues | 32,515,526 | - | 32,515,526 | 27,393,423 |
| Expenditures | ||||
| Salaries and wages | 7,155,441 | - | 7,155,441 | 6,549,150 |
| Mortgage payments | 5,701,304 | - | 5,701,304 | 5,059,944 |
| Repairs and maintenance | 5,051,709 | - | 5,051,709 | 5,001,464 |
| Management fees | 2,718,282 | - | 2,718,282 | 6,035,123 |
| Insurance | 2,107,404 | - | 2,107,404 | 2,417,845 |
| Utilities | 2,035,103 | - | 2,035,103 | 1,903,031 |
| Property taxes | 1,978,948 | - | 1,978,948 | 1,741,687 |
| Office and general administration | 1,837,737 | - | 1,837,737 | 1,867,123 |
| Lease (Note 12) | 1,364,255 | - | 1,364,255 | - |
| Garbage | 1,237,429 | - | 1,237,429 | 1,250,946 |
| Replacement reserve | 1,234,684 | - | 1,234,684 | 983,406 |
| Landscaping | 544,896 | - | 544,896 | 518,982 |
| Hospitality and food | 544,342 | - | 544,342 | 560,099 |
| Strata expenses | 376,686 | - | 376,686 | - |
| Snow removal | 352,683 | - | 352,683 | 320,104 |
| Information technology | 425,237 | - | 425,237 | 279,725 |
| Amortization | 334,636 | - | 334,636 | 344,227 |
| Extraordinary repairs | 258,947 | - | 258,947 | 2,116 |
| Security | 134,266 | - | 134,266 | 134,169 |
| Audit fees | 85,505 | - | 85,505 | 80,110 |
| Laundry | 59,733 | - | 59,733 | 36,346 |
| Supplies | 23,909 | - | 23,909 | 18,358 |
| Memberships and dues | 395 | - | 395 | 340 |
| Total expenditures | 35,563,531 | - | 35,563,531 | 35,104,295 |
| Deficiency of revenues over expenditures before modernization and improvement and other income | (3,048,005) | - | (3,048,005) | (7,710,872) |
| Modernization and improvement (Note 7) | ||||
| Modernization and improvement funding | 2,088,725 | - | 2,088,725 | 3,979,170 |
| Modernization and improvement expenses | (1,317,893) | - | (1,317,893) | (2,665,356) |
| Net modernization and improvement | 770,832 | - | 770,832 | 1,313,814 |
| Deficiency of revenues over expenditures from operations | (2,277,173) | - | (2,277,173) | (6,397,058) |
| Other income | ||||
| Gains on disposal of tangible capital assets | 1,908,967 | - | 1,908,967 | 3,783,429 |
| Unrealized loss on marketable securities (Note 14) | - | - | - | (1,082) |
| Interest income (Note 14) | 344,451 | 129,427 | 473,878 | 457,042 |
| Excess amortization | 286,401 | - | 286,401 | - |
| Total other income | 2,539,819 | 129,427 | 2,669,246 | 4,239,389 |
| Excess (deficiency) of revenues over expenditures | 262,646 | 129,427 | 392,073 | (2,157,669) |
The accompanying notes are an integral part of these financial statements.
Statement of Cash Flows
Year Ended December 31, 2025
| 2025 ($) | 2024 ($) | |
|---|---|---|
| Operating activities | ||
| Excess (deficiency) of revenues over expenditures | 392,073 | (2,157,669) |
| Items not affecting cash: | ||
| Amortization of tangible capital assets | 3,380,264 | 3,768,074 |
| Gain on disposal of tangible capital assets | (1,908,967) | (3,783,429) |
| Unrealized loss on marketable securities | - | 1,082 |
| Replacement reserve | 1,234,684 | 983,406 |
| Loan forgiveness | (919,195) | (716,969) |
| Excess amortization | (286,401) | - |
| 1,892,458 | (1,905,505) | |
| Changes in non-cash working capital: | ||
| Accounts receivable | 207,731 | (949,586) |
| Goods and services tax recoverable | (113,152) | (296,553) |
| Prepaid expenses | 215,461 | 108,845 |
| Accounts payable and accrued liabilities | 1,818,102 | 313,641 |
| Government remittances payable | 5,341 | 28,004 |
| Deferred revenue | (157,049) | 7,819,673 |
| Refundable deposits | - | 8,992 |
| Security deposits | 339,004 | 167,535 |
| 2,315,438 | 7,200,551 | |
| Cash flow from operating activities | 4,207,896 | 5,295,046 |
| Investing activities | ||
| Purchase of tangible capital assets | (48,809,167) | (27,460,168) |
| Proceeds on disposal of tangible capital assets | 3,020,313 | 6,704,149 |
| Proceeds from sale of marketable securities | - | 1,162,244 |
| Replacement reserve purchases | (1,249,626) | (483,097) |
| Cash flow used by investing activities | (47,038,480) | (20,076,872) |
| Financing activities | ||
| Advances (to) from related parties | (820,083) | 1,806,183 |
| Advances (transfers) on construction loans | 47,923,058 | (48,568,721) |
| Advances on forgivable loans | - | 23,635,766 |
| Issuance (repayment) of long term debt | (2,704,938) | 42,613,317 |
| Accrued mortgage payments | (5,195) | 258,319 |
| Cash flow from financing activities | 44,392,842 | 19,744,864 |
| Increase in cash flow | 1,562,258 | 4,963,038 |
| Cash - beginning of year | 12,437,492 | 7,474,454 |
| Cash - end of year | 13,999,750 | 12,437,492 |
| Cash consists of: | ||
| Cash | 9,543,802 | 8,096,029 |
| Restricted cash - replacement reserve fund | 4,455,948 | 4,341,463 |
| Total cash | 13,999,750 | 12,437,492 |
The accompanying notes are an integral part of these financial statements.
Notes to Financial Statements
Year Ended December 31, 2025
1. Purpose of the organization
M'akola Housing Society (the "Society") is incorporated provincially under the Societies Act of British Columbia. The Society is a registered charity and is exempt from the payment of income taxes under the Income Tax Act. The Society was established to provide safe, affordable housing for families of First Nations ancestry who were in need of housing in urban centres in British Columbia.
2. Significant accounting policies
Basis of accounting
The financial statements were prepared in accordance with the financial reporting provisions required by the Aboriginal Housing Management Association ("AHMA") and comply with the Society's mortgage agreements with British Columbia Housing Management Commission ("BCHMC"). The basis of accounting used in these financial statements differs materially from Canadian accounting standards for not-for-profit organizations (ASNPO) because of the following policy choices:
i) Amortization is not provided on buildings over their estimated useful lives, but rather at a rate equal to the annual principal reduction of the related mortgages and forgivable loans on the land and building. This policy results in the amortization of land. When the debt balance exceeds the net book value of the land and building the excess is recorded as excess amortization on the statement of operations.
ii) Capital assets purchased by the Replacement Reserve Fund are charged against the replacement reserve fund expense account rather than being capitalized on the statement of financial position and amortized over their estimated useful lives.
iii) Building renovation costs and tangible capital assets are charged to repairs and maintenance in the year the expenditure is incurred rather than being capitalized and amortized over their estimated useful lives.
iv) A reserve for future capital replacement is appropriated annually from the general fund as a replacement reserve provision.
v) Repayment (reimbursement) of past operating surpluses (deficits) to (from) AHMA is recorded as a charge to net assets in the year paid (received).
vi) Funding grants received in relation to housing development projects are deferred and recorded against the cost of land and building of the related project in the year of completion.
vii) AHMA funding provided for specific modernization and improvement projects ("M&I") is recognized as revenue in the year in which the M&I costs are formally approved. In compliance with the agreement, AHMA provided M&I costs are expensed in repairs and maintenance in the current period. Tangible capital assets purchased under the M&I program are charged on the statement of operations rather than being capitalized on the statement of financial position and amortized over their estimated useful lives.
Fund accounting
The Society follows the restricted fund method of accounting for contributions with the exception of the modernization and improvement funding.
The General Fund accounts for the Society's program delivery and administrative activities. This fund reports unrestricted resources and restricted operating grants, such as modernization and improvement funding.
The Replacement Reserve Fund was established in accordance with the Society's agreement with the Canada Mortgage and Housing Corporation ("CMHC"). The annual provision allocated from the General Fund and the use of these externally restricted funds are subject to the approval or direction of AHMA. Under the terms of the agreement, a provision is added annually to the fund from operations and qualifying expenditures charged against it.
Tangible capital assets
Tangible capital assets are stated at cost or deemed cost less accumulated amortization and are amortized over their estimated useful lives at the following rates and methods:
| Rate and method | |
|---|---|
| Buildings under BCHMC contract | principal reduction of related mortgages and forgivable loans |
| Buildings not under BCHMC contract | 2% declining balance method |
| Equipment | 3 - 10 years straight-line method |
| Septic systems | 15 years straight-line method |
Projects under construction are not amortized until the asset is put into use.
Financial instruments policy
The Society initially measures its financial assets and financial liabilities at fair value. The Society subsequently measures all its financial assets and financial liabilities at amortized cost.
Financial assets measured at amortized cost include cash, accounts receivable and refundable deposits. Financial liabilities measured at amortized cost include accounts payable and accrued liabilities, construction loans and long-term debt. Transaction costs related to financial instruments measured at amortized cost are capitalized and amortized.
Projects under construction
Capitalized costs include development costs, realtor commissions and administrative and general expenses directly related to the acquisition, development and construction of properties.
Projects under construction are not amortized until the asset is available for use.
Pension plan
Defined contribution plan accounting is applied to multi-employer defined benefit plans, and accordingly, contributions are expensed when due and payable.
Forgivable loans
Forgivable loans are recognized in income when the terms for forgiveness are met in accordance with the loan agreements.
2. Significant accounting policies (continued)
Revenue recognition
The Society follows the restricted fund method of accounting for contributions and donations.
Unrestricted contributions are recognized as revenue in the General Fund in the year received or receivable if the amount to be received can be reasonably estimated and collection is reasonably assured.
Restricted contributions are recognized in the related restricted fund in the year. When there is no corresponding restricted fund, revenue is recognized in the General Fund.
Rental revenue is recorded as revenue in the General Fund in the year the income is received or receivable if the amount to be received can be reasonably estimated and collection is reasonably assured.
Service revenue included in other revenue is recorded as revenue in the General Fund in the year the income is received or receivable if the amount to be received can be reasonably estimated and collection is reasonably assured.
Investment income is recorded as revenue when earned. The interest in the Replacement Reserve Fund is not considered operation income. Restricted Fund interest is allocated on a pro-rata basis based on the outstanding cash balances.
Measurement uncertainty
The preparation of financial statements requires management to make estimates and assumptions that affect the reported amount of assets and liabilities, disclosure of contingent assets and liabilities at the date of the financial statements and the reported amounts of revenues and expenses during the period. Such estimates are periodically reviewed and any adjustments necessary are reported in earnings in the period in which they become known. Actual results could differ from these estimates.
Allocation of expenditures
Salary and wages, office and general administration and audit fee expenses that contribute to more than one project are allocated proportionately based on the individual program's percentage of the aggregate budgets assigned by AHMA for all programs. Amounts for non-AHMA programs are allocated based on the proportionate share of gross rental income and subsidy among those projects. Allocated amounts are presented on Schedule 2.
Presentation of controlled society
The Society has chosen not to consolidate with M'akola Development Services Society, a society under the control of a common board of directors and executive management. Instead, the Society discloses information about the resources of this controlled organization in Note 20.
3. Accounts receivable
| 2025 ($) | 2024 ($) | |
|---|---|---|
| Subsidies | 395,814 | 173,274 |
| Services rendered | 132,426 | 229,755 |
| Proceeds for property sale | 334,846 | 667,607 |
| Other | 2,555 | 2,737 |
| Total | 865,641 | 1,073,373 |
4. Tangible capital assets
| 2025 Cost ($) | 2025 Accumulated amortization ($) | 2024 Cost ($) | 2024 Accumulated amortization ($) | |
|---|---|---|---|---|
| Land | 78,791,769 | 5,260,461 | 79,382,445 | 4,444,542 |
| Buildings | 163,693,962 | 36,617,607 | 165,111,986 | 34,882,102 |
| Equipment | 701,635 | 701,635 | 701,635 | 701,635 |
| Septic systems | 193,647 | 118,312 | 193,647 | 105,077 |
| Projects under construction | 81,887,221 | - | 33,050,328 | - |
| Total | 325,268,234 | 42,698,015 | 278,440,041 | 40,133,356 |
| Net book value | 282,570,219 | 238,306,685 |
Included in mortgage payments expenditures is $2,706,094 (2024 - $2,594,371) of amortization.
During the year, the Society recorded $nil (2024 - $1,585,000) of grants against the cost of land and buildings for completed projects.
During the year, the Society sold properties for net proceeds of $3,020,313 (2024 - $6,704,149) which had a net book value of $1,110,645 (2024 - $2,919,511).
5. Deferred revenue
| Balance, beginning of year ($) | Additions ($) | Recognized as revenue ($) | Balance, end of year ($) | |
|---|---|---|---|---|
| Prepaid rent | 387,581 | 442,220 | (387,581) | 442,220 |
| AHMA deferred subsidy | 568,152 | 355,987 | (346,614) | 577,525 |
| Island Health deferred subsidy | 506,679 | 280,156 | (584,217) | 202,618 |
| M'akola Development Services | 9,640,000 | 200,000 | (117,000) | 9,723,000 |
| Other deferred revenue | 5,320 | - | - | 5,320 |
| Total | 11,107,732 | 1,278,363 | (1,435,412) | 10,950,683 |
Included in deferred revenue under M'akola Development Services is $8,250,000 of contributions provided for the acquisition of the properties at 3075 Douglas St. and 4th Ave. Port Alberni. These amounts will be recognized as revenue upon completion of the related development projects.
6. Forgivable loans
| 2025 ($) | 2024 ($) | |
|---|---|---|
| 550 Goldstream | 4,863,645 | 4,863,645 |
| Aspen | 437,211 | 437,211 |
| Braidwood | 4,624,762 | 4,624,762 |
| Charters | 6,570,668 | 6,814,668 |
| Drennan | 18,898,500 | 19,281,750 |
| Oak Grove | 67,408 | 84,261 |
| Oliver Airport | 4,880,140 | 4,880,140 |
| Station Phase 2 | 8,000,000 | 8,000,000 |
| Terrace Lazelle | 10,271,615 | 10,271,615 |
| Travelodge | 6,251,687 | 6,251,687 |
| Ts'i'ts'uwatul' Lelum | 13,491,128 | 13,491,128 |
| Total | 78,356,764 | 79,000,867 |
The forgivable loans are due to BCHMC and payment of principal and interest will not be required unless the project ceases to be used for the intended purposes. It is management's opinion that as at December 31, 2025, all terms of the contracts relating to usage have been met and the projects are being used for their intended purpose. The forgivable loans are secured by capital assets with a net carrying amount of $153,976,242 (2024 - $155,521,558).
The term of the 550 Goldstream loan is 35 years, maturing March 1, 2050. It will be forgiven by an amount equal to one divided by the number of years remaining in the term on March 1, 2025. As security, the Society grants, charges and mortgages by way of assignment of rents to BCHMC, their right, title and interest to the land located at 550 Goldstream Avenue.
The term of Aspen loan is 35 years, maturing March 1, 2057. It will be forgiven by an amount equal to one divided by the number of years remaining in the term on March 1, 2033. As security, the Society grants, charges and mortgages by way of assignment of rents to BCHMC, their right, title and interest to the land located at 695 Aspen Road & 2200 Murrelet Drive.
The term of Braidwood loan is 35 years, maturing April 1, 2053. It will be forgiven by an amount equal to one divided by the number of years remaining in the term on April 1, 2028. As security, the Society grants, charges and mortgages by way of assignment of rents to BCHMC, their right, title and interest to the land located at 810 Braidwood Road.
The term of the Charters loan is 35 years, maturing October 1, 2048. It will be forgiven by an amount equal to one divided by the number of years remaining in the term on October 1, 2024. As security, the Society grants, charges and mortgages by way of assignment of rents to BCHMC, their right, title and interest to the land located at 2170 Charters Road.
The term of the Drennan loan is 35 years, maturing May 2056. It will be forgiven by an amount equal to one divided by the number of years remaining in the term on May 1, 2032. As security, the Society grants, charges and mortgages by way of assignment of rents to BCHMC, their right, title and interest to the land located at 2075 Drennan Street.
The Oak Grove project is being forgiven annually on April 1 at a rate of $16,852 per annum. The annual debt forgiveness is included in revenue as loan forgiveness.
The term of the Oliver Airport loan is 35 years, maturing February 1, 2056. It will be forgiven by an amount equal to one divided by the number of years remaining in the term on February 1, 2032. As security, the Society grants, charges and mortgages by way of assignment of rents to BCHMC, their right, title and interest to the land located at 5931 Airport Street.
The term of the Station Phase 2 loan is 35 years, maturing February 1, 2055. It will be forgiven by an amount equal to one divided by the number of years remaining in the term on February 1, 2031. As security, the Society grants, charges and mortgages by way of assignment of rents to BCHMC, their right, title and interest to the land located at 729 Station Avenue.
The term of the Terrace Lazelle loan is 35 years, maturing September 1, 2056. It will be forgiven by an amount equal to one divided by the number of years remaining in the term on September 1, 2032. As security, the Society grants, charges and mortgages by way of assignment of rents to BCHMC, their right, title and interest to the land located at 4819 Lazelle Avenue.
The term of the Travelodge loan is 35 years, maturing April 1, 2052. It will be forgiven by an amount equal to one divided by the number of years remaining in the term on April 1, 2027. As security, the Society grants, charges and mortgages by way of assignment of rents to BCHMC, their right, title and interest to the land located at 340 Island Highway South.
The term of the Ts'i'ts'uwatul' Lelum loan is 35 years, maturing February 1, 2048. It will be forgiven by an amount equal to one divided by the number of years remaining in the term on February 1, 2023. As security, the Society grants, charges and mortgages by way of assignment of rents to BC Housing, their right, title and interest to the land located at Cowichan Indian Reserve No. 1, Lot 632-1.
7. Modernization and improvement
The modernization and improvement of properties by the Society is funded through grants and forgivable loans. The Society recognizes these as revenue in accordance with the policies described in Note 2. This results in a timing difference between revenues and expenditures annually.
The following forgivable loans were provided to fund modernization and improvement and will be included in income in the future when the conditions are met to recognize the loans as revenue. This has resulted in differences between the recognition of revenue and the time at which the related expenditures were incurred.
| 2025 ($) | 2024 ($) | |
|---|---|---|
| Gibbins | 1,417,472 | 1,653,718 |
| Muks | 149,954 | 199,942 |
| Quadra | 388,000 | 465,600 |
| Simcoe | 743,454 | 867,363 |
| Terrace Tetrault | 2,902,200 | 3,316,800 |
| Total | 5,601,080 | 6,503,423 |
The forgivable loans are due to BCHMC and payment of principal and interest will not be required unless the project ceases to be used for the intended purposes. It is management's opinion that as at December 31, 2025, all terms of the contracts relating to usage have been met and the projects are being used for their intended purpose.
The term of the Gibbins loan is 10 years, maturing February 1, 2030. It is being forgiven annually on February 1 at a rate of $236,245 per annum, equal to one tenth of the initial principal balance. As security, the Society grants, charges and mortgages by way of assignment of rents to BCHMC, their right, title and interest to the land located at 3160-3170 Gibbins Road.
7. Modernization and improvement (continued)
The term of the Muks loan is 10 years, maturing October 1, 2027. It is being forgiven annually on October 1 at a rate of $49,988 per annum, equal to one tenth of the initial principal balance. As security, the Society grants, charges and mortgages by way of assignment of rents to BCHMC, their right, title and interest to the land located at 1139 Park Avenue.
The term of the Quadra loan is 10 years, maturing September 1, 2030. It is being forgiven annually on September 1 at a rate of $77,600 per annum, equal to one tenth of the initial principal balance. As security, the Society grants, charges and mortgages by way of assignment of rents to BCHMC, their right, title and interest to the land located at 3360 Quadra Street.
The term of the Simcoe loan is 10 years, maturing February 1, 2030. It is being forgiven annually on February 1 at a rate of $123,909 per annum, equal to one tenth of the initial principal balance. As security, the Society grants, charges and mortgages by way of assignment of rents to BCHMC, their right, title and interest to the land located at 37 Simcoe Street.
The term of the Terrace Tetrault loan is 10 years, maturing November 1, 2032. It is being forgiven annually on February 1 at a rate of $414,600 per annum, equal to one tenth of the initial principal balance. As security, the Society grants, charges and mortgages by way of assignment of rents to BCHMC, their right, title and interest to the land located at 2602 Tetrault Street.
8. Construction loans
| 2025 ($) | 2024 ($) | |
|---|---|---|
| Alston | 903,906 | 202,598 |
| Beulah | 9,946,470 | 2,589,156 |
| Bertram Tower | 1,044,114 | - |
| Byrnepark | 43,137,087 | 17,522,362 |
| Carlow | 498,547 | 46,005 |
| Comox Aspen | 61,424 | 61,424 |
| Cumberland | 153,425 | - |
| Douglas | 88,223 | - |
| Lougheed | 83,474 | - |
| Pender | 57,584 | - |
| Penticton | 12,349,372 | 1,440,270 |
| Port Alberni | 1,329,454 | 337,491 |
| Port Moody | 268,456 | 137,120 |
| Seal Cove | 395,949 | 58,001 |
| Total | 70,317,485 | 22,394,427 |
The Society receives construction financing from BCHMC for the development of new housing projects. Interest on construction financing is charged to the project as development costs when incurred. The financing is secured by tangible capital assets with a net carrying amount of $81,711,869 (2024 - $25,925,165).
The Alston project is authorized to a maximum of $2,729,993.
The Beulah project is authorized to a maximum of $16,562,109.
The Bertram Tower project is authorized to a maximum of $4,037,729.
The Byrnepark project is authorized to a maximum of $54,591,501.
The Carlow project is authorized to a maximum of $500,000.
8. Construction loans (continued)
The Comox Aspen project is authorized to a maximum of $410,697.
The Cumberland project is authorized to a maximum of $238,095.
The Douglas project is authorized to a maximum of $99,999.
The Lougheed project is authorized to a maximum of $1,110,500.
The Pender project is authorized to a maximum of $238,000.
The Penticton project is authorized to a maximum of $13,217,221.
The Port Alberni project is authorized to a maximum of $1,958,543.
The Port Moody project is authorized to a maximum of $155,654,036.
The Seal Cove project is authorized to a maximum of $500,000.
9. Related party transactions
The following is a summary of the Society's related party transactions:
| 2025 ($) | 2024 ($) | |
|---|---|---|
| Management fees paid - M'akola Rural and Native and Muks Housing sales | 2,718,282 | 6,035,123 |
| Projects under construction | 1,782,102 | 589,744 |
| Office and general administration | 263,354 | 234,188 |
| Other revenue - M'akola Rural and Native Housing capital improvements | 200,000 | 350,000 |
| Contributions for Indigenous housing projects | - | 8,840,000 |
These transactions are in the normal course of operations and are measured at the exchange amount, which is the amount of consideration established and agreed to by the related parties.
10. Due to related society
| 2025 ($) | 2024 ($) | |
|---|---|---|
| M'akola Development Services Society | 1,350,840 | 2,170,923 |
M'akola Development Services Society is related through a common board of directors and executive management. Amounts are non-interest bearing and have no set terms of repayment.
11. Long term debt
| Lender and debt | 2025 ($) | 2024 ($) |
|---|---|---|
| BCHMC | ||
| ADMIRALS, interest at 0.68%, matures June 1, 2030 | 430,884 | 523,902 |
| ARGYLE, interest at 1.40%, matured August 1, 2025 | - | 49,259 |
| BRUCE, interest at 1.01%, matures June 1, 2028 | 199,398 | 274,879 |
| CHESTERFIELD, interest at 1.01%, matures May 1, 2027 | 137,872 | 234,014 |
| MUKS-KUM-OL PHASE 10, interest at 2.52%, matures August 1, 2028 | 101,829 | 136,693 |
| NEILL, interest at 1.13%, matures January 1, 2026 | 2,058 | 39,722 |
| OAK GROVE, interest at 2.60%, matures June 1, 2028 | 283,077 | 375,700 |
| SHENTON, interest at 1.40%, matured November 1, 2025 | - | 84,548 |
| SHORT, interest at 1.01%, matures January 1, 2027 | 101,018 | 196,468 |
| SHORT II, interest at 1.01%, matures January 1, 2027 | 67,179 | 130,655 |
| WELLINGTON, interest at 0.69%, matured February 1, 2025 | - | 12,403 |
| WHITE ROAD, interest at 0.69%, matured March 1, 2025 | - | 19,241 |
| WINCHESTER, interest at 1.01%, matures October 1, 2027 | 113,264 | 175,666 |
| Peoples Trust Company | ||
| BRAIDWOOD, interest at 2.77%, matures June 1, 2029 | 809,530 | 827,265 |
| JESKEN AERIE, interest at 2.51%, matures March 1, 2026 | 3,848,801 | 4,047,295 |
| Scotiabank | ||
| CHARTERS, interest at 4.10%, matures January 1, 2034 | 10,636,080 | 10,785,593 |
| DRENNAN, interest at 3.96%, matures September 1, 2034 | 26,059,685 | 26,422,952 |
| LAKETRAIL, interest at 3.92%, matures August 1, 2032 | 1,082,963 | 1,222,565 |
| TERRACE LAZELLE, interest at 4.10%, matures January 1, 2034 | 7,578,255 | 7,684,783 |
| OAK GROVE, interest at 2.19%, matures March 1, 2035 | 84,330 | - |
| MCAP | ||
| 550 GOLDSTREAM, interest at 2.20%, matures October 1, 2026 | 5,055,191 | 5,199,174 |
| OAK GROVE, interest at 2.19%, matured March 1, 2025 | - | 101,226 |
| QUADRA, interest at 1.81%, matures March 1, 2031 | 1,405,990 | 1,562,651 |
| STATION 2, interest at 2.03%, matures September 1, 2031 | 9,492,776 | 9,758,091 |
| STATION 2 PHASE 2, interest at 2.68%, matures February 1, 2032 | 8,318,126 | 8,487,204 |
| Coast Capital Savings Credit Union | ||
| COMOX ASPEN, interest at 2.70%, matures April 1, 2032 | 337,452 | 344,013 |
| OLIVER AIRPORT, interest at 4.04%, matures November 1, 2032 | 10,877,110 | 11,031,844 |
| Total long term debt | 87,022,868 | 89,727,806 |
| Amounts payable within one year | (11,254,612) | (2,712,892) |
| 75,768,256 | 87,014,914 |
Principal repayment terms are approximately:
| $ | |
|---|---|
| 2026 | 11,254,612 |
| 2027 | 2,063,754 |
| 2028 | 1,926,413 |
| 2029 | 1,804,783 |
| 2030 | 1,790,105 |
| Thereafter | 68,183,201 |
| Total | 87,022,868 |
The above mortgages are secured by tangible capital assets with a net carrying amount of $153,703,721 (2024 - $148,859,450).
12. Commitment
The Society has entered into a long term sub-lease for a 220 unit residential property located at 3338 Sawmill Crescent, Vancouver, BC, for the purpose of managing the rental operations of the property. The sub-lease expires on June 17, 2120, and the lease payments are based on the Society's monthly operating surpluses from managing the property. As such, the amount of future lease payments is not determinable.
13. Pension plans
The Society and certain employees contribute to the Municipal Pension Plan (the "Plan"). The board of trustees, representing plan members and employers, is responsible for administering the Plan, including investment of assets and administration of benefits. The Plan has a multi-employer contributory pension plan. Basic pension benefits provided are defined. The Plan has approximately 263,000 active members and approximately 133,000 retired members.
Every three years, an actuarial valuation is performed to assess the financial position of the Plan and adequacy of plan funding. The actuary determines an appropriate combined employer and member contribution rate to fund the Plan. The actuary's calculated contribution rate is based on the entry-age normal cost method, which produces the long-term rate of member and employer contributions sufficient to provide benefits for average future entrants to the Plan. This rate is then adjusted to the extent that there is amortization of any funding deficit.
The most recent actuarial valuation for the Plan as at December 31, 2024 indicated a $2.68 billion funding surplus for basic pension benefits on a going concern basis. Although this pension plan is a defined benefit plan, the entity specific values cannot be determined. As a result, the Plan is accounted for as a defined contribution plan.
Effective January 1, 2017, certain employees chose not to participate in the Plan and to instead participate in a defined contribution plan administered by Industrial Alliance. Employee contributions correspond to a percentage of salary earned to a maximum of 5% and are matched by the Society up to this maximum.
The Society paid $433,934 (2024 - $378,784) to the Municipal Pension Plan and $3,879 (2024 - $3,789) to the Industrial Alliance plan for employer contributions in 2025.
14. Investment income
| 2025 ($) | 2024 ($) | |
|---|---|---|
| Interest income | 473,878 | 457,042 |
| Unrealized loss on marketable securities | - | (1,082) |
| Total | 473,878 | 455,960 |
The unrealized loss on marketable securities results from mutual funds which are composed of securities quoted in active markets.
15. Remuneration of employees
Under the British Columbia Societies Act, societies must disclose the remuneration paid to directors, and to employees and contractors whose remuneration was at least $75,000 for the fiscal year.
During the year, there were 15 employees who met this criterion, and the total remuneration paid to these persons was $1,557,642. During the prior year, there were 11 employees who met this criterion, and the total remuneration paid to these persons was $1,112,976.
During the year, there was 1 contractor who met this criterion, and the total remuneration paid to this contractor was $169,800. During the prior year, there was 1 contractor who met this criterion, and the total remuneration paid to this contractor was $163,200.
16. Economic dependence
The Society received approximately 30% in 2025 (2024 - 40%) of its revenue from AHMA in the form of urban native housing subsidies and modernization and improvement funding.
17. Financial risks and concentrations of risk
The Society is exposed to various risks through its financial instruments and has a comprehensive risk management framework to monitor, evaluate and manage these risks. The following analysis provides information about the Society's risk exposure and concentration as of December 31, 2025. There have been no changes to the Society's risk exposure from the prior year.
Credit risk
Credit risk arises from the potential that a counter party will fail to perform its obligations. The Society is exposed to credit risk from tenants through accounts receivable. The maximum exposure to credit risk from the Society's receivables is $865,641 (2024 - $1,073,373). Management believes that the Society does not face significant credit risk on its receivables.
Liquidity risk
Liquidity risk is the risk that an entity will encounter difficulty in meeting obligations associated with financial liabilities. The Society is exposed to this risk mainly in respect of its long-term debt, construction loans, contributions to the pension plan, and accounts payable.
Interest rate risk
Interest rate risk is the risk that the value of a financial instrument might be adversely affected by a change in the interest rates. In seeking to minimize the risks from interest rate fluctuations, the Society manages exposure through its normal operating and financing activities. The Society is exposed to interest rate risk primarily through its floating interest rate bank indebtedness and credit facilities.
18. Credit facility
The Society has established a credit facility with M'akola Developments Services Society. Under the terms of the credit facility, the Society may draw cash in $500,000 increments when its operating cash balance drops below $1 million. Interest is payable on the facility at the RBC prime rate plus 4%. At December 31, 2025, the balance on the credit facility was $nil (2024 - $nil).
19. AHMA funding
During the year, the Society received reimbursement from AHMA for a past operating deficit totaling $286,828 upon completion of their financial review for the fiscal year ending December 31, 2024. This amount was recorded as a direct increase to net assets in accordance with AHMA's financial reporting provisions, as outlined in Note 2.
20. Related society
The Society is controlled by the same board of directors and executive management as M'akola Development Services Society, which specializes in project development and property management services. The M'akola Development Services Society follows Canadian accounting standards for not-for-profit organization (ASNPO) and has the following summarized financial information as at December 31, 2025:
| 2025 ($) | 2024 ($) | |
|---|---|---|
| Financial position | ||
| Assets | 32,687,220 | 25,221,960 |
| Liabilities | 1,081,866 | 679,409 |
| Net assets | ||
| General Fund | 13,167,789 | 15,381,754 |
| Mi's Kow A Ao Indigenous Affordable Housing Fund | 3,040,651 | 2,951,480 |
| Operating Contingency Fund | 1,119,206 | 1,086,384 |
| Property/Partnership Acquisitions Fund | 12,808,010 | 3,696,335 |
| Unfunded Operating Deficit Subsidy Fund | 294,528 | 285,891 |
| Rural and Native Operating Subsidy Fund | 1,175,170 | 1,140,707 |
| Total net assets | 31,605,354 | 24,542,551 |
| Results of operations | ||
| Revenues | 12,006,901 | 11,390,391 |
| Expenditures | 5,663,891 | 13,083,624 |
| Other income (loss) | 719,793 | 1,133,355 |
| Excess (deficiency) of revenues over expenditures | 7,062,803 | (559,878) |
| Cash flows | ||
| Operating activities | 7,825,657 | (1,920,184) |
| Investing activities | (15,085) | 4,053,277 |
| Financing activities | 904,221 | (1,690,516) |
| Increase in cash | 8,714,793 | 442,577 |
21. Comparative figures
Some of the comparative figures have been reclassified to conform to the current year's presentation.
Revenues and Expenditures by Program
Year Ended December 31, 2025 — Schedule 1
| Urban Native Assistance Program 2025 | 2024 | Goldstream 2025 | 2024 | Hope Centre 2025 | 2024 | Prince Rupert 2025 | 2024 | |
|---|---|---|---|---|---|---|---|---|
| Revenues | ||||||||
| Rental income | 3,135,457 | 2,932,072 | 489,741 | 484,249 | - | - | 1,214,458 | 1,118,079 |
| AHMA subsidies | 3,423,320 | 3,901,150 | - | - | - | - | 951,492 | 887,974 |
| Island Health Subsidies | - | - | - | - | - | - | - | - |
| Other revenue | 33,319 | - | 1,055,447 | 1,121,129 | - | - | - | - |
| Commercial rental income | - | - | - | - | - | - | - | - |
| Other COVID funding | - | - | - | - | - | - | - | - |
| Strata revenue | - | - | - | - | - | - | - | - |
| Donations and grants | - | - | 337,700 | 331,000 | - | - | - | - |
| Loan forgiveness | - | - | - | - | - | - | - | - |
| Total revenues | 6,592,097 | 6,833,222 | 1,882,888 | 1,936,378 | - | - | 2,165,950 | 2,006,053 |
| Expenditures | ||||||||
| Salaries and wages | 1,574,853 | 1,463,095 | 247,491 | 108,989 | - | - | 449,827 | 375,992 |
| Mortgage payments | 1,041,822 | 1,208,509 | 225,961 | 225,961 | - | - | - | - |
| Repairs and maintenance | 1,181,667 | 1,192,609 | 146,208 | 107,552 | - | - | 538,455 | 580,489 |
| Management fees | - | - | - | - | - | - | - | - |
| Insurance | 547,628 | 644,694 | 135,410 | 94,426 | - | - | - | 11,428 |
| Utilities | 352,367 | 371,216 | 48,814 | 51,742 | - | - | 362,449 | 379,433 |
| Property taxes | 681,741 | 625,827 | - | - | - | - | - | - |
| Office and general administration | 276,626 | 408,325 | 168,518 | 117,263 | - | - | 245,672 | 190,091 |
| Lease | - | - | - | - | - | - | - | - |
| Garbage | 326,262 | 369,023 | 14,746 | 11,896 | - | - | 235,139 | 284,178 |
| Replacement reserve | 214,730 | 214,730 | 26,784 | 26,784 | - | - | 161,720 | 121,290 |
| Landscaping | 167,316 | 169,095 | 7,482 | 4,323 | - | - | 33,000 | 51,076 |
| Hospitality and food | - | - | - | - | - | - | - | 97 |
| Strata expenses | 105,554 | - | - | - | - | - | - | - |
| Snow removal | 150,953 | 153,238 | 5,200 | 5,845 | - | - | 5,944 | 6,881 |
| Information technology | - | - | 342,091 | 279,725 | - | - | - | - |
| Amortization | - | - | - | - | - | - | - | - |
| Extraordinary repairs | - | - | 259,631 | - | - | - | - | - |
| Security | 7,848 | 24,480 | 2,887 | 1,957 | - | - | 821 | 2,910 |
| Audit fees | 19,798 | 18,777 | (453) | 4,558 | - | - | 7,717 | 7,125 |
| Laundry | 6,338 | 2,084 | - | - | - | - | 8,329 | 2,629 |
| Supplies | - | - | - | - | - | - | - | - |
| Memberships and dues | - | - | 395 | 340 | - | - | - | - |
| Total expenditures | 6,655,502 | 6,865,702 | 1,631,164 | 1,041,360 | - | - | 2,049,073 | 2,013,620 |
| Excess (deficiency) before modernization and improvement | (63,406) | (32,479) | 251,724 | 895,018 | - | - | 116,877 | (7,568) |
| Modernization and improvement funding | 911,734 | 736,784 | 21,724 | - | - | - | 238,736 | 213,662 |
| Modernization and improvement expenses | (665,553) | (396,060) | - | - | - | - | (202,710) | (313,808) |
| Net modernization and improvement | 246,181 | 340,724 | 21,724 | - | - | - | 36,026 | (100,145) |
| Excess (deficiency) from operations | 182,775 | 308,244 | 273,447 | 895,018 | - | - | 152,903 | (107,713) |
| Gain on disposal of tangible capital assets | - | - | - | - | - | - | - | - |
| Unrealized gain (loss) on marketable securities | - | - | - | (1,082) | - | - | - | - |
| Interest income | 32,443 | 39,376 | 349,439 | 262,598 | 3,772 | 4,077 | 654 | 4,272 |
| Excess amortization | 50,097 | - | - | - | - | - | - | - |
| Other income total | 82,540 | 39,376 | 349,439 | 261,516 | 3,772 | 4,077 | 654 | 4,272 |
| Excess (deficiency) of revenues over expenditures | 265,315 | 347,620 | 622,887 | 1,156,534 | 3,772 | 4,077 | 153,557 | (103,441) |
Schedule 1 (continued)
| Tonto Rosette 2025 | 2024 | White Road 2025 | 2024 | Howard 2025 | 2024 | Port Alberni 2025 | 2024 | |
|---|---|---|---|---|---|---|---|---|
| Revenues | ||||||||
| Rental income | 422,815 | 350,963 | 332,674 | 311,051 | - | - | 142,641 | 147,716 |
| AHMA subsidies | - | - | - | - | - | - | 27,892 | 65,124 |
| Island Health Subsidies | - | - | - | - | - | - | - | - |
| Other revenue | - | - | - | - | - | - | - | - |
| Commercial rental income | - | - | - | - | - | - | - | - |
| Other COVID funding | - | - | - | - | - | - | - | - |
| Strata revenue | - | - | - | - | - | - | - | - |
| Donations and grants | - | - | - | - | - | - | - | - |
| Loan forgiveness | - | - | - | - | - | - | - | - |
| Total revenues | 422,815 | 350,963 | 332,674 | 311,051 | - | 834 | 170,533 | 212,840 |
| Salaries and wages | 60,864 | 79,807 | 67,777 | 65,791 | - | - | 30,500 | - |
| Mortgage payments | - | - | - | - | - | - | - | 18,535 |
| Repairs and maintenance | 76,030 | 260,783 | 177,217 | 38,060 | - | 190 | 77,277 | 63,494 |
| Management fees | - | - | - | - | - | - | - | - |
| Insurance | 2,194 | 2,139 | 1,119 | 1,091 | - | - | 21,539 | 24,680 |
| Utilities | 49,968 | 57,238 | 22,473 | 43,278 | - | - | 10,804 | 11,758 |
| Property taxes | - | - | - | - | - | - | 18,143 | 15,853 |
| Office and general administration | 51,943 | 46,441 | 39,283 | 38,096 | - | - | 12,163 | 12,326 |
| Lease | - | - | - | - | - | - | - | - |
| Garbage | 128,831 | 103,212 | 32,589 | 20,441 | - | - | 17,861 | 18,194 |
| Replacement reserve | - | - | - | - | - | - | 8,446 | 8,446 |
| Landscaping | 29,429 | 23,697 | 14,075 | 12,380 | - | - | 8,371 | 7,188 |
| Hospitality and food | - | - | - | - | - | - | - | - |
| Strata expenses | - | - | - | - | - | - | - | - |
| Snow removal | - | - | - | - | - | - | - | - |
| Information technology | - | - | - | - | - | - | - | - |
| Amortization | - | - | - | - | - | - | - | - |
| Extraordinary repairs | - | - | - | - | - | - | - | - |
| Security | (758) | 11,029 | - | - | - | - | - | - |
| Audit fees | 180 | - | 241 | - | - | - | - | - |
| Laundry | 1,783 | 1,507 | 313 | 289 | - | - | 398 | 367 |
| Supplies | - | - | - | - | - | - | 649 | 446 |
| Memberships and dues | - | - | - | - | - | - | - | - |
| Total expenditures | 589,916 | 506,508 | 223,769 | 250,866 | - | 190 | 234,394 | 248,933 |
| Excess (deficiency) before modernization and improvement | (167,101) | (155,545) | 108,905 | 60,185 | - | 644 | (63,861) | (36,093) |
| Modernization and improvement funding | 171,077 | 269,936 | - | - | - | - | 36,194 | - |
| Modernization and improvement expenses | (192,184) | (108,116) | - | - | - | - | (36,194) | - |
| Net modernization and improvement | (21,107) | 161,821 | - | - | - | - | - | - |
| Excess (deficiency) from operations | (188,208) | 6,275 | 108,905 | 60,185 | - | 644 | (63,861) | (36,093) |
| Gain on disposal of tangible capital assets | - | - | - | - | - | - | - | - |
| Unrealized gain (loss) on marketable securities | - | - | - | - | - | - | - | - |
| Interest income | - | - | 3,293 | 3,559 | 934 | 896 | - | - |
| Excess amortization | - | - | - | - | - | - | - | - |
| Other income total | - | - | 3,293 | 3,559 | 934 | 896 | - | - |
| Excess (deficiency) of revenues over expenditures | (188,208) | 6,275 | 108,905 | 60,185 | 3,293 | 4,203 | 173,377 | (35,197) |
Schedule 1 (continued)
| Campbell River 2025 | 2024 | Laketrail 2025 | 2024 | Quadra 2025 | 2024 | Muks-Kum-Ol Housing 2025 | 2024 | |
|---|---|---|---|---|---|---|---|---|
| Revenues | ||||||||
| Rental income | 1,308,722 | 1,171,113 | 346,572 | 319,553 | 242,893 | 179,426 | 1,110,437 | 978,451 |
| AHMA subsidies | - | - | 168,689 | 133,692 | 228,456 | 228,456 | 1,247,846 | 1,302,457 |
| Island Health Subsidies | - | - | - | - | - | - | - | - |
| Other revenue | - | - | - | - | - | - | - | - |
| Commercial rental income | - | - | - | - | - | - | - | - |
| Other COVID funding | - | - | - | - | - | - | - | - |
| Strata revenue | - | - | - | - | - | - | - | - |
| Donations and grants | - | - | - | - | - | - | - | - |
| Loan forgiveness | - | - | - | - | - | - | - | - |
| Total revenues | 1,308,722 | 1,171,113 | 515,261 | 453,245 | 471,349 | 407,882 | 2,358,283 | 2,280,908 |
| Salaries and wages | 331,394 | 322,928 | 67,506 | 66,093 | 44,346 | 43,212 | 494,701 | 448,782 |
| Mortgage payments | - | - | 183,661 | 185,677 | 183,534 | 183,534 | 38,089 | 40,842 |
| Repairs and maintenance | 392,143 | 481,958 | 88,092 | 103,860 | 36,379 | 80,501 | 599,869 | 635,804 |
| Management fees | - | - | - | - | - | - | - | - |
| Insurance | 5,048 | 4,923 | 54,915 | 63,040 | 48,124 | 61,769 | 433,351 | 476,046 |
| Utilities | 151,276 | 146,851 | 56,369 | 51,421 | 39,426 | 75,571 | 121,649 | 100,452 |
| Property taxes | - | - | 14,244 | 14,177 | 16,311 | 15,023 | 341,347 | 318,329 |
| Office and general administration | 148,431 | 143,655 | 23,055 | 22,358 | 21,739 | 21,082 | 162,029 | 155,578 |
| Lease | - | - | - | - | - | - | - | - |
| Garbage | 147,028 | 123,911 | 21,412 | 29,267 | 18,738 | 26,987 | 75,892 | 96,735 |
| Replacement reserve | - | - | 24,986 | 24,986 | 14,520 | 14,521 | 93,042 | 93,042 |
| Landscaping | - | - | - | - | 7,127 | 3,210 | 93,444 | 98,402 |
| Hospitality and food | - | - | - | - | - | - | - | - |
| Strata expenses | - | - | - | - | - | - | - | - |
| Snow removal | - | - | 17,125 | 16,025 | 3,357 | 4,858 | 6,024 | 4,853 |
| Information technology | - | - | - | - | - | - | - | - |
| Amortization | - | - | - | - | - | - | - | - |
| Extraordinary repairs | - | - | - | - | - | - | - | - |
| Security | - | (10,271) | - | - | - | - | - | - |
| Audit fees | 2,828 | 396 | 637 | 378 | 1,560 | 996 | 7,042 | 40,516 |
| Laundry | 1,994 | 1,841 | 695 | 642 | 603 | 556 | - | - |
| Supplies | 2,906 | 1,744 | 638 | 351 | 908 | 674 | 9,261 | 3,986 |
| Memberships and dues | - | - | - | - | - | - | - | - |
| Total expenditures | 1,200,172 | 1,233,960 | 539,568 | 567,107 | 439,341 | 532,489 | 2,525,562 | 2,541,311 |
| Excess (deficiency) before modernization and improvement | 108,550 | (62,846) | (24,307) | (113,863) | 32,008 | (124,607) | (167,279) | (260,403) |
| Modernization and improvement funding | 123,568 | 798,938 | - | 69,648 | 77,600 | 77,600 | 508,093 | 1,812,602 |
| Modernization and improvement expenses | (103,590) | (781,038) | - | (69,648) | - | - | (95,404) | (996,687) |
| Net modernization and improvement | 19,978 | 17,901 | - | - | 77,600 | 77,600 | 412,690 | 815,915 |
| Excess (deficiency) from operations | 128,527 | (44,946) | (24,307) | (113,863) | 109,608 | (47,007) | 245,411 | 555,512 |
| Gain on disposal of tangible capital assets | - | - | - | - | - | - | - | - |
| Unrealized gain (loss) on marketable securities | - | - | - | - | - | - | - | - |
| Interest income | - | - | 2,492 | (1,996) | 568 | 10,430 | 22,555 | 81,109 |
| Excess amortization | - | - | - | - | - | - | - | - |
| Other income total | - | - | 2,492 | (1,996) | 568 | 10,430 | 22,555 | 81,109 |
| Excess (deficiency) of revenues over expenditures | 128,527 | (44,946) | (21,815) | (115,858) | 110,176 | (36,577) | 267,966 | 636,621 |
Schedule 1 (continued)
| Muks-Kum-Ol Housing Phase 12 2025 | 2024 | Rural and Native Housing 2025 | 2024 | Jesken Aerie Assisted Living 2025 | 2024 | Ts'i'ts'uwatul' Assisted Living 2025 | 2024 | |
|---|---|---|---|---|---|---|---|---|
| Revenues | ||||||||
| Rental income | 32,059 | 25,630 | 1,214,786 | 1,270,212 | 1,160,836 | 1,070,764 | 869,720 | 821,240 |
| AHMA subsidies | 19,054 | 114,324 | - | - | 272,280 | 272,280 | - | - |
| Island Health Subsidies | - | - | - | - | 670,214 | 668,856 | 744,177 | 635,369 |
| Other revenue | - | - | 117,000 | 350,000 | - | 2,340 | - | 1,574 |
| Commercial rental income | - | - | - | - | - | - | - | - |
| Other COVID funding | - | - | - | - | - | - | - | - |
| Strata revenue | - | - | - | - | - | - | - | - |
| Donations and grants | - | - | - | - | - | - | - | - |
| Loan forgiveness | - | - | - | - | - | - | - | - |
| Total revenues | 51,113 | 139,954 | 1,331,786 | 1,620,212 | 2,423,992 | 2,238,567 | 1,877,452 | 1,670,321 |
| Salaries and wages | - | 34,744 | 174,509 | 288,847 | 1,286,668 | 1,188,551 | 1,253,184 | 1,240,469 |
| Mortgage payments | - | - | 319,802 | 302,790 | - | - | 28,644 | 10,998 |
| Repairs and maintenance | 407,936 | 571,110 | 84,971 | 59,595 | 168,896 | 85,239 | 345,198 | - |
| Management fees | - | - | - | - | - | - | - | - |
| Insurance | 33,379 | 35,833 | 121,366 | 156,702 | 110,960 | 139,927 | 44,493 | 50,943 |
| Utilities | 23,178 | 21,157 | 94,082 | 94,245 | 111,140 | 103,968 | 128,554 | 59,510 |
| Property taxes | 30,645 | 28,854 | 345,431 | 355,317 | 83,262 | - | - | - |
| Office and general administration | 12,045 | 185,944 | 212,095 | 56,979 | 53,158 | 43,865 | 54,898 | - |
| Lease | - | - | - | - | - | - | - | - |
| Garbage | 128 | 1,433 | 18,407 | 27,219 | 24,216 | 14,927 | 32,675 | 25,298 |
| Replacement reserve | 2,501 | 6,003 | - | - | 43,200 | 43,200 | 36,000 | 36,000 |
| Landscaping | 7,099 | 6,250 | 11,703 | 32,621 | 876 | 3,758 | 306 | - |
| Hospitality and food | - | - | - | - | - | - | - | - |
| Strata expenses | - | - | - | - | - | - | - | - |
| Snow removal | - | - | - | - | 302,459 | 309,785 | 241,883 | 250,216 |
| Information technology | - | - | - | - | - | - | - | - |
| Amortization | - | - | - | - | 334,636 | 344,227 | - | - |
| Extraordinary repairs | - | - | - | - | - | - | - | - |
| Security | 74 | 1,358 | - | - | - | - | - | - |
| Audit fees | 3,781 | 6,478 | 10,283 | 6,818 | 2,018 | 2,370 | - | - |
| Laundry | - | - | - | - | - | - | - | - |
| Supplies | - | - | - | - | 33,184 | 27,474 | - | 336 |
| Memberships and dues | - | - | - | - | - | - | - | 76 |
| Total expenditures | 470,773 | 157,330 | 4,075,988 | 8,130,511 | 2,476,473 | 2,262,366 | 1,978,987 | 1,828,109 |
| Excess (deficiency) before modernization and improvement | (419,660) | (17,376) | (2,744,203) | (6,510,299) | (52,481) | (23,799) | (101,535) | (157,788) |
| Modernization and improvement funding | - | - | - | - | - | - | - | - |
| Modernization and improvement expenses | - | - | - | - | (22,259) | - | - | - |
| Net modernization and improvement | - | - | - | - | (22,259) | - | - | - |
| Excess (deficiency) from operations | (419,660) | (17,376) | (2,744,203) | (6,510,299) | (74,740) | (23,799) | (101,535) | (157,788) |
| Gain on disposal of tangible capital assets | 470,384 | - | 1,438,582 | 3,783,429 | - | - | - | - |
| Unrealized gain (loss) on marketable securities | - | - | - | - | - | - | - | - |
| Interest income | - | - | - | - | 7,155 | 9,251 | 10,940 | 10,635 |
| Excess amortization | - | - | - | - | - | - | - | - |
| Other income total | 470,384 | - | 1,438,582 | 3,783,429 | 7,155 | 9,251 | 10,940 | 10,635 |
| Excess (deficiency) of revenues over expenditures | 50,724 | (17,376) | (1,305,620) | (2,726,871) | (67,585) | (14,549) | (90,595) | (147,153) |
Schedule 1 (continued)
| Station MAR 2025 | 2024 | Travelodge 2025 | 2024 | Braidwood 2025 | 2024 | Oak Grove 2025 | 2024 | |
|---|---|---|---|---|---|---|---|---|
| Revenues | ||||||||
| Rental income | 226,441 | 233,678 | 262,294 | 256,335 | 230,575 | 202,621 | 177,365 | 151,659 |
| AHMA subsidies | - | - | - | - | 92,856 | 81,480 | - | - |
| Island Health Subsidies | - | - | - | - | - | - | - | - |
| Other revenue | - | - | - | - | - | - | - | - |
| Commercial rental income | - | - | - | - | - | - | - | - |
| Other COVID funding | - | - | - | - | - | - | - | - |
| Strata revenue | - | - | - | - | - | - | - | - |
| Donations and grants | - | - | - | - | - | - | - | - |
| Loan forgiveness | - | - | 16,852 | (185,373) | - | - | - | - |
| Total revenues | 226,441 | 233,678 | 262,294 | 256,335 | 340,283 | 98,728 | 177,365 | 151,659 |
| Salaries and wages | 32,334 | 53,139 | 37,565 | 58,291 | 30,560 | 22,674 | 25,677 | 34,487 |
| Mortgage payments | - | - | 40,917 | 40,917 | 122,976 | 122,254 | 116,589 | 143,308 |
| Repairs and maintenance | 46,075 | 53,462 | 36,843 | 42,197 | 130,338 | 86,289 | 8,402 | 55,068 |
| Management fees | - | - | - | - | - | - | - | - |
| Insurance | 18,793 | 20,496 | 24,241 | 27,690 | 34,509 | 30,354 | - | 888 |
| Utilities | 27,748 | 27,200 | 41,159 | 39,032 | 16,403 | 11,675 | - | 7,453 |
| Property taxes | - | - | - | - | 10,357 | 9,693 | - | - |
| Office and general administration | 26,548 | 30,922 | 35,161 | 33,920 | 22,725 | 21,942 | 21,003 | 20,069 |
| Lease | - | - | - | - | - | - | - | - |
| Garbage | 6,452 | 6,060 | 4,723 | 4,233 | 18,421 | 14,585 | - | 6,332 |
| Replacement reserve | 28,800 | 28,800 | 25,200 | 25,200 | 19,440 | 19,440 | 7,776 | 7,776 |
| Landscaping | 5,735 | 4,910 | 2,183 | 5,055 | 10,925 | 10,970 | - | 3,292 |
| Hospitality and food | - | - | - | - | - | - | - | - |
| Strata expenses | - | - | - | - | - | - | - | - |
| Snow removal | - | - | - | - | - | - | 51,972 | - |
| Information technology | - | - | - | - | - | - | - | - |
| Amortization | - | - | - | - | - | - | - | - |
| Extraordinary repairs | - | - | - | - | - | - | - | - |
| Security | - | - | - | - | 1,272 | 1,161 | 1,020 | 913 |
| Audit fees | 947 | 1,004 | 1,100 | 1,101 | 464 | 428 | 563 | 651 |
| Laundry | (1,163) | (1,158) | (2,178) | (3,014) | 794 | - | - | - |
| Supplies | - | - | - | - | - | - | - | - |
| Memberships and dues | - | - | - | - | - | - | - | - |
| Total expenditures | 196,191 | 228,997 | 249,282 | 278,249 | 429,305 | 362,253 | 231,983 | 295,594 |
| Excess (deficiency) before modernization and improvement | 30,250 | 4,681 | 13,012 | (21,914) | (89,022) | (263,525) | (54,618) | (143,936) |
| Modernization and improvement funding | - | - | - | - | - | - | - | - |
| Modernization and improvement expenses | - | - | - | - | - | - | - | - |
| Net modernization and improvement | - | - | - | - | - | - | - | - |
| Excess (deficiency) from operations | 30,250 | 4,681 | 13,012 | (21,914) | (89,022) | (263,525) | (54,618) | (143,936) |
| Gain on disposal of tangible capital assets | - | - | - | - | - | - | - | - |
| Unrealized gain (loss) on marketable securities | - | - | - | - | - | - | - | - |
| Interest income | 6,488 | 6,068 | 5,750 | 5,388 | 499 | 680 | 926 | 857 |
| Excess amortization | - | - | - | - | - | - | - | - |
| Other income total | 6,488 | 6,068 | 5,750 | 5,388 | 499 | 680 | 926 | 857 |
| Excess (deficiency) of revenues over expenditures | 36,738 | 10,749 | 18,762 | (16,526) | (88,523) | (262,845) | (53,692) | (143,079) |
Schedule 1 (continued)
| Station Strata 2025 | 2024 | Station PRHCLEM 2025 | 2024 | Station Phase 2 2025 | 2024 | Comox Aspen 2025 | 2024 | |
|---|---|---|---|---|---|---|---|---|
| Revenues | ||||||||
| Rental income | 463,933 | 436,989 | 276,786 | 246,204 | - | - | 57,311 | 59,428 |
| AHMA subsidies | - | - | 426,636 | 423,840 | - | - | - | - |
| Island Health Subsidies | - | - | - | - | - | - | - | - |
| Other revenue | - | - | - | - | - | - | - | - |
| Commercial rental income | - | - | - | - | 376,686 | - | - | - |
| Other COVID funding | - | - | - | - | - | - | - | - |
| Strata revenue | - | - | - | - | - | - | - | - |
| Donations and grants | - | - | - | - | - | - | - | - |
| Loan forgiveness | - | - | - | - | - | - | - | - |
| Total revenues | 463,933 | 436,989 | 703,422 | 670,044 | 376,686 | - | 57,311 | 59,428 |
| Salaries and wages | 66,570 | 99,372 | 63,148 | 58,385 | - | - | 8,084 | 13,514 |
| Mortgage payments | - | - | 393,137 | 393,137 | - | - | 15,943 | 15,943 |
| Repairs and maintenance | 18,110 | 20,760 | 61,824 | 110,853 | 10,000 | - | 6,502 | 3,855 |
| Management fees | - | - | - | - | - | - | - | - |
| Insurance | - | - | 199,151 | 140,840 | - | 516 | 554 | 1,928 |
| Utilities | 21,833 | 2,816 | 13,502 | 63,423 | - | 91 | - | - |
| Property taxes | - | - | - | - | - | - | - | - |
| Office and general administration | 40,268 | - | - | - | - | - | - | - |
| Lease | - | - | - | - | - | - | - | - |
| Garbage | - | - | 18,275 | 16,758 | 54,453 | 57,826 | 28,189 | 27,337 |
| Replacement reserve | 37,703 | - | 22,519 | 22,830 | - | - | - | - |
| Landscaping | - | - | - | - | - | - | - | - |
| Hospitality and food | - | - | - | - | - | - | - | - |
| Strata expenses | - | - | - | - | - | - | - | - |
| Snow removal | - | - | - | - | - | - | - | - |
| Information technology | - | - | - | - | - | - | - | - |
| Amortization | - | - | - | - | - | - | - | - |
| Extraordinary repairs | - | - | - | - | - | - | - | - |
| Security | - | - | - | - | - | - | - | - |
| Audit fees | 2,478 | - | 12,119 | 36,906 | - | - | - | 21,600 |
| Laundry | - | - | - | - | - | - | - | - |
| Supplies | - | - | - | - | - | - | - | - |
| Memberships and dues | - | - | - | - | - | - | - | - |
| Total expenditures | 247,476 | 270,289 | 718,740 | 861,696 | 376,686 | - | 72,167 | 73,783 |
| Excess (deficiency) before modernization and improvement | 216,457 | 166,700 | (15,319) | (191,652) | - | - | (14,856) | (14,355) |
| Modernization and improvement funding | - | - | - | - | - | - | - | - |
| Modernization and improvement expenses | - | - | - | - | - | - | - | - |
| Net modernization and improvement | - | - | - | - | - | - | - | - |
| Excess (deficiency) from operations | 216,457 | 166,700 | (15,319) | (191,652) | - | - | (14,856) | (14,355) |
| Gain on disposal of tangible capital assets | - | - | - | - | - | - | - | - |
| Unrealized gain (loss) on marketable securities | - | - | - | - | - | - | - | - |
| Interest income | 3,179 | 2,722 | 3,420 | 3,010 | - | - | - | - |
| Excess amortization | - | - | - | - | - | - | - | - |
| Other income total | 3,179 | 2,722 | 3,420 | 3,010 | - | - | - | - |
| Excess (deficiency) of revenues over expenditures | 219,636 | 169,423 | (11,899) | (188,642) | - | - | (14,856) | (14,355) |
Schedule 1 (continued)
| SFN Kennedy 2025 | 2024 | Drennan 2025 | 2024 | Oliver Airport 2025 | 2024 | Charters 2025 | 2024 | |
|---|---|---|---|---|---|---|---|---|
| Revenues | ||||||||
| Rental income | 418,449 | 409,789 | 1,011,605 | 906,451 | 74,400 | 74,400 | 2,401,904 | 965,186 |
| AHMA subsidies | 502,920 | 437,172 | - | - | - | - | 85,440 | 178,824 |
| Island Health Subsidies | - | - | - | - | - | - | - | - |
| Other revenue | - | 130 | - | - | - | - | - | - |
| Commercial rental income | - | - | - | - | - | - | - | - |
| Other COVID funding | - | - | - | - | - | - | - | - |
| Strata revenue | - | - | - | - | - | - | - | - |
| Donations and grants | - | - | - | - | - | - | - | - |
| Loan forgiveness | - | - | - | - | - | - | - | - |
| Total revenues | 921,369 | 847,091 | 1,011,605 | 906,451 | 74,400 | 74,400 | 2,487,344 | 1,144,010 |
| Salaries and wages | 86,371 | 80,007 | 21,560 | 90,613 | - | - | 261,466 | 255,692 |
| Mortgage payments | 603,011 | 653,934 | 584,720 | 585,142 | - | - | 1,395,629 | 465,029 |
| Repairs and maintenance | 66,187 | 70,322 | 112,697 | 92,855 | 3,097 | 4,839 | 275,410 | 91,379 |
| Management fees | - | - | - | - | - | - | - | - |
| Insurance | 36,895 | 42,196 | 66,922 | 106,604 | - | - | 150,983 | 169,793 |
| Utilities | 52,349 | 51,585 | 75,817 | 66,203 | 327 | 378 | 107,822 | 55,653 |
| Property taxes | 15,176 | 14,563 | 132,893 | - | - | 16,013 | 68,984 | 197,577 |
| Office and general administration | 16,000 | 10,868 | 30,030 | 21,124 | 18,000 | 21,720 | 25,708 | 18,370 |
| Lease | - | - | - | - | - | - | - | - |
| Garbage | 10,415 | 9,124 | 12,322 | 9,645 | 2,360 | 1,601 | 27,979 | 14,136 |
| Replacement reserve | 37,375 | 37,536 | 64,800 | 64,800 | 3,456 | 5,472 | 110,160 | 110,160 |
| Landscaping | 11,994 | 7,003 | 23,705 | 32,280 | 3,885 | 3,300 | 62,488 | 27,732 |
| Hospitality and food | - | - | - | - | - | - | - | - |
| Strata expenses | - | - | - | - | - | - | - | - |
| Snow removal | - | - | - | - | - | - | - | - |
| Information technology | - | 750 | 7,438 | 10,695 | 4,052 | 3,310 | 8,952 | 9,604 |
| Amortization | - | - | - | - | - | - | - | - |
| Extraordinary repairs | - | - | - | - | - | - | - | - |
| Security | - | - | - | - | - | - | - | - |
| Audit fees | 98 | 578 | 17,511 | 14,653 | - | - | 21,847 | 17,142 |
| Laundry | 1,544 | 1,426 | 16,144 | 14,905 | - | - | 7,300 | 6,740 |
| Supplies | 1,137 | 1,881 | (1,072) | (1,087) | - | - | - | - |
| Memberships and dues | - | - | - | - | - | - | - | - |
| Total expenditures | 938,552 | 981,772 | 1,165,487 | 1,108,431 | 35,178 | 56,633 | 2,524,729 | 1,439,007 |
| Excess (deficiency) before modernization and improvement | (17,183) | (134,681) | (153,882) | (201,981) | 39,223 | 17,767 | (37,384) | (294,997) |
| Modernization and improvement funding | - | - | - | - | - | - | - | - |
| Modernization and improvement expenses | - | - | - | - | - | - | - | - |
| Net modernization and improvement | - | - | - | - | - | - | - | - |
| Excess (deficiency) from operations | (17,183) | (134,681) | (153,882) | (201,981) | 39,223 | 17,767 | (37,384) | (294,997) |
| Gain on disposal of tangible capital assets | - | - | - | - | - | - | - | - |
| Unrealized gain (loss) on marketable securities | - | - | - | - | - | - | - | - |
| Interest income | 4,225 | 3,341 | 5,567 | 4,120 | 287 | 193 | 6,943 | 3,880 |
| Excess amortization | - | - | - | - | - | - | - | - |
| Other income total | 4,225 | 3,341 | 5,567 | 4,120 | 287 | 193 | 6,943 | 3,880 |
| Excess (deficiency) of revenues over expenditures | (12,958) | (131,340) | (148,315) | (197,861) | 39,510 | 17,960 | (30,441) | (291,117) |
Schedule 1 (continued)
| Terrace Lazelle 2025 | 2024 | Douglas 2025 | 2024 | WFC 2025 | 2024 | Songhees 2025 | 2024 | |
|---|---|---|---|---|---|---|---|---|
| Revenues | ||||||||
| Rental income | 372,986 | 327,449 | - | - | 158,830 | - | 84,693 | - |
| AHMA subsidies | 469,392 | 553,620 | - | - | - | - | - | - |
| Island Health Subsidies | - | - | - | - | - | - | - | - |
| Other revenue | - | - | - | - | - | - | 89,072 | - |
| Commercial rental income | - | - | 615,567 | - | - | - | - | - |
| Other COVID funding | - | - | - | - | - | - | - | - |
| Strata revenue | - | - | - | - | - | - | - | - |
| Donations and grants | - | - | - | - | - | - | - | - |
| Loan forgiveness | - | - | - | - | - | - | - | - |
| Total revenues | 842,378 | 881,069 | 615,567 | - | 158,830 | - | 173,765 | - |
| Salaries and wages | 59,646 | 55,676 | - | - | 96,480 | - | 53,760 | - |
| Mortgage payments | 416,978 | 416,937 | - | - | - | - | - | 129,273 |
| Repairs and maintenance | 154,998 | 4,975 | - | - | 21,752 | - | 16,894 | - |
| Management fees | - | - | - | - | - | - | - | - |
| Insurance | 43,782 | 50,011 | 19,594 | - | - | - | - | 40,129 |
| Utilities | 40,129 | 40,678 | 3,386 | - | 28,468 | - | - | - |
| Property taxes | 76,921 | 73,436 | 119,025 | - | 6,191 | - | - | - |
| Office and general administration | 13,184 | 92,786 | - | - | 30,792 | - | 24,571 | - |
| Lease | - | - | - | - | - | - | - | - |
| Garbage | 16,517 | 17,914 | - | - | 4,447 | - | 2,963 | - |
| Replacement reserve | 40,500 | 40,500 | - | - | 25,920 | - | 19,008 | - |
| Landscaping | 18,770 | 8,660 | 11,686 | - | - | - | - | - |
| Hospitality and food | - | - | - | - | - | - | - | - |
| Strata expenses | - | - | - | - | - | - | - | - |
| Snow removal | - | - | - | - | - | - | - | - |
| Information technology | - | - | - | - | - | - | - | - |
| Amortization | - | - | - | - | - | - | - | - |
| Extraordinary repairs | - | - | - | - | - | - | - | - |
| Security | - | - | - | - | - | - | - | - |
| Audit fees | 16,250 | 11,068 | 5,907 | - | - | - | 316 | - |
| Laundry | - | - | - | - | - | - | - | - |
| Supplies | - | - | - | - | - | - | - | - |
| Memberships and dues | - | - | - | - | - | - | - | - |
| Total expenditures | 874,261 | 967,229 | 164,573 | - | 215,212 | - | 117,512 | - |
| Excess (deficiency) before modernization and improvement | (31,883) | (86,160) | 450,995 | - | (56,382) | - | 56,253 | - |
| Modernization and improvement funding | - | - | - | - | - | - | - | - |
| Modernization and improvement expenses | - | - | - | - | - | - | - | - |
| Net modernization and improvement | - | - | - | - | - | - | - | - |
| Excess (deficiency) from operations | (31,883) | (86,160) | 450,995 | - | (56,382) | - | 56,253 | - |
| Gain on disposal of tangible capital assets | - | - | - | - | - | - | - | - |
| Unrealized gain (loss) on marketable securities | - | - | - | - | - | - | - | - |
| Interest income | 2,349 | 2,575 | - | - | - | - | - | - |
| Excess amortization | - | - | - | - | - | - | - | - |
| Other income total | 2,349 | 2,575 | - | - | - | - | - | - |
| Excess (deficiency) of revenues over expenditures | (29,534) | (83,585) | 450,995 | - | (56,382) | - | 56,253 | - |
Schedule 1 (continued)
| Sawmill 2025 | 2024 | Total 2025 | 2024 | |
|---|---|---|---|---|
| Revenues | ||||
| Rental income | 1,605,936 | - | 19,847,320 | 15,450,707 |
| AHMA subsidies | - | - | 7,916,273 | 8,580,393 |
| Island Health Subsidies | - | - | 1,414,391 | 1,304,225 |
| Other revenue | 111,682 | - | 1,406,520 | 1,476,006 |
| Commercial rental income | - | - | 615,567 | - |
| Other COVID funding | - | - | 584,217 | 436,466 |
| Strata revenue | - | - | 376,686 | - |
| Donations and grants | - | - | 337,700 | 331,000 |
| Loan forgiveness | - | - | 16,852 | (185,373) |
| Total revenues | 1,717,618 | - | 32,515,526 | 27,393,423 |
| Salaries and wages | 228,600 | - | 7,155,441 | 6,549,150 |
| Mortgage payments | - | - | 5,701,304 | 5,059,944 |
| Repairs and maintenance | 55,246 | - | 5,053,009 | 5,001,464 |
| Management fees | - | - | 2,718,282 | 6,035,123 |
| Insurance | 10,803 | - | 2,107,405 | 2,417,845 |
| Utilities | 688 | - | 2,035,103 | 1,903,031 |
| Property taxes | - | - | 1,978,948 | 1,741,687 |
| Office and general administration | 78,048 | - | 1,920,882 | 1,867,123 |
| Lease | 1,364,255 | - | 1,364,255 | - |
| Garbage | - | - | 1,237,429 | 1,250,946 |
| Replacement reserve | 171,600 | - | 1,234,684 | 983,406 |
| Landscaping | - | - | 544,896 | 518,982 |
| Hospitality and food | - | - | 544,342 | 560,099 |
| Strata expenses | - | - | 376,686 | - |
| Snow removal | 676 | - | 352,683 | 320,104 |
| Information technology | - | - | 342,091 | 279,725 |
| Amortization | - | - | 334,636 | 344,227 |
| Extraordinary repairs | - | - | 258,947 | 2,116 |
| Security | 350 | - | 132,966 | 134,169 |
| Audit fees | 5,250 | - | 85,505 | 80,110 |
| Laundry | - | - | 59,733 | 36,346 |
| Supplies | - | - | 23,909 | 18,358 |
| Memberships and dues | - | - | 395 | 340 |
| Total expenditures | 1,915,516 | - | 35,563,531 | 35,104,295 |
| Excess (deficiency) before modernization and improvement | (197,898) | - | (3,048,005) | (7,710,872) |
| Modernization and improvement funding | - | - | 2,088,725 | 3,979,170 |
| Modernization and improvement expenses | - | - | (1,317,893) | (2,665,356) |
| Net modernization and improvement | - | - | 770,832 | 1,313,814 |
| Excess (deficiency) from operations | (197,898) | - | (2,277,173) | (6,397,058) |
| Gain on disposal of tangible capital assets | - | - | 1,908,967 | 3,783,429 |
| Unrealized gain (loss) on marketable securities | - | - | - | (1,082) |
| Interest income | - | - | 473,878 | 457,042 |
| Excess amortization | - | - | 286,401 | - |
| Other income total | - | - | 2,669,246 | 4,239,389 |
| Excess (deficiency) of revenues over expenditures | (197,898) | - | 392,073 | (2,157,669) |
Allocation of Expenditures by Program
Year Ended December 31, 2025 — Schedule 2
| Program | Salaries and wages 2025 ($) | 2024 ($) | Office and general administration 2025 ($) | 2024 ($) | Audit fees 2025 ($) | 2024 ($) |
|---|---|---|---|---|---|---|
| Urban Native Assistance Program | 1,574,853 | 1,463,095 | 276,626 | 408,325 | 19,798 | 18,777 |
| Goldstream | 247,491 | 108,989 | 168,518 | 117,263 | (453) | 4,558 |
| Hope Centre | - | - | - | - | - | - |
| Prince Rupert | 449,827 | 375,992 | 245,672 | 190,091 | 7,717 | 7,125 |
| Port Alberni | 60,864 | 79,807 | 51,943 | 46,441 | 1,783 | 1,507 |
| Howard | 67,777 | 65,791 | 39,283 | 38,096 | 313 | 289 |
| Tonto Rosette | - | - | - | - | - | - |
| White Road | 30,500 | - | 12,163 | 12,326 | 398 | 367 |
| Campbell River | 331,394 | 322,928 | 148,431 | 143,655 | 1,994 | 1,841 |
| Laketrail | 67,506 | 66,093 | 23,055 | 22,358 | 695 | 642 |
| Quadra | 44,346 | 43,212 | 21,739 | 21,082 | 603 | 556 |
| Muks-Kum-Ol Native Housing | 494,701 | 448,782 | 162,029 | 155,578 | - | - |
| Muks-Kum-Ol Native Housing Phase 12 | - | 34,744 | - | 12,045 | - | - |
| Rural and Native Housing | 174,509 | 288,847 | 185,944 | 212,095 | 5,111 | 5,455 |
| Jesken Aerie Assisted Living | 1,286,668 | 1,188,551 | 56,979 | 53,158 | 6,062 | 5,752 |
| Ts'i'ts'uwatul' Lelum Assisted Living | 1,253,184 | 1,240,469 | 43,865 | 54,898 | 2,420 | 2,234 |
| Travelodge | 32,334 | 53,139 | 26,548 | 30,922 | 947 | 1,004 |
| Braidwood | 37,565 | 58,291 | 35,161 | 33,920 | 1,100 | 1,101 |
| Oak Grove | 30,560 | 22,674 | 22,725 | 21,942 | 464 | 428 |
| Station MAR | 25,677 | 34,487 | 21,003 | 20,069 | 563 | 651 |
| Station PRHCLEM | 66,570 | 99,372 | 54,453 | 57,826 | 1,437 | 1,877 |
| Station Phase 2 | 63,148 | 58,385 | 28,189 | 27,337 | 724 | 1,739 |
| Station Strata | - | - | 37,703 | - | 2,400 | - |
| Comox Aspen | 8,084 | 13,514 | 22,519 | 22,830 | 237 | 255 |
| Oliver Airport | 86,371 | 80,007 | 16,000 | 10,868 | 1,544 | 1,426 |
| Charters | 21,560 | 90,613 | 30,030 | 21,124 | 16,144 | 14,905 |
| SFN Kennedy | - | - | 18,000 | 21,720 | - | - |
| Drennan | 261,466 | 255,692 | 25,708 | 18,370 | 7,300 | 6,740 |
| Terrace Lazelle | 59,646 | 55,676 | 13,184 | 92,786 | 953 | 880 |
| Douglas | - | - | - | - | - | - |
| WFC | 96,480 | - | 30,792 | - | - | - |
| Songhees | 53,760 | - | 24,571 | - | - | - |
| Sawmill | 228,600 | - | 78,048 | - | 5,250 | - |
| Total | 7,155,441 | 6,549,150 | 1,920,882 | 1,867,123 | 85,505 | 80,110 |
Allocation of Salaries and Wages by Program
Year Ended December 31, 2025 — Schedule 3
| Program | Administrative salaries 2025 ($) | 2024 ($) | Maintenance salaries 2025 ($) | 2024 ($) | Support salaries 2025 ($) | 2024 ($) | Total 2025 ($) | 2024 ($) |
|---|---|---|---|---|---|---|---|---|
| Urban Native Assistance Program | 1,133,853 | 1,014,060 | 441,000 | 449,036 | - | - | 1,574,853 | 1,463,095 |
| Goldstream | 230,213 | 76,386 | 17,277 | 32,602 | - | - | 247,491 | 108,989 |
| Hope Centre | - | - | - | - | - | - | - | - |
| Prince Rupert | 272,415 | 222,151 | 177,412 | 153,841 | - | - | 449,827 | 375,992 |
| Port Alberni | 45,820 | 55,934 | 15,044 | 23,873 | - | - | 60,864 | 79,807 |
| Howard | 56,297 | 54,102 | 11,481 | 11,690 | - | - | 67,777 | 65,791 |
| Tonto Rosette | - | - | - | - | - | - | - | - |
| White Road | 25,240 | - | 5,260 | - | - | - | 30,500 | - |
| Campbell River | 253,507 | 243,621 | 77,888 | 79,307 | - | - | 331,394 | 322,928 |
| Laketrail | 46,187 | 44,386 | 21,319 | 21,707 | - | - | 67,506 | 66,093 |
| Quadra | 33,944 | 32,621 | 10,402 | 10,592 | - | - | 44,346 | 43,212 |
| Muks-Kum-Ol Housing | 447,740 | 403,641 | 46,961 | 45,142 | - | - | 494,701 | 448,782 |
| Muks-Kum-Ol Housing Phase 12 | - | 31,250 | - | 3,495 | - | - | - | 34,744 |
| Rural and Native Housing | 131,374 | 202,442 | 43,135 | 86,405 | - | - | 174,509 | 288,847 |
| Jesken Aerie Assisted Living | 48,052 | 46,239 | 86,467 | 22,845 | 1,152,148 | 1,119,468 | 1,286,668 | 1,188,551 |
| Ts'i'ts'uwatul' Lelum Assisted Living | 59,299 | 59,836 | 26,390 | 26,871 | 1,167,495 | 1,153,762 | 1,253,184 | 1,240,469 |
| Travelodge | 24,342 | 37,243 | 7,992 | 15,896 | - | - | 32,334 | 53,139 |
| Braidwood | 28,279 | 40,854 | 9,285 | 17,437 | - | - | 37,565 | 58,291 |
| Oak Grove | 21,557 | 13,507 | 9,003 | 9,167 | - | - | 30,560 | 22,674 |
| Station MAR | 19,330 | 24,171 | 6,347 | 10,316 | - | - | 25,677 | 34,487 |
| Station PRHCLEM | 50,115 | 69,646 | 16,455 | 29,726 | - | - | 66,570 | 99,372 |
| Station Phase 2 | 53,052 | 48,105 | 10,097 | 10,281 | - | - | 63,148 | 58,385 |
| Comox Aspen | 6,085 | 9,471 | 1,998 | 4,043 | - | - | 8,084 | 13,514 |
| Oliver Airport | 66,864 | 60,144 | 19,508 | 19,863 | - | - | 86,371 | 80,007 |
| Charters | 10,742 | 55,027 | 10,818 | 35,585 | - | - | 21,560 | 90,613 |
| Drennan | 184,181 | 176,999 | 77,285 | 78,693 | - | - | 261,466 | 255,692 |
| Terrace Lazelle | 35,642 | 31,235 | 24,004 | 24,441 | - | - | 59,646 | 55,676 |
| WFC | 70,200 | - | 26,280 | - | - | - | 96,480 | - |
| Songhees | 23,760 | - | 30,000 | - | - | - | 53,760 | - |
| Sawmill | 150,000 | - | 78,600 | - | - | - | 228,600 | - |
| Total | 3,528,091 | 3,053,068 | 1,307,707 | 1,222,852 | 2,319,643 | 2,273,230 | 7,155,441 | 6,549,150 |
Change in Replacement Reserve by Program
Year Ended December 31, 2025 — Schedule 4
| Beginning of year ($) | Provision ($) | Interest ($) | Expenditures ($) | End of year ($) | |
|---|---|---|---|---|---|
| Urban Native Assistance Program | 1,202,476 | 214,730 | 32,443 | (386,976) | 1,062,672 |
| Goldstream | 142,117 | 26,784 | 4,988 | (10,502) | 163,387 |
| Hope Centre | 119,782 | - | 3,772 | - | 123,554 |
| Prince Rupert | 125,562 | 161,720 | 654 | (266,524) | 21,412 |
| Tonto Rosette | 104,578 | - | 3,293 | - | 107,872 |
| White Road | 26,775 | 8,446 | 934 | (5,568) | 30,587 |
| Laketrail | 108,729 | 24,986 | 2,492 | (54,587) | 81,620 |
| Quadra | 65,748 | 14,520 | 568 | (62,232) | 18,604 |
| Muks-Kum-Ol Housing | 841,441 | 93,042 | 22,555 | (298,385) | 658,653 |
| Muks-Kum-Ol Housing Phase 12 | 103,432 | 2,501 | - | (25,783) | 80,150 |
| Jesken Aerie Assisted Living | 273,566 | 43,200 | 7,155 | (89,566) | 234,355 |
| Ts'i'ts'uwatul' Lelum Assisted Living | 311,416 | 36,000 | 10,940 | - | 358,357 |
| Travelodge | 177,237 | 28,800 | 6,488 | - | 212,525 |
| Braidwood | 157,390 | 25,200 | 5,750 | - | 188,340 |
| Oak Grove | 19,797 | 19,440 | 499 | (23,405) | 16,331 |
| Station MAR | 24,901 | 7,776 | 926 | (3,261) | 30,342 |
| Station PRHCLEM | 79,336 | 21,600 | 3,179 | - | 104,114 |
| Station Phase 2 | 87,233 | 33,120 | 3,420 | (11,757) | 112,016 |
| Oliver Airport | 96,788 | 37,375 | 4,225 | - | 138,388 |
| Charters | 119,356 | 64,800 | 5,567 | (7,360) | 182,364 |
| SFN Kennedy | 5,665 | 3,456 | 287 | - | 9,408 |
| Drennan | 114,040 | 110,160 | 6,943 | (3,720) | 227,423 |
| Terrace Lazelle | 34,098 | 40,500 | 2,349 | - | 76,947 |
| WFC | - | 25,920 | - | - | 25,920 |
| Songhees | - | 19,008 | - | - | 19,008 |
| Sawmill | - | 171,600 | - | - | 171,600 |
| Total | 4,341,463 | 1,234,684 | 129,427 | (1,249,626) | 4,455,948 |
Interest and contributed funds are limited to bank interest earned.
Year ended December 31, 2024
| Beginning of year ($) | Provision ($) | Interest ($) | Expenditures ($) | End of year ($) | |
|---|---|---|---|---|---|
| Urban Native Assistance Program | 1,001,194 | 255,230 | 39,376 | (93,325) | 1,202,476 |
| Goldstream | 115,868 | 26,784 | 4,861 | (5,396) | 142,117 |
| Prince Rupert | - | 121,290 | 4,272 | - | 125,562 |
| Hope Centre | 115,705 | - | 4,077 | - | 119,782 |
| Tonto Rosette | 101,019 | - | 3,559 | - | 104,578 |
| White Road | 26,231 | 8,446 | 896 | (8,798) | 26,775 |
| Laketrail | 85,739 | 24,986 | (1,996) | - | 108,729 |
| Quadra | 120,358 | 14,521 | 10,430 | (79,561) | 65,748 |
| Muks-Kum-Ol Native Housing | 852,301 | 93,042 | 81,109 | (185,011) | 841,441 |
| Muks-Kum-Ol Housing Phase 12 | 97,429 | 6,003 | - | - | 103,432 |
| Jesken Aerie Assisted Living | 255,131 | 43,200 | 9,251 | (34,016) | 273,566 |
| Ts'i'ts'uwatul' Lelum Assisted Living | 295,795 | 36,000 | 10,635 | (31,013) | 311,416 |
| Travelodge | 142,369 | 28,800 | 6,068 | - | 177,237 |
| Braidwood | 126,802 | 25,200 | 5,388 | - | 157,390 |
| Oak Grove | 17,379 | 19,440 | 680 | (17,702) | 19,797 |
| Station MAR | 24,247 | 7,776 | 857 | (7,979) | 24,901 |
| Station PRHCLEM | 57,178 | 21,600 | 2,722 | (2,165) | 79,336 |
| Station Phase 2 | 69,233 | 33,120 | 3,010 | (18,130) | 87,233 |
| Oliver Airport | 55,911 | 37,536 | 3,341 | - | 96,788 |
| Charters | 50,436 | 64,800 | 4,120 | - | 119,356 |
| SFN Kennedy | - | 5,472 | 193 | - | 5,665 |
| Drennan | - | 110,160 | 3,880 | - | 114,040 |
| Terrace Lazelle | 31,523 | - | 2,575 | - | 34,098 |
| Total | 3,641,849 | 983,406 | 199,305 | (483,097) | 4,341,463 |
Interest and contributed funds are limited to bank interest earned.
Document Images
(1)