DocumentsAppendixSep 26, 2023Pages 42–43
CRD 2022 OD Survey - District 15 (City of Langford) Two-Page Excerpt
Two-page excerpt from the CRD 2022 Origin-Destination Household Travel Survey presenting demographic characteristics and travel patterns for District 15 – City of Langford.
Key facts
- Population (persons 5+): 45,600 (District 15 - City of Langford)
- Daily mode shares show majority auto driver trips; active transportation share within Langford is lower (documented in report)
- Top AM peak trip destinations from Langford and summaries of trip purposes (work, shopping, return home, etc.)
- Area size: 20.01 km2 (as shown in excerpt)
District 15 - City of Langford
Demographic Characteristics
- Population 5+ (trips reported for survey sample): 45,600
Occupation Status
| Occupation Status | Men+ | Women+ | Total | % |
|---|---|---|---|---|
| Employed full time | 12,650 | 10,680 | 23,330 | 48% |
| Employed part time | 1,750 | 3,400 | 5,150 | 11% |
| Student | 5,020 | 5,450 | 10,470 | 22% |
| Retiree | 3,060 | 3,970 | 7,030 | 15% |
| Stay-at-home parent / caregiver | 60 | 580 | 640 | 1% |
| Pre-schooler (0-4 years) | 1,360 | 1,440 | 2,800 | 6% |
| Other status | 790 | 1,030 | 1,820 | 4% |
| Total | 23,660 | 24,740 | 48,400 |
Workplace locations of residents of this geography
| Workplace location | Part-time | Full-time | Total | % |
|---|---|---|---|---|
| Work exclusively from home | 370 | 4,060 | 4,440 | 16% |
| No fixed workplace / on the road | 870 | 1,770 | 2,640 | 9% |
| Usual workplace outside the home | 3,910 | 17,500 | 21,400 | 75% |
| Total | 5,150 | 23,330 | 28,480 | 100% |
Workers with usual workplace, pattern in week previous
| Pattern | Part-time | Full-time | Total |
|---|---|---|---|
| Avg. weekday, % who commuted to work/travel for work | 47% | 75% | 70% |
| Avg. weekday, % who telecommuted | 5% | 19% | 16% |
| % who telecommuted on at least one weekday | 12% | 34% | 30% |
Traveller Characteristics
| Characteristic | Men+ | Women+ | Total |
|---|---|---|---|
| Licensed drivers | 17,950 | 18,540 | 36,490 |
| Car share members | 220 | 230 | 450 |
Households by Dwelling Type
| Dwelling Type | Total | % |
|---|---|---|
| Single-detached house | 7,010 | 35% |
| Other ground-oriented | 7,660 | 38% |
| Apartment/condominium 1-4 floor | 3,900 | 20% |
| Apartment/condominium 5+ floors | 1,390 | 7% |
| Total: | 19,970 | 100% |
Selected Indicators
- Daily Trips per Person 5+: 2.58
- Vehicles per Person: 0.73
- Daily Trips per Household: 5.42
- Vehicles per Household: 1.78
- Adult Bicycles per Household: 1.16
- Workers per Household: 1.43
- Number of Persons per Household: 2.42
- Jobs per Person: 0.37
- Population Density (Pop/km2): 2,420
- Employment Density (Jobs/km2): 890
Household Size
| Household Size | Total | % |
|---|---|---|
| 1 person | 5,230 | 26% |
| 2 persons | 7,190 | 36% |
| 3 persons | 3,310 | 17% |
| 4 persons | 2,760 | 14% |
| 5+ persons | 1,480 | 7% |
| Total: | 19,970 | 100% |
Households by Vehicle Availability
| Vehicles available | Total | % |
|---|---|---|
| No vehicles | 540 | 3% |
| 1 vehicle | 8,820 | 44% |
| 2 vehicles | 6,910 | 35% |
| 3+ vehicles | 3,700 | 19% |
| Total: | 19,970 | 100% |
Vehicles by Fuel Type
| Fuel type | Total | % |
|---|---|---|
| Gas | 32,300 | 91% |
| Hybrid | 800 | 2% |
| Plug-in Hybrid | 310 | 1% |
| Electric | 1,310 | 4% |
| Diesel | 800 | 2% |
| Biodiesel | 20 | 0% |
| Other | - | 0% |
Mode Shares for Residents of Area
- Estimated Total Daily Trips: 2017 = 97,940 ; 2022 = 117,720
| Mode | 2017 | 2022 |
|---|---|---|
| Auto Driver | 64% | 62% |
| Auto Passenger | 18% | 18% |
| Transit | 6% | 4% |
| Bicycle & Micromobility | 1% | 3% |
| Walk | 8% | 9% |
| Other (school bus, taxi, ferry, etc) | 2% | 4% |
- Access to EV Charging (Note: as self-reported by respondents; asked of a two-thirds sample.)
- Yes, in my building: 13%
- Yes, nearby: 9%
- Not available, not conveniently nearby: 64%
- Don't know: 14%
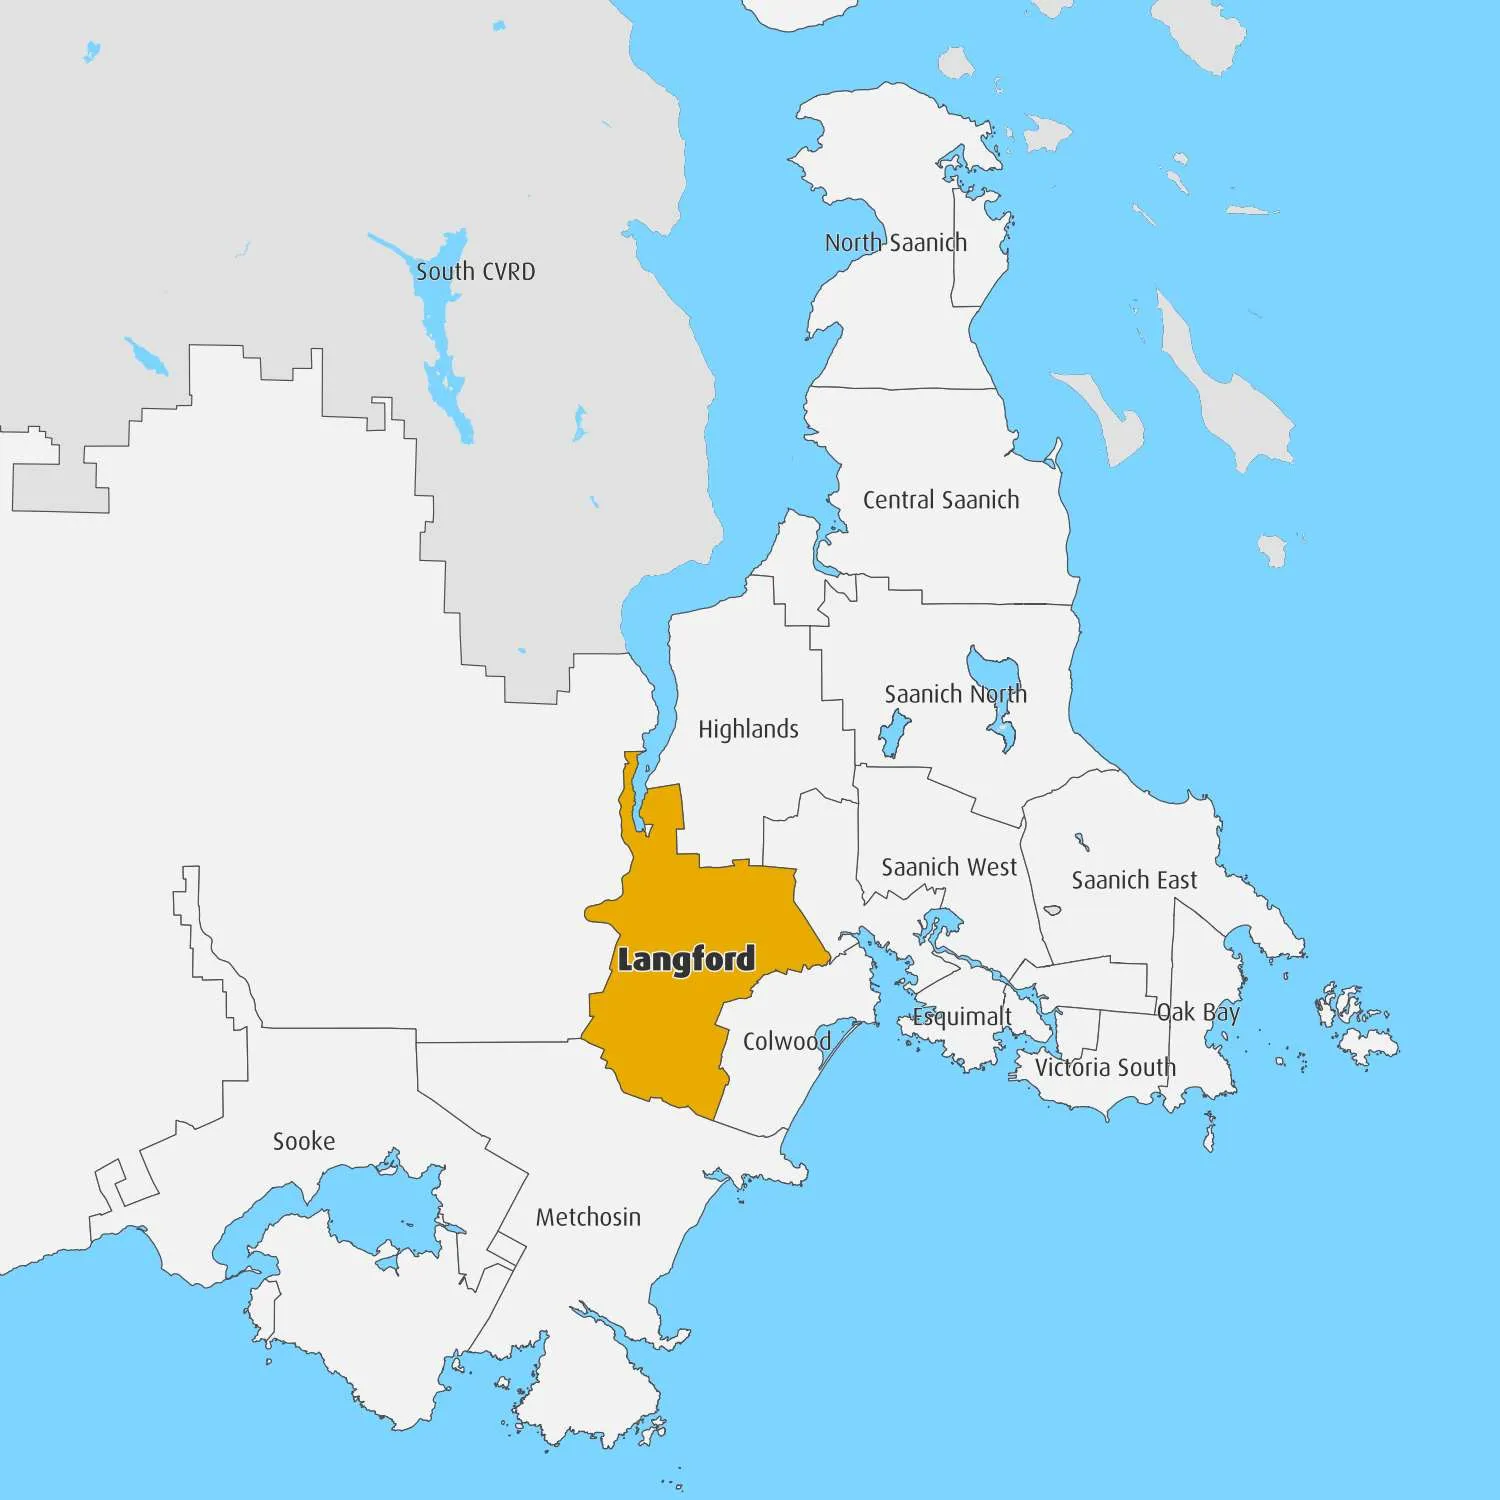
Travel Patterns - Persons 5+
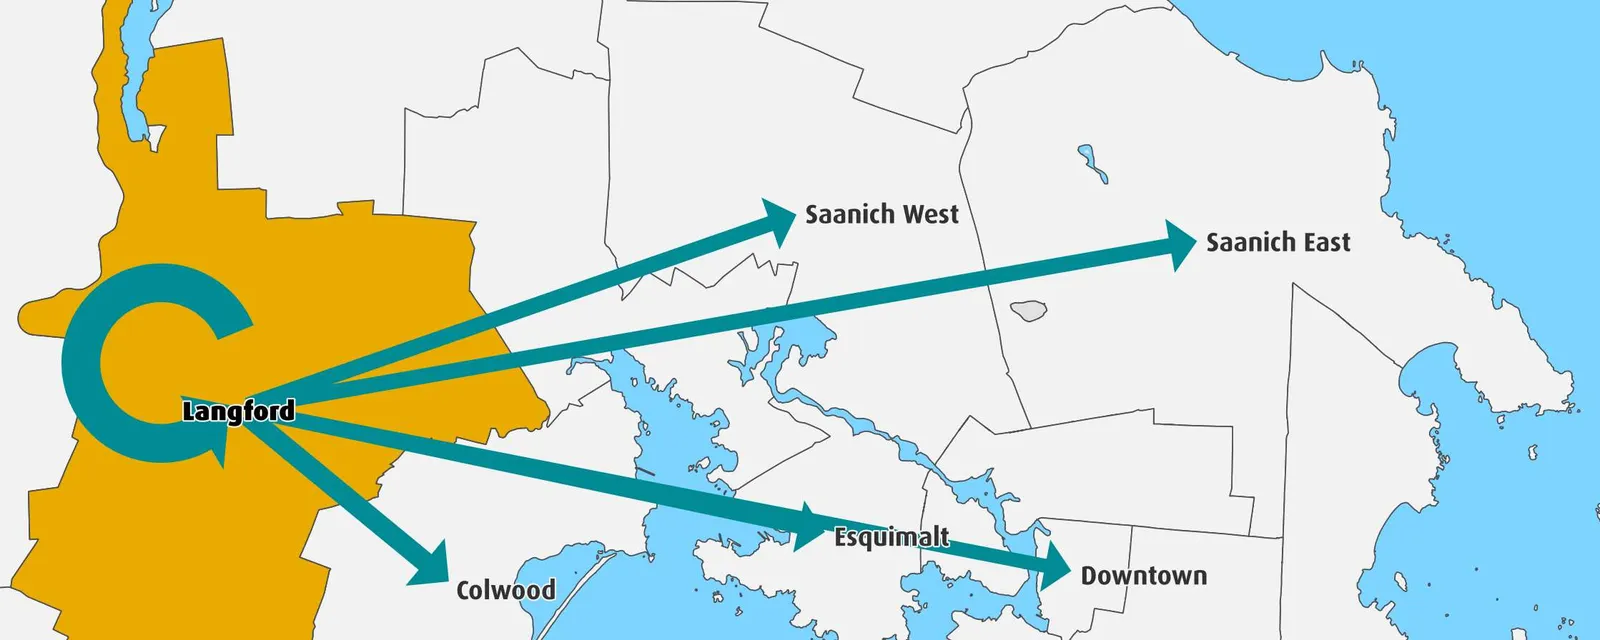
Top Five Destinations of AM Peak Trips from District 15 - City of Langford
Summary of Trips to and from District 15 - City of Langford
(AM Peak Period (06:00 - 08:59) — Trips made by persons 5+)
| Destination | Trips From District | % | Trips To District | % |
|---|---|---|---|---|
| Salt Spring Island Electoral Area | - | 0% | 30 | 0% |
| Sidney | 160 | 1% | 10 | 0% |
| North Saanich, Tsyecum FN, Pauquachin FN | 300 | 1% | 80 | 0% |
| Central Saanich, Tsartlip FN, Tsawout FN | 510 | 2% | 400 | 2% |
| Downtown | 1,600 | 6% | 180 | 1% |
| Victoria North | 980 | 4% | 200 | 1% |
| Victoria South | 960 | 4% | 300 | 2% |
| Saanich North | 250 | 1% | 200 | 1% |
| Saanich East | 2,080 | 8% | 730 | 4% |
| Saanich West | 2,090 | 8% | 580 | 3% |
| Oak Bay | 340 | 1% | 50 | 0% |
| Esquimalt | 1,690 | 6% | 450 | 3% |
| View Royal, Esquimalt Nation, Songhees FN | 640 | 2% | 650 | 4% |
| Highlands | 30 | 0% | 450 | 3% |
| Langford | 10,410 | 39% | 10,410 | 58% |
| Colwood | 3,830 | 14% | 1,720 | 10% |
| Metchosin, Scia’new FN | 190 | 1% | 370 | 2% |
| Sooke, T’Sou-ke FN | 160 | 1% | 910 | 5% |
| Juan de Fuca Electoral Area, Pacheedaht FN | 30 | 0% | 200 | 1% |
| External South CVRD | 350 | 1% | - | 0% |
| External Other | 20 | 0% | - | 0% |
| Total | 26,590 | 100% | 17,920 | 100% |
Note: 2022 trip-level data on this page are for trips made by persons aged 5+ years. They may be compared against the 2017 report but not the 2011 report, which was based on trips made by persons aged 11+ years. See analytical sections of this report for comparisons of 2017, 2011, 2006, and 2001 trip data for persons 11+ and discussion of the results.
Trips by Trip Purpose - Persons 5+ (24 Hours)
| Purpose | From District | % | To District | % | Within District | % |
|---|---|---|---|---|---|---|
| Work | 13,550 | 25% | 6,900 | 13% | 4,660 | 9% |
| Post-secondary school | 1,100 | 2% | - | 0% | 20 | 0% |
| K-12 school | 2,480 | 5% | 650 | 1% | 3,510 | 6% |
| Personal business | 3,370 | 6% | 3,350 | 6% | 2,450 | 4% |
| Recreation / social | 6,010 | 11% | 3,550 | 6% | 4,180 | 8% |
| Dining / restaurant | 1,100 | 2% | 1,750 | 3% | 2,410 | 4% |
| Other | 1,580 | 3% | 1,470 | 3% | 1,830 | 3% |
| Shopping | 2,690 | 5% | 10,370 | 19% | 11,420 | 21% |
| Pick-up / drop-off passenger | 4,800 | 9% | 2,780 | 5% | 4,760 | 9% |
| Return Home | 19,740 | 36% | 25,640 | 47% | 21,260 | 39% |
| Other | 130 | 0% | 70 | 0% | 170 | 0% |
| Total: | 54,970 | 100% | 55,060 | 100% | 54,840 | 100% |
Trips by Travel Mode - Persons 5+ (24 Hours)
| Mode | From District | % | To District | % | Within District | % |
|---|---|---|---|---|---|---|
| Auto Driver | 38,100 | 69% | 38,180 | 69% | 31,950 | 58% |
| Auto Passenger | 10,540 | 19% | 10,780 | 20% | 9,410 | 17% |
| Transit | 2,600 | 5% | 2,550 | 5% | 800 | 1% |
| Bicycle & Micromobility | 1,570 | 3% | 1,460 | 3% | 1,630 | 3% |
| Walk | 580 | 1% | 600 | 1% | 9,220 | 17% |
| Other | (implied in totals) | |||||
| Total: | 54,970 | 100% | 55,060 | 100% | 54,840 | 100% |
AM Peak (06:00-08:59) — Trips by Purpose
| Purpose | From District | % | To District | % | Within District | % |
|---|---|---|---|---|---|---|
| Work | 9,560 | 59% | 3,740 | 50% | 2,190 | 21% |
| Post-secondary school | 830 | 5% | - | 0% | 20 | 0% |
| K-12 school | 2,340 | 14% | 580 | 8% | 3,420 | 33% |
| Personal business | 760 | 5% | 210 | 3% | 220 | 2% |
| Recreation / social | 580 | 4% | 280 | 4% | 330 | 3% |
| Dining / restaurant | 210 | 1% | 380 | 5% | 290 | 3% |
| Other | 1,060 | 7% | 260 | 3% | 850 | 8% |
| Shopping | 80 | 0% | 910 | 12% | 380 | 4% |
| Pick-up / drop-off passenger | 1,670 | 10% | 580 | 8% | 2,230 | 21% |
| Return Home | 160 | 1% | 820 | 11% | 1,280 | 12% |
| Other | - | 0% | 20 | 0% | 60 | 1% |
| Total: | 16,180 | 100% | 7,510 | 100% | 10,410 | 100% |
AM Peak (06:00-08:59) — Trips by Mode
| Mode | From District | % | To District | % | Within District | % |
|---|---|---|---|---|---|---|
| Auto Driver | 10,690 | 66% | 5,730 | 76% | 5,040 | 48% |
| Auto Passenger | 2,420 | 15% | 720 | 10% | 1,860 | 18% |
| Transit | 1,160 | 7% | 560 | 7% | 230 | 2% |
| Bicycle & Micromobility | 680 | 4% | 160 | 2% | 340 | 3% |
| Walk | 160 | 1% | 90 | 1% | 2,080 | 20% |
| Other modes included in totals | ||||||
| Total: | 16,180 | 100% | 7,510 | 100% | 10,410 | 100% |
PM Peak (15:00-17:59) — Trips by Purpose
| Purpose | From District | % | To District | % | Within District | % |
|---|---|---|---|---|---|---|
| Work | 520 | 4% | 630 | 3% | 500 | 3% |
| Post-secondary school | - | 0% | - | 0% | - | 0% |
| K-12 school | - | 0% | - | 0% | - | 0% |
| Personal business | 750 | 6% | 620 | 3% | 660 | 4% |
| Recreation / social | 1,850 | 14% | 1,180 | 6% | 1,470 | 10% |
| Dining / restaurant | 280 | 2% | 460 | 2% | 600 | 4% |
| Other | 340 | 3% | 770 | 4% | 550 | 4% |
| Shopping | 730 | 6% | 2,850 | 14% | 2,670 | 18% |
| Pick-up / drop-off passenger | 1,100 | 8% | 1,170 | 6% | 1,070 | 7% |
| Return Home | 7,970 | 60% | 13,180 | 66% | 7,980 | 53% |
| Other | 50 | 0% | 10 | 0% | - | 0% |
| Total: | 13,260 | 100% | 20,100 | 100% | 14,950 | 100% |
PM Peak (15:00-17:59) — Trips by Mode
| Mode | From District | % | To District | % | Within District | % |
|---|---|---|---|---|---|---|
| Auto Driver | 9,170 | 69% | 13,650 | 68% | 9,280 | 62% |
| Auto Passenger | 2,740 | 21% | 3,730 | 19% | 2,740 | 18% |
| Transit | 620 | 5% | 1,020 | 5% | 430 | 3% |
| Bicycle & Micromobility | 300 | 2% | 810 | 4% | 520 | 3% |
| Walk | 100 | 1% | 120 | 1% | 1,440 | 10% |
| Other modes included in totals | ||||||
| Total: | 13,260 | 100% | 20,100 | 100% | 14,950 | 100% |
Peak Period (%)
Total: % of 24 Hours Within District (%)
24 Hours 164,900 100% 33%
24 Hours 1.28 5% 1.28 5% 1.29 1%
AM Peak Period 34,100 21% 31%
AM Peak Period 1.23 7% 1.13 7% 1.37 2%
PM Peak Period 48,300 29% 31%
PM Peak Period 1.30 5% 1.27 5% 1.30 3%
From District | To District | Within District Avg Vehicle Occupancy | Transit Mode Share | Avg Vehicle Occupancy | Transit Mode Share | Avg Vehicle Occupancy | Transit Mode Share
CRD Origin-Destination 2022 Household Travel Survey
R.A. Malatest Associates Ltd.