DocumentsStaff ReportApr 19, 2021Pages 83–106
Staff Report: 2021 - 2025 Five-Year Financial Plan Approval (Finance)
Finance staff report presenting the proposed Five-Year Financial Plan (2021-2025) for Council approval, including proposed budgets and financial projections.
Key facts
- Report covers the 2021-2025 financial plan
- Page range: 83-106
- Action: recommendation to approve Five-Year Financial Plan
Staff Report to Council
Date: 19/04/2021
Department: Finance
Subject: 2021 - 2025 Five-Year Financial Plan Approval
Background
The Community Charter requires council to adopt a Five-Year Financial Plan (the Plan) each year and, after the adoption of the Plan and before May 15th, to adopt a tax rate bylaw. As the final information necessary for the tax rate bylaw is not available until April, each of the bylaws normally come forward in April and then for adoption at the first Council meeting in May. The Financial Plan Bylaw and the Tax Rate Bylaw will come before Council in May for adoption.
Commentary
Each departmental budget has been presented at an open meeting of the relevant committee, which fulfills the statutory requirement for a public financial planning process.
The 2021 budget provides for the maintenance of all service levels across departments as the City continues to grow. Council’s priority of public safety and parks and recreation highlight the 2021 – 2025 Financial Plan.
Fire Department: 2021 is the fourth year of a five-year program to increase fire department resources to meet the needs of growth within the City.
Police: From 2017 through 2020 the City has added 20 RCMP officer positions and the proposed financial plan includes an additional 2 members each year and police resources to meet the needs of growth within the City. In addition to the cost of the RCMP member, we must also fund the municipal employees (ME’s) at the detachment and standard practice is to have one ME for every three RCMP officers so in this time we have also had the need to add 6 ME’s. In addition to the costs associated with the increase in officers and ME’s (in 2017 each officer cost the City approximately $160,000), the RCMP has now unionized and while they have not yet completed their collective agreement the municipality must budget for and accrue the cost of projected salary increases that will be paid retroactively to the officers. The salary accrual for 2021 equals approximately $775,000 and the current per officer cost is now approximately $180,000).
All other City departments have seen increases, due to inflation and growth, that are covered through the growth in the tax base.
The capital budget provides for spending of $36,616,275 in 2021, with 100% funded from non-tax sources such as contributions, grants, short-term debt financing and reserves.
Major components of the capital budget include:
- Significant investment in land banking for the purposes of parking, parks, wayfinding signage, public art and public amenity space.
- Bike trails and multi-use trails
- Opening of 3680 Trans Canada Highway Property – providing public access to the waterfront (opening date still to be determined)
- Construction of a roundabout at Millstream Rd and Bear Mountain Parkway
- Storm water improvement projects
- Jordie Lunn Bike Park
- Replacement of a Fire Engine
- Sooke Rd at Glen Lake realignment and signalization
- Starlight Stadium lighting improvements
- Langford Lake Loop to complete walking trail around Langford Lake
- Construction of the Chidlow Connector
- Completion of road network improvements in the downtown core
- Additional Park improvements
It is also worth noting the projects that were both started and/or completed in 2020, including but not limited to:
- Four additional RCMP officers (to complete a 5 year program to add 20 officers)
- Four additional career firefighters (2020 was the 3rd year of a five year plan)
- Humpback Road Multi-use trail
- Peatt at Brock Roundabout
- Florence Lake Rd Improvements
- McCallum Rd Improvements
- Bear Mountain Parkway Extension
- Completion of the Starlight Stadium Seating expansion
- Jordie Lunn Bike Park
- City of Langford website redesign
A summary of the 2021-2025 Five-Year Financial Plan is attached as Exhibit “A”.
Taxation Implications
Last year due to the COVID-19 pandemic being in its infancy and Council not knowing what the impacts would be on the City and the tax payers the City reduced the 2020 tax increase from 3.49% to 1.9%. Due to the ongoing COVID-19 pandemic, the proposed 2021 – 2025 Five Year Financial Plan has again been reduced from an initial recommended 3.95% to the proposed 2.95% in 2021. It is worth noting that these reductions have been made possible due to the growth in the tax base as well as due to the level of investment and construction the City has seen and would not be possible without this.
Staff have worked hard to achieve a proposed financial plan that balances the impact of the 2020 adjustment, the impact of the 2021 reduction, the growth of the City, maintaining service levels, ensuring that the short and long-term sustainability of the budget is strong all while ensuring that Langford maintains one of the lowest tax rates in the CRD and when compared to comparable sized municipalities in BC.
Council’s priority of public safety services make up 2.5% of the tax increase this year, the fourth of a five-year plan, with 1% to fire and 1.5% to police for additional resources to meet the requirements of growth within in the City. The additional 0.45% increase in the proposed 2021 budget made up of both an increase as a result of the adjustment in 2020 and to cover increased costs of service due to inflation and growth of the City.
The City will continue to maintain some of the lowest residential taxes in the region and the province. The proposed 2.95% increase will result in the representative house seeing an increase of approximately $45 in the municipal portion of their property tax bill. The five year financial plan includes a 5% tax increase in 2022 and an increase of 6% in 2023, 2024 and 2025. These increases will maintain Council’s focus on public safety, reflect the impact of the reduction in 2020 and 2021, and ensure long term financial sustainability.
The following tables show how low Langford’s residential taxes are in comparison to others in the region and similar sized municipalities throughout the province. Also included in the tables below are the 2020 tax rates which represent the tax amount per $1000 of assessed value.
Total Residential Property Taxes And Charges on a Representative House (2020)
- Langford: 3,154
- Metchosin: 3,319
- Sooke: 3,476
- Colwood: 3,833
- View Royal: 3,835
- North Cowichan: 3,966
- Highlands: 3,994
- Penticton: 4,115
- Esquimalt: 4,235
- Courtenay: 4,295
- North Saanich: 4,313
- Sidney: 4,408
- Vernon: 4,449
- Campbell River: 4,607
- Mission: 4,762
- Central Saanich: 5,043
- Langley: 5,116
- West Kelowna: 5,456
- Victoria: 5,480
- Saanich: 5,744
- North Vancouver: 5,917
- Port Moody: 6,546
- Oak Bay: 8,304
- West Vancouver: 10,443
2020 Tax Rates for Residential (Class 1) and Business (Class 6)
(Extracted list — residential rate then municipal/business counterpart as presented)
- North Saanich — Residential: 1.48950 | West Vancouver — Business: 3.06888
- West Vancouver — Residential: 1.71737 | North Vancouver - C — Business: 5.27568
- Metchosin — Residential: 1.81470 | Port Moody — Business: 5.36450
- North Vancouver - C — Residential: 1.87205 | Central Saanich — Business: 5.55587
- View Royal — Residential: 2.27610 | Sidney — Business: 5.71212
- Sidney — Residential: 2.33456 | Langley - C — Business: 6.41300
- Highlands — Residential: 2.35710 | Oak Bay — Business: 6.43070
- Langford — Residential: 2.36150 | Langford — Business: 6.61220
- Langley - C — Residential: 2.46650 | Penticton — Business: 6.66050
- Sooke — Residential: 2.58892 | Sooke — Business: 7.30931
- Port Moody — Residential: 2.64750 | Metchosin — Business: 7.36660
- Oak Bay — Residential: 2.86180 | West Kelowna — Business: 7.50376
- Central Saanich — Residential: 2.88578 | North Saanich — Business: 7.88560
- Colwood — Residential: 2.90800 | View Royal — Business: 8.08015
- Saanich — Residential: 3.08098 | North Cowichan — Business: 8.99670
- Victoria — Residential: 3.11520 | Vernon — Business: 9.99152
- Courtenay — Residential: 3.19310 | Esquimalt — Business: 10.24288
- West Kelowna — Residential: 3.22050 | Victoria — Business: 10.35810
- Mission — Residential: 3.36632 | Highlands — Business: 10.37090
- North Cowichan — Residential: 3.49450 | Courtenay — Business: 10.37760
- Esquimalt — Residential: 3.53537 | Colwood — Business: 11.43270
- Vernon — Residential: 3.54850 | Campbell River — Business: 12.11932
- Penticton — Residential: 3.81440 | Mission — Business: 12.13714
- Campbell River — Residential: 4.45960 | Saanich — Business: 12.22339
Financial Summary (Revenues)
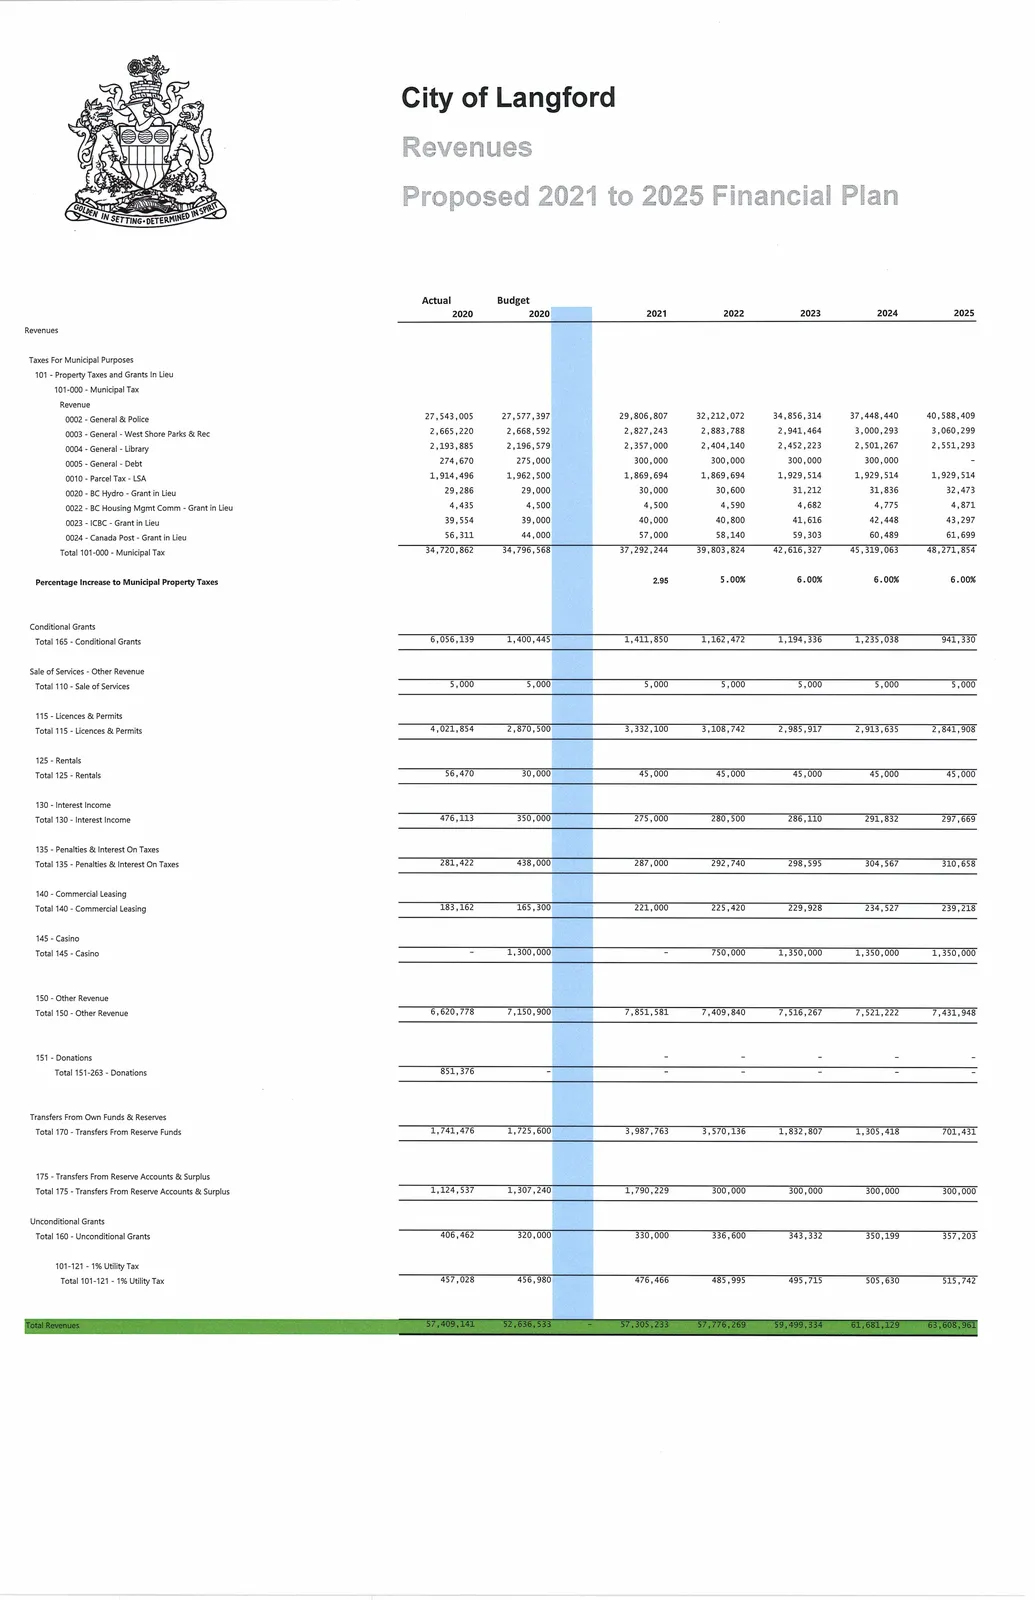
Below is the key revenue summary (selected lines and totals as extracted):
| Revenue Source / Note | Actual 2020 | Budget 2020 | 2021 | 2022 | 2023 | 2024 | 2025 |
|---|---|---|---|---|---|---|---|
| 0002 - General & Police (Municipal Tax Revenue) | 27,543,005 | 27,577,397 | 29,806,807 | 32,212,072 | 34,856,314 | 37,448,440 | 40,588,409 |
| 0003 - General - West Shore Parks & Rec | 2,665,220 | 2,668,592 | 2,827,243 | 2,883,788 | 2,941,464 | 3,000,293 | 3,060,299 |
| 0004 - General - Library | 2,193,885 | 2,196,579 | 2,357,000 | 2,404,140 | 2,452,223 | 2,501,267 | 2,551,293 |
| 0005 - General - Debt | 274,670 | 275,000 | 300,000 | 300,000 | 300,000 | 300,000 | — |
| 0010 - Parcel Tax - LSA | 1,914,496 | 1,962,500 | 1,869,694 | 1,869,694 | 1,929,514 | 1,929,514 | 1,929,514 |
| 0020 - BC Hydro - Grant in Lieu | 29,286 | 29,000 | 30,000 | 30,600 | 31,212 | 31,836 | 32,473 |
| 0022 - BC Housing Mgmt Comm - Grant in Lieu | 4,435 | 4,500 | 4,500 | 4,590 | 4,682 | 4,775 | 4,871 |
| 0023 - ICBC - Grant in Lieu | 39,554 | 39,000 | 40,000 | 40,800 | 41,616 | 42,448 | 43,297 |
| 0024 - Canada Post - Grant in Lieu | 56,311 | 44,000 | 57,000 | 58,140 | 59,303 | 60,489 | 61,699 |
| Total 101-000 - Municipal Tax | 34,720,862 | 34,796,568 | 37,292,244 | 39,803,824 | 42,616,327 | 45,319,063 | 48,271,854 |
| Percentage Increase to Municipal Property Taxes | — | — | 2.95 | 5.00% | 6.00% | 6.00% | 6.00% |
| Total 165 - Conditional Grants | 6,056,139 | 1,400,445 | 1,411,850 | 1,162,472 | 1,194,336 | 1,235,038 | 941,330 |
| Total 110 - Sale of Services | 5,000 | 5,000 | 5,000 | 5,000 | 5,000 | 5,000 | 5,000 |
| Total 115 - Licences & Permits | 4,021,854 | 2,870,500 | 3,332,100 | 3,108,742 | 2,985,917 | 2,913,635 | 2,841,908 |
| Total 125 - Rentals | 56,470 | 30,000 | 45,000 | 45,000 | 45,000 | 45,000 | 45,000 |
| Total 130 - Interest Income | 476,113 | 350,000 | 275,000 | 280,500 | 286,110 | 291,832 | 297,669 |
| Total 135 - Penalties & Interest On Taxes | 281,422 | 438,000 | 287,000 | 292,740 | 298,595 | 304,567 | 310,658 |
| Total 140 - Commercial Leasing | 183,162 | 165,300 | 221,000 | 225,420 | 229,928 | 234,527 | 239,218 |
| Total 145 - Casino | 1,300,000 | 750,000 | 1,350,000 | 1,350,000 | 1,350,000 | — | — |
| Total 150 - Other Revenue | 6,620,778 | 7,150,900 | 7,851,581 | 7,409,840 | 7,516,267 | 7,521,222 | 7,431,948 |
| Total 170 - Transfers From Reserve Funds | 1,741,476 | 1,725,600 | 3,987,763 | 3,570,136 | 1,832,807 | 1,305,418 | 701,431 |
| Total 175 - Transfers From Reserve Accounts & Surplus | 1,124,537 | 1,307,240 | 1,790,229 | 300,000 | 300,000 | 300,000 | 300,000 |
| Total 160 - Unconditional Grants | 406,462 | 320,000 | 330,000 | 336,600 | 343,332 | 350,199 | 357,203 |
| Total 101-121 - 1% Utility Tax | 457,028 | 456,980 | 476,466 | 485,995 | 495,715 | 505,630 | 515,742 |
| Total Revenues | 57,409,141 | 52,636,533 | 57,305,233 | 57,776,269 | 59,499,334 | 61,681,129 | 63,608,961 |
Departmental Expenditures and Summaries
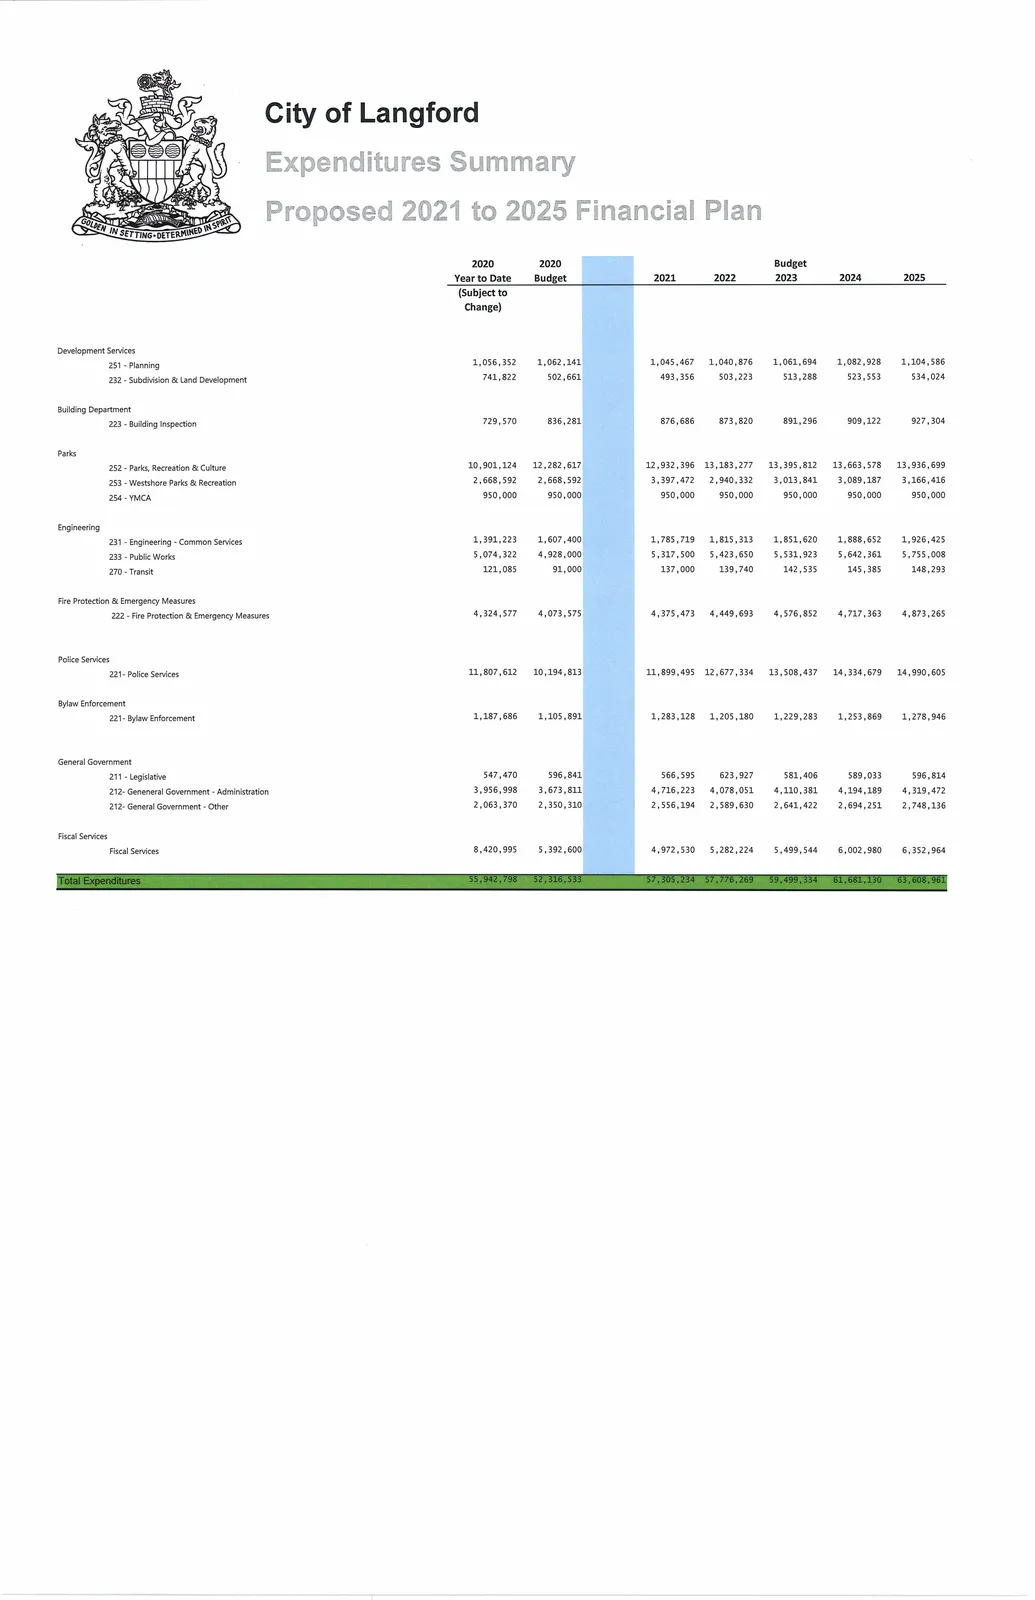
(Departmental totals and line items for 2020 Actual, 2020 Budget and 2021–2025 projections are provided in the financial plan; selected totals below are from the extracted schedules.)
Development Services (Total Development Services)
- 2020 Actual: 1,798,174
- 2020 Budget: 1,564,802
- 2021: 1,538,823
- 2022: 1,544,099
- 2023: 1,574,981
- 2024: 1,606,481
- 2025: 1,638,611
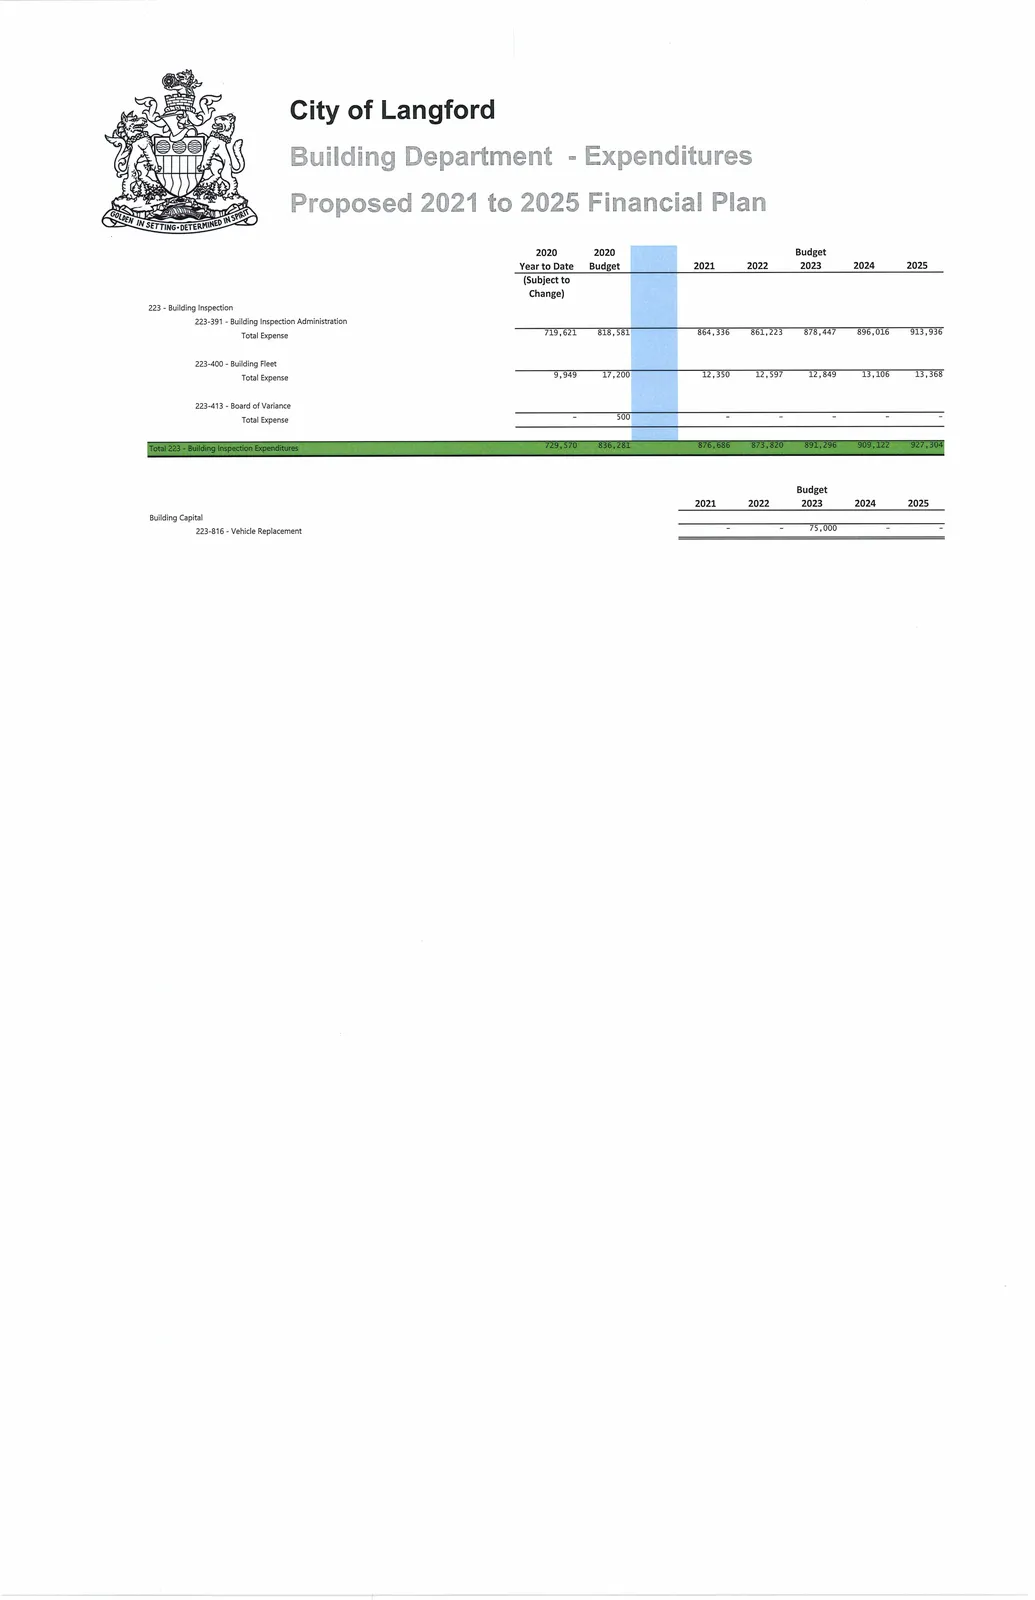
Parks, Recreation & Culture (Total Recreation and Cultural Services)
- 2020 Actual: 14,519,716
- 2020 Budget: 15,901,209
- 2021: 17,279,868
- 2022: 17,073,609
- 2023: 17,359,653
- 2024: 17,702,765
- 2025: 18,053,115
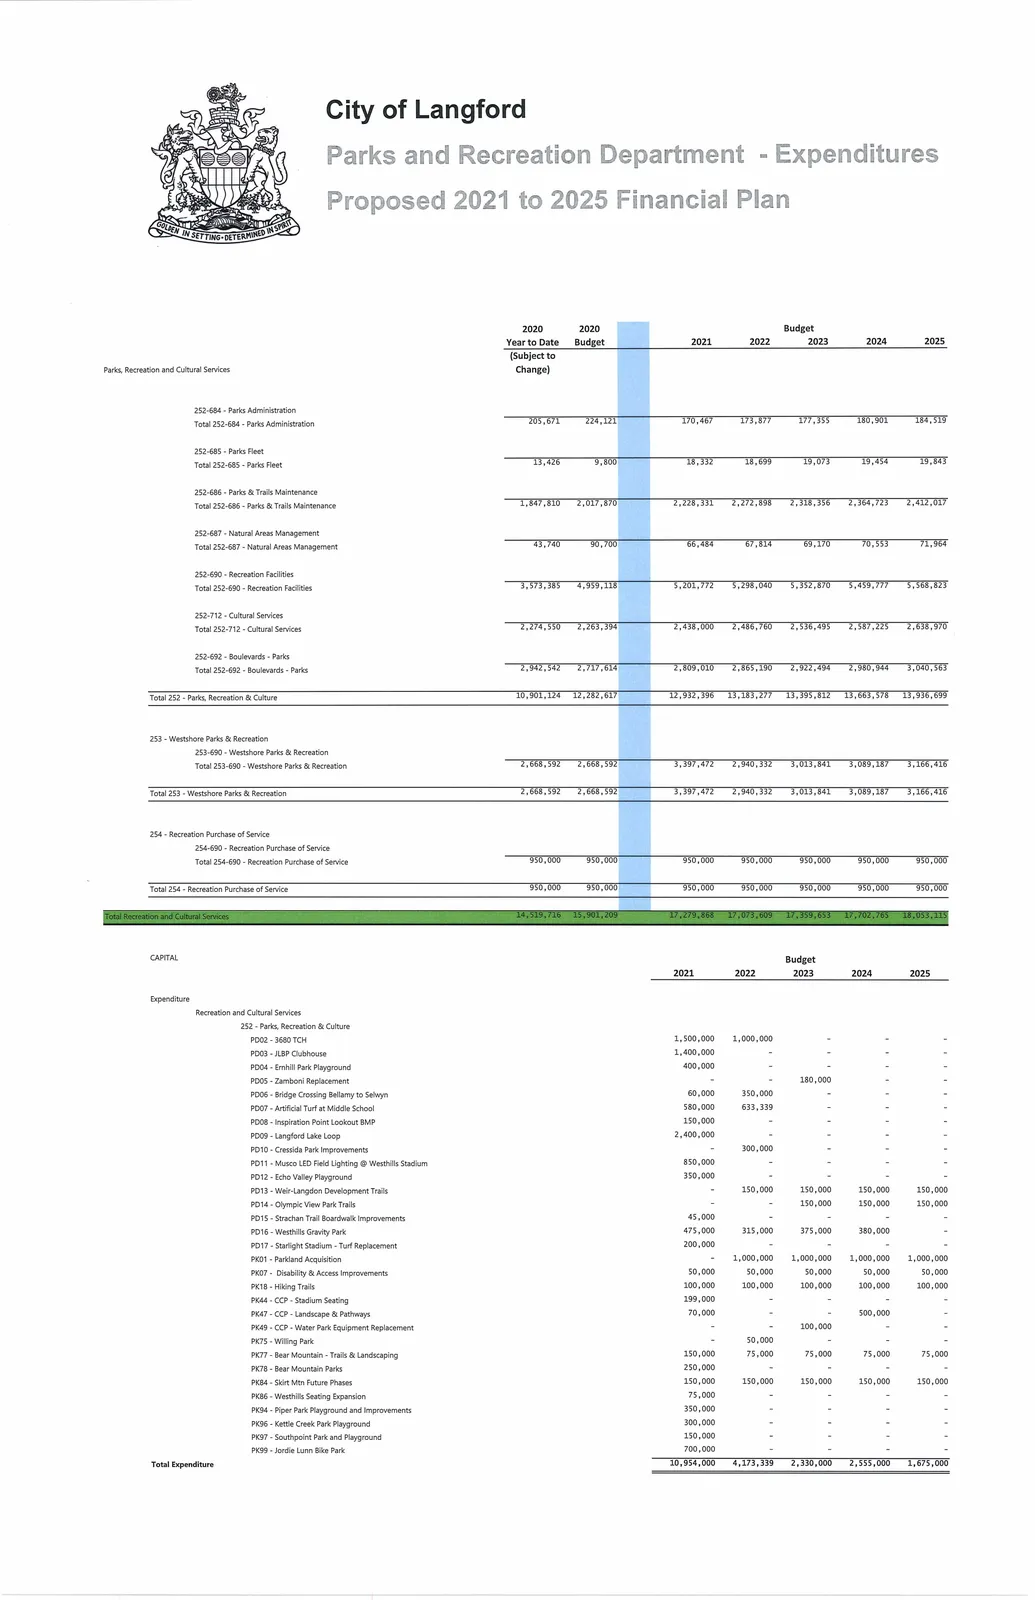
Engineering — Transportation & Public Works (Total Transportation & Public Works)
- 2020 Actual: 6,586,630
- 2020 Budget: 6,626,400
- 2021: 7,240,219
- 2022: 7,378,703
- 2023: 7,526,077
- 2024: 7,676,399
- 2025: 7,829,727
Fire Protection & Emergency Measures (Total 222)
- 2020 Actual (select lines shown in schedules)
- Fire Administration & related totals shown across the plan with major line items and capital needs (see Capital section for Fire vehicles and stations).
- 2020 Actual (select lines shown in schedules)
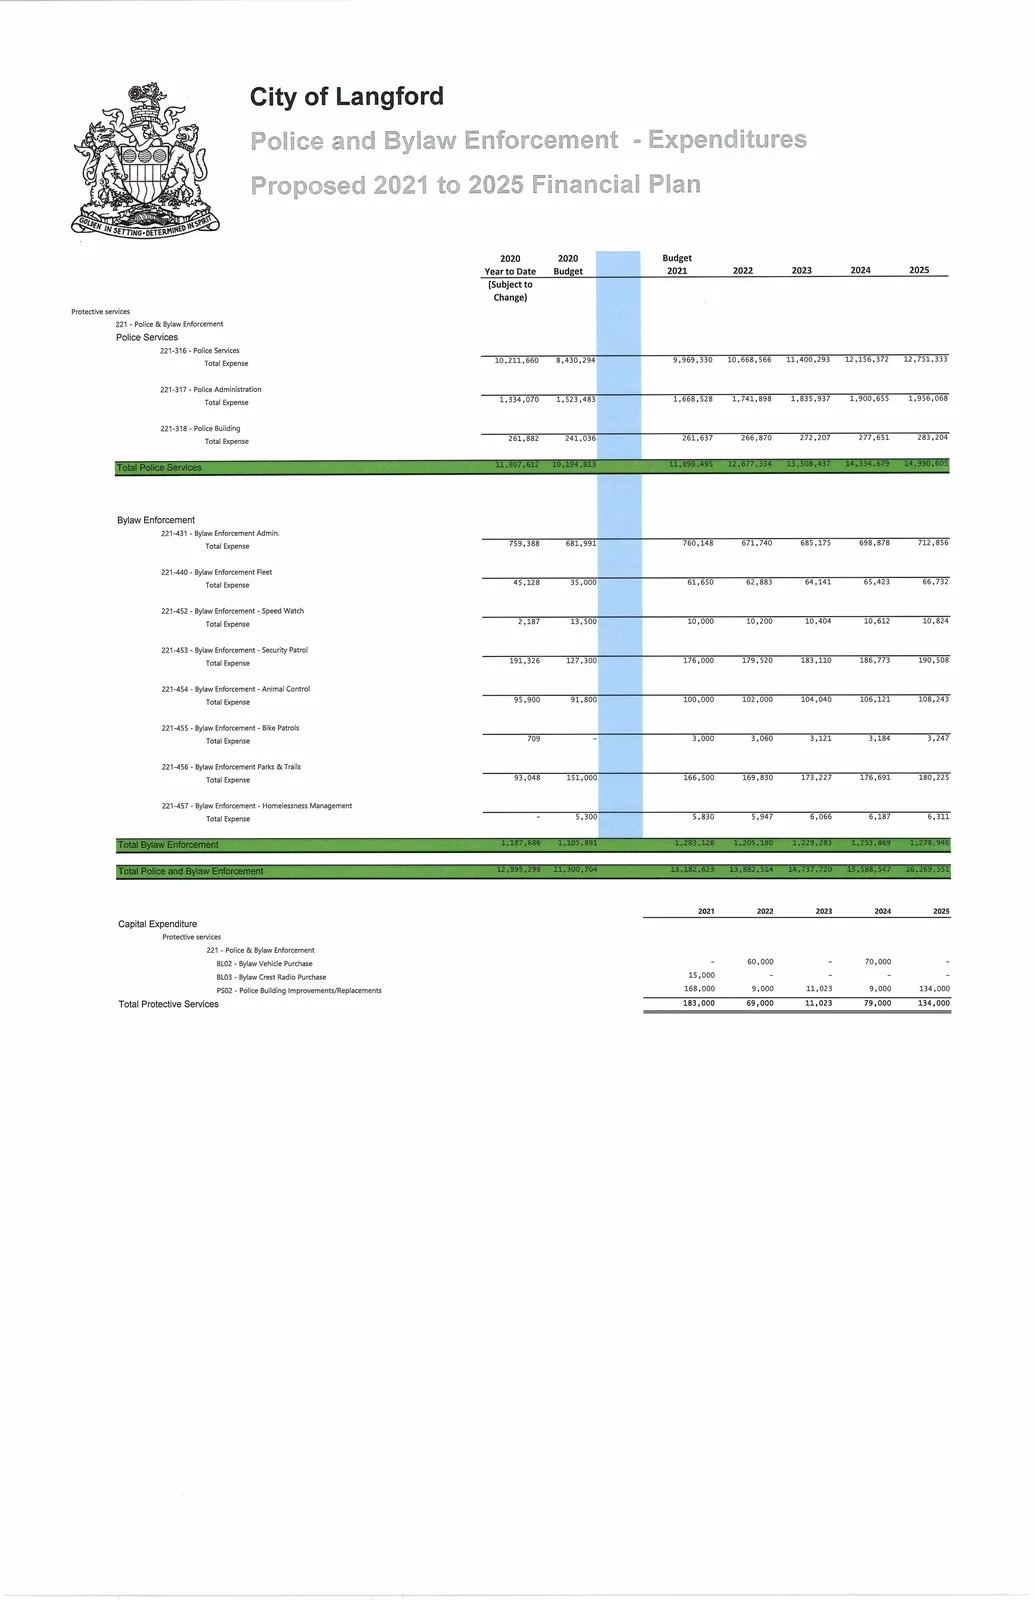
Police & Bylaw Enforcement (Total Police and Bylaw Enforcement combined)
- 2020 Actual: 11,807,612
- 2020 Budget: 10,194,813
- 2021: 11,899,495
- 2022: 12,677,334
- 2023: 13,508,437
- 2024: 14,334,679
- 2025: 14,990,605
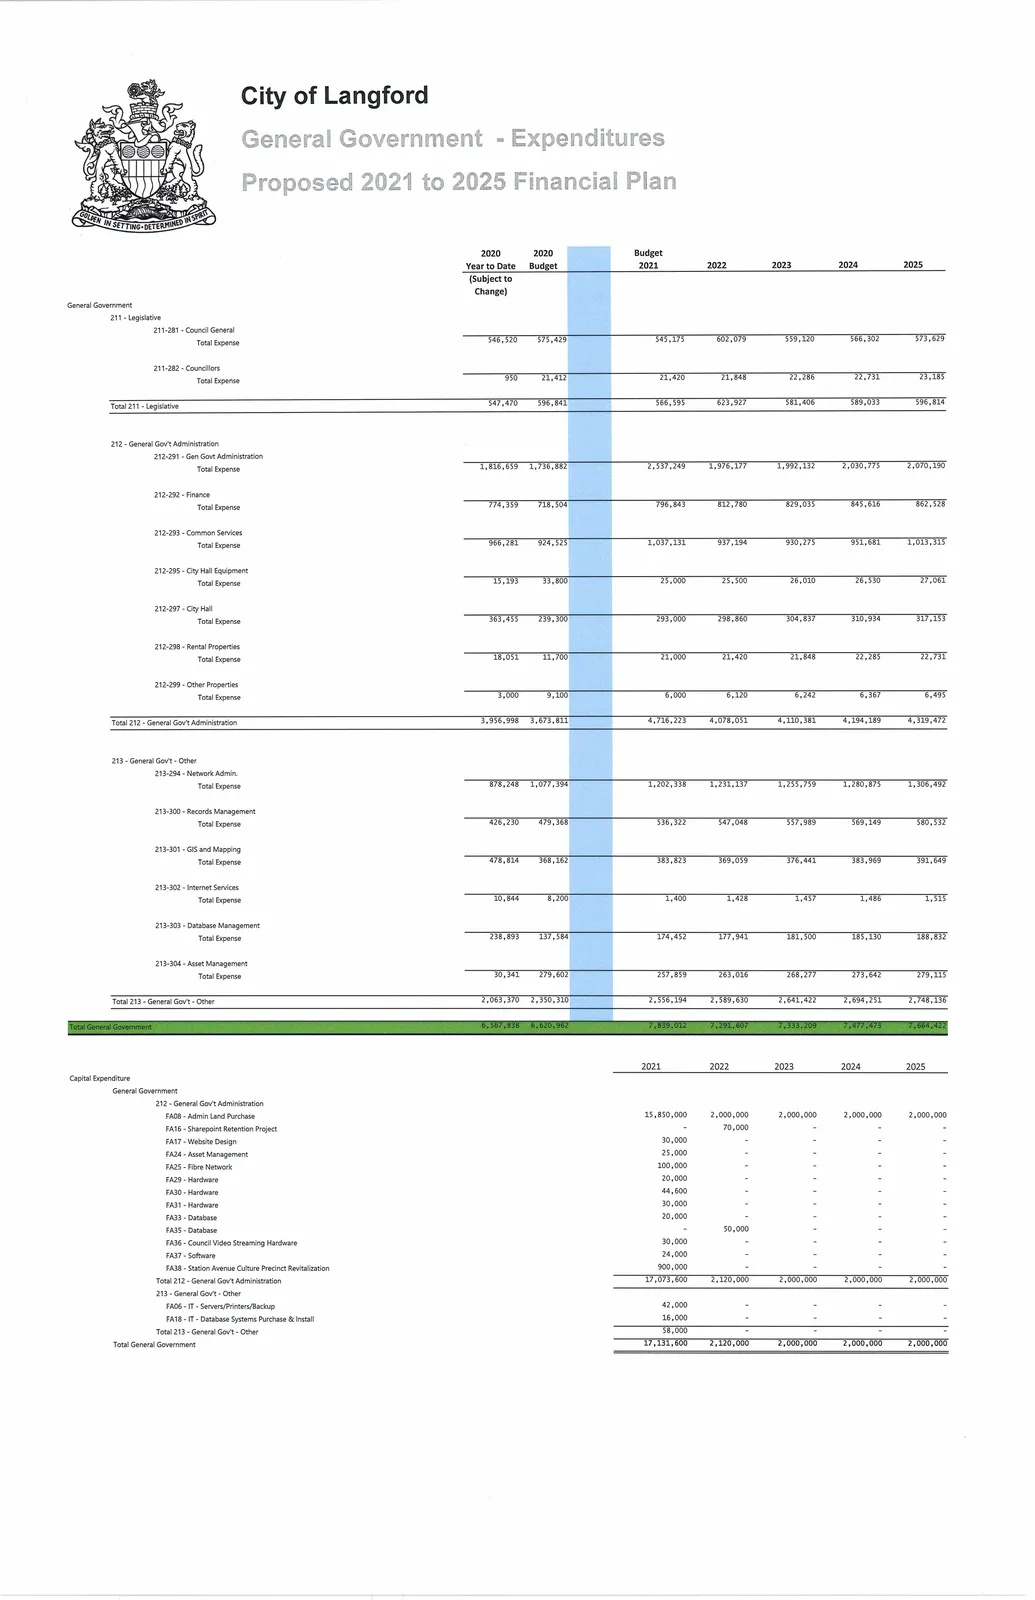
General Government (Total General Government)
- 2020 Actual: 7,839,012
- 2020 Budget: 7,291,607
- 2021: 7,333,209
- 2022: 7,477,473
- 2023: 7,664,422
- 2024: (see Capital Expenditure schedule)
- 2025: (see Capital Expenditure schedule)
(For full line-by-line departmental budgets and staffing/cost breakdowns, refer to the detailed schedules in the plan.)
Capital Budget (Selected Projects & Funding)
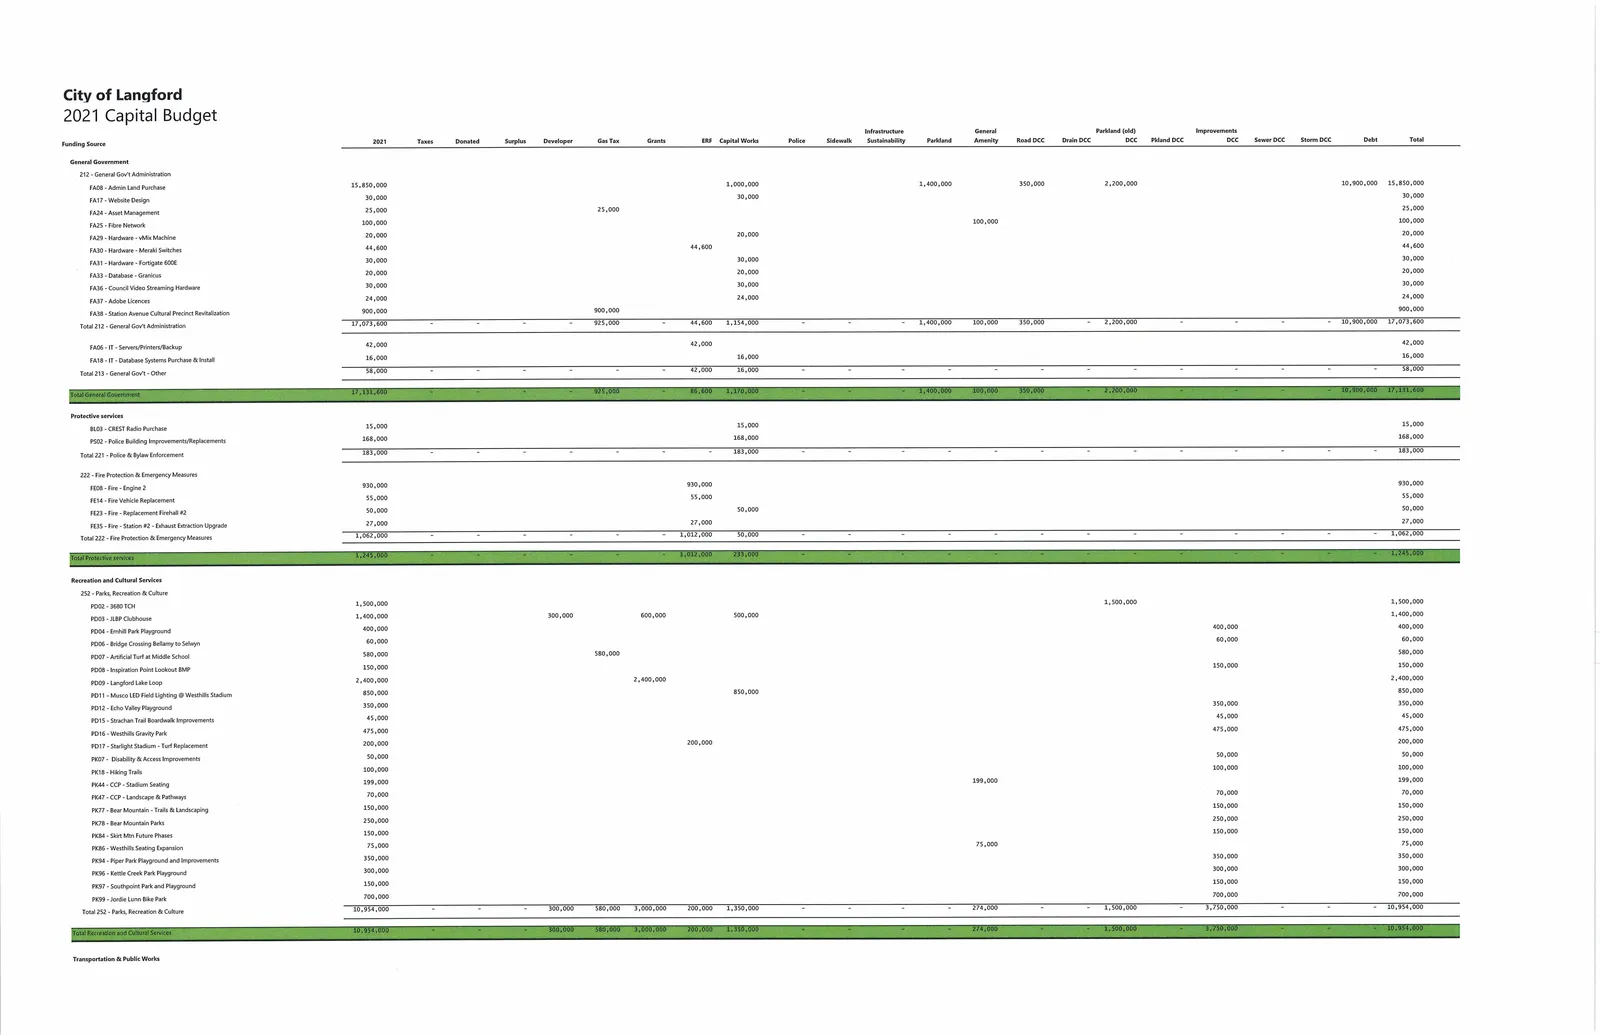
2021 Capital Budget — Selected Projects (by department)
(Full project listing and amounts as shown in the Capital program schedules.)
- Recreation and Cultural Services (252 - Parks, Recreation & Culture) — Selected 2021 projects and amounts:
- P002 - 3680 TCH: 1,500,000
- PD03 - ILBP Clubhouse: 1,400,000
- PD04 - Ernhill Park Playground: 400,000
- P006 - Bridge Crossing Bellamy to Selwyn: 60,000
- P007 - Artificial Turf at Middle School: 580,000
- P009 - Langford Lake Loop: 2,400,000
- P011 - Musco LED Field Lighting @ Westhills Stadium: 850,000
- P012 - Echo Valley Playground: 350,000
- PK99 - Jordie Lunn Bike Park: 700,000
- PK01 - Parkland Acquisition: (funding in future years)
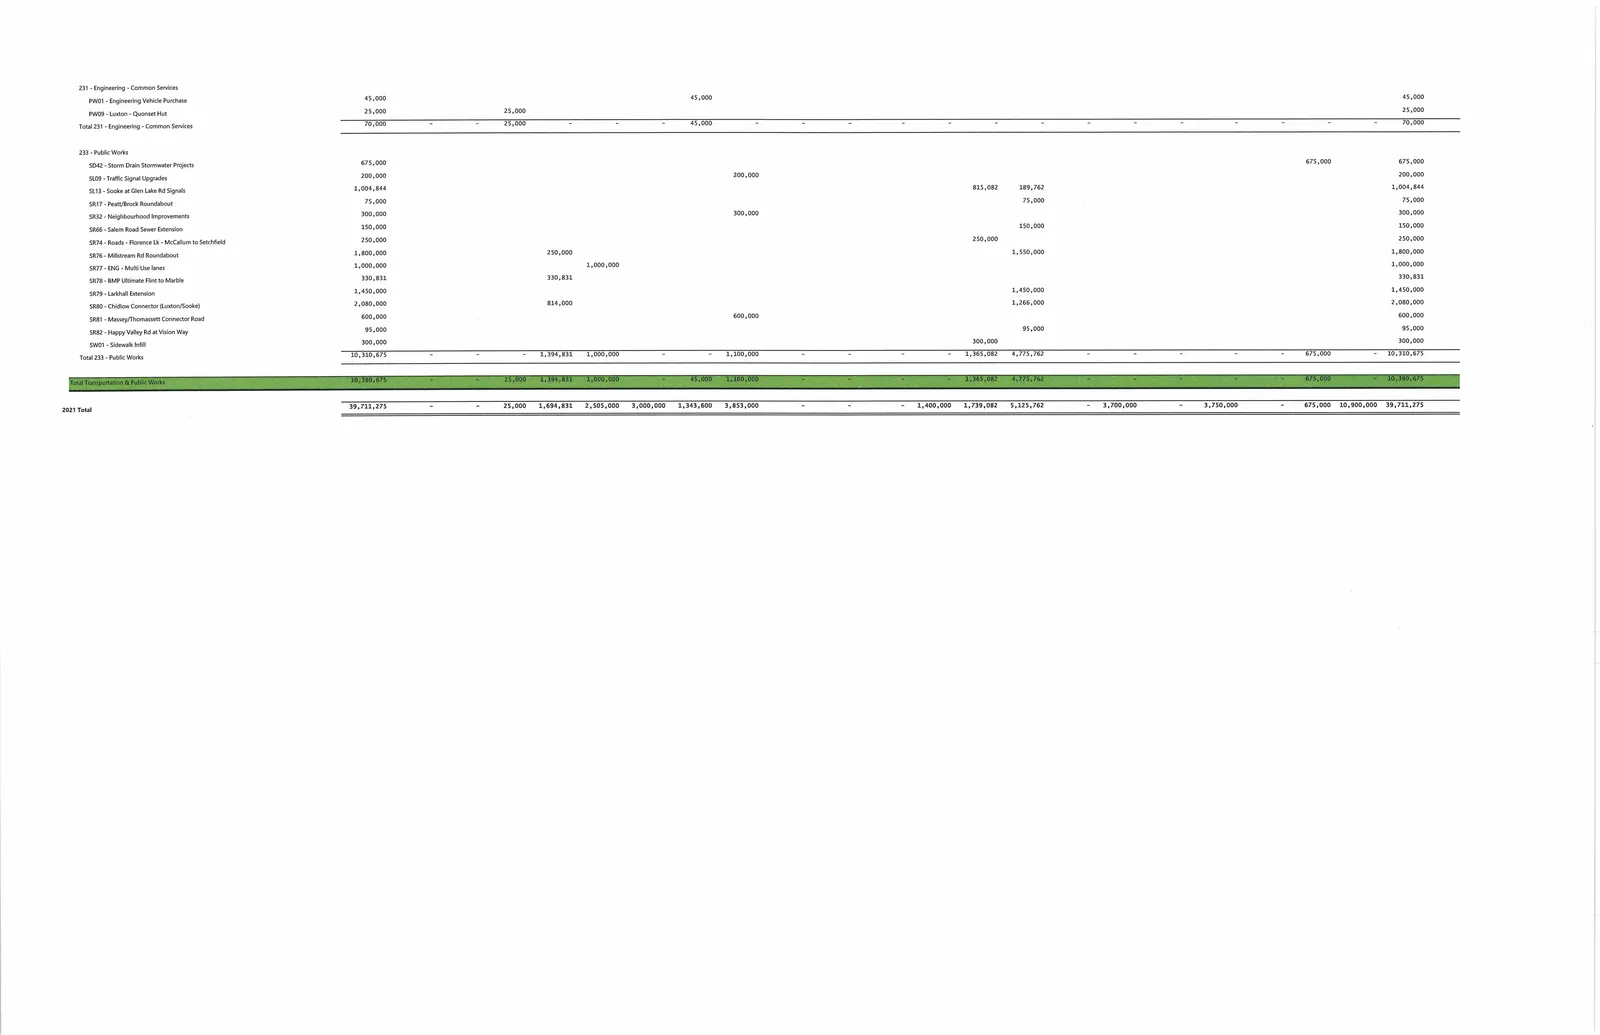
- Transportation & Public Works (selected 2021 projects)
- PW01 - Engineering Vehicle Purchase: 45,000
- PW09 - Luxton - Quonset Hut: 25,000
- 5D42 - Storm Drain Stormwater Projects: 675,000
- 5109 - Traffic Signal Upgrades: 200,000
- 5113 - Sooke at Glen Lake Rd Signals: 1,004,844
- SR17 - Peatt/Brock Roundabout: 75,000
- SR76 - Millstream Rd Roundabout (51176): 1,800,000
- 5R80 - Chidlow Connector (Luxton/Sooke): 2,080,000
- SW01 - Sidewalk Infill: 300,000
- General Government (selected 2021 projects)
- FA08 - Admin Land Purchase: 15,850,000
- FA17 - Website Design: 30,000
- FA24 - Asset Management: 25,000
- FA25 - Fibre Network: 100,000
- FA36 - Council Video Streaming Hardware: 30,000
- FA38 - Station Avenue Cultural Precinct Revitalization: 900,000
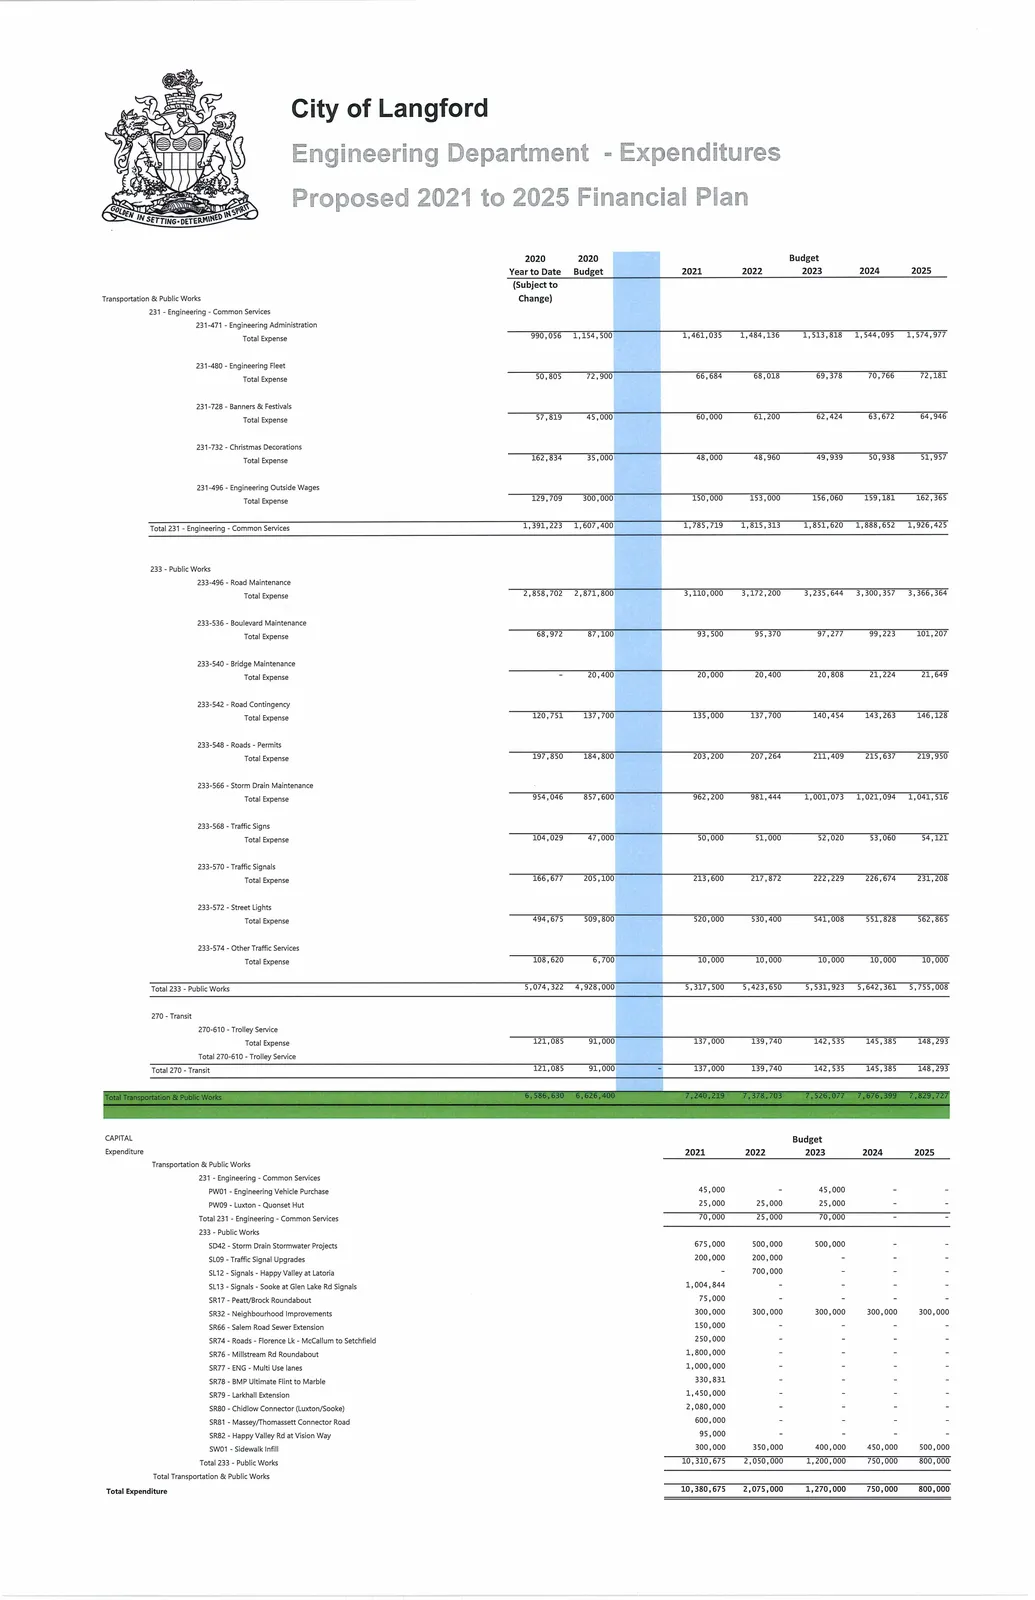
- Protective Services (selected 2021 projects)
- FE08 - Fire - Engine 2: 930,000
- FE14 - Fire Vehicle Replacement: 55,000
- PS02 - Police Building Improvements/Replacements: 168,000
- B103 - CREST Radio Purchase: 15,000
2021 Capital Budget — Funding summary (selected)
- Total 2021 Capital Expenditure (per capital program summary): 39,711,275
- (see funding source breakdown for major sources such as reserve funds, developer contributions, gas tax, grants, short-term debt, etc.)
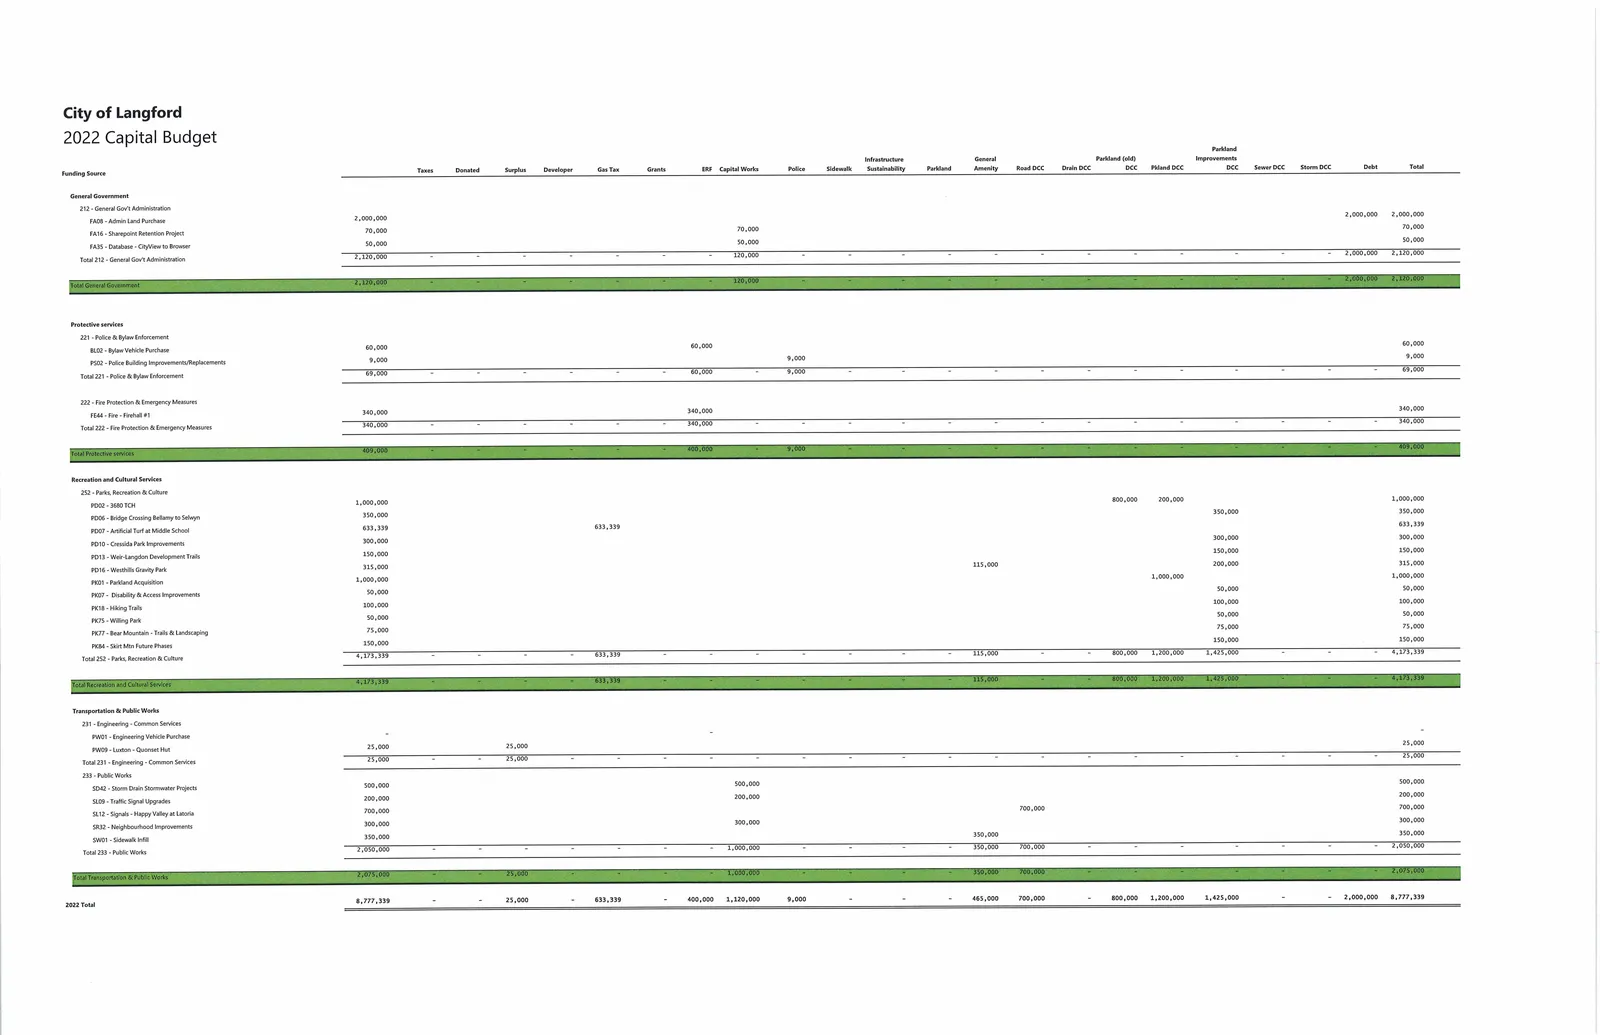
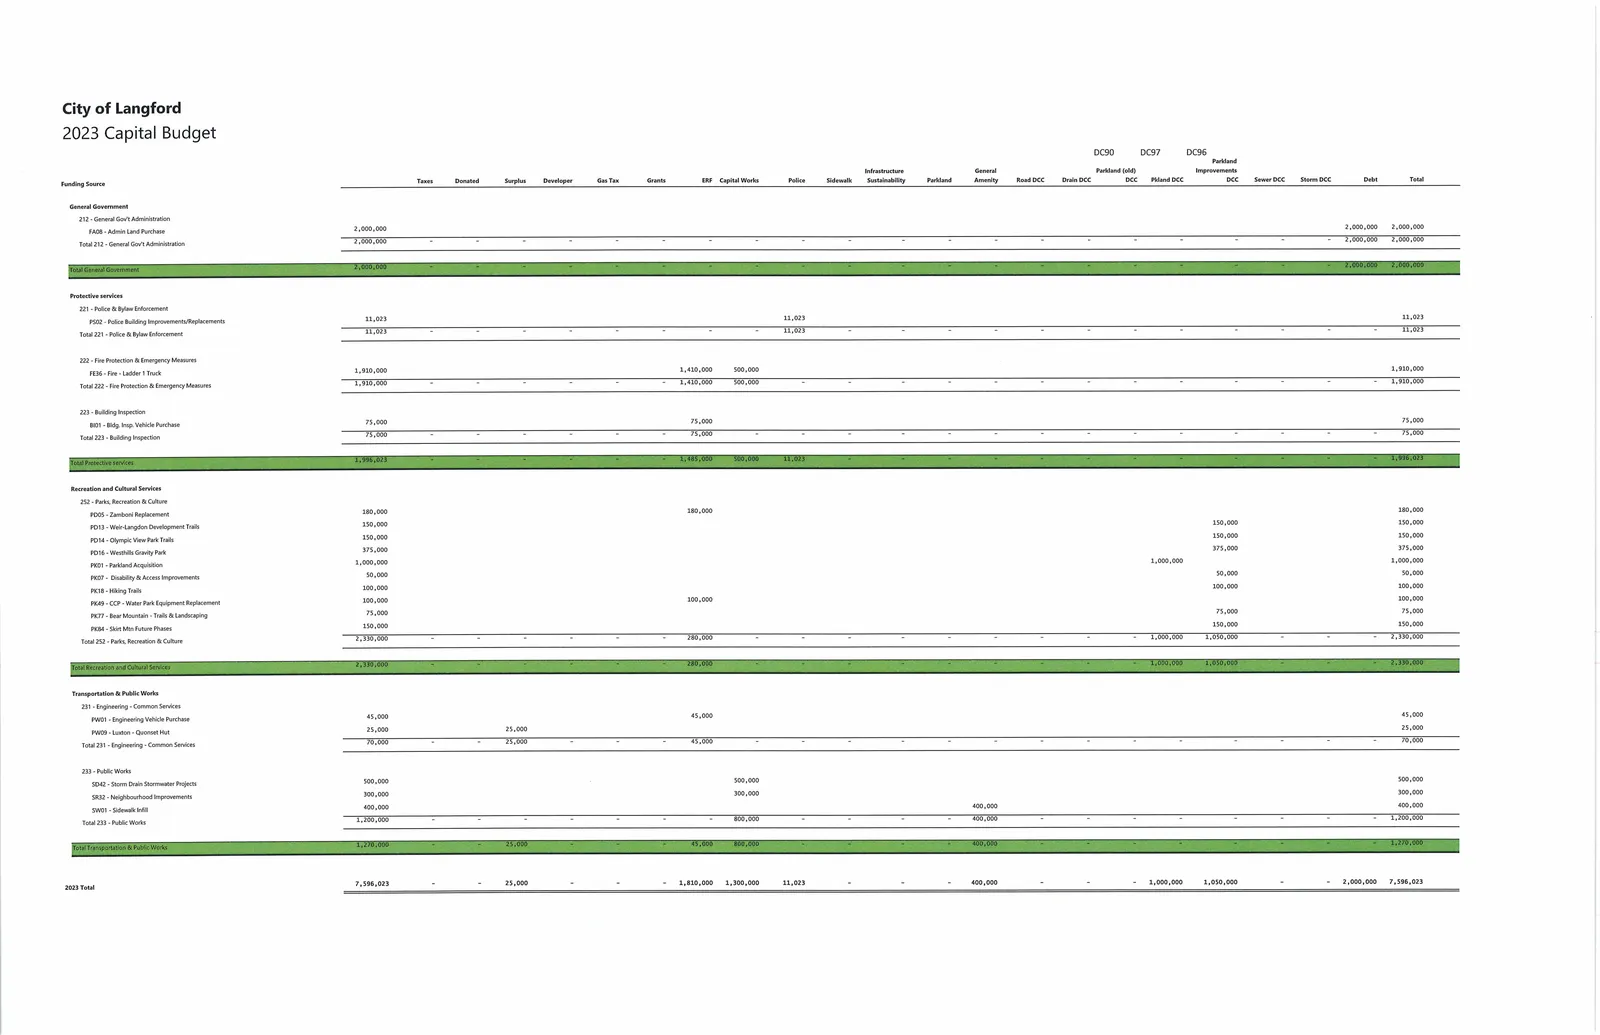
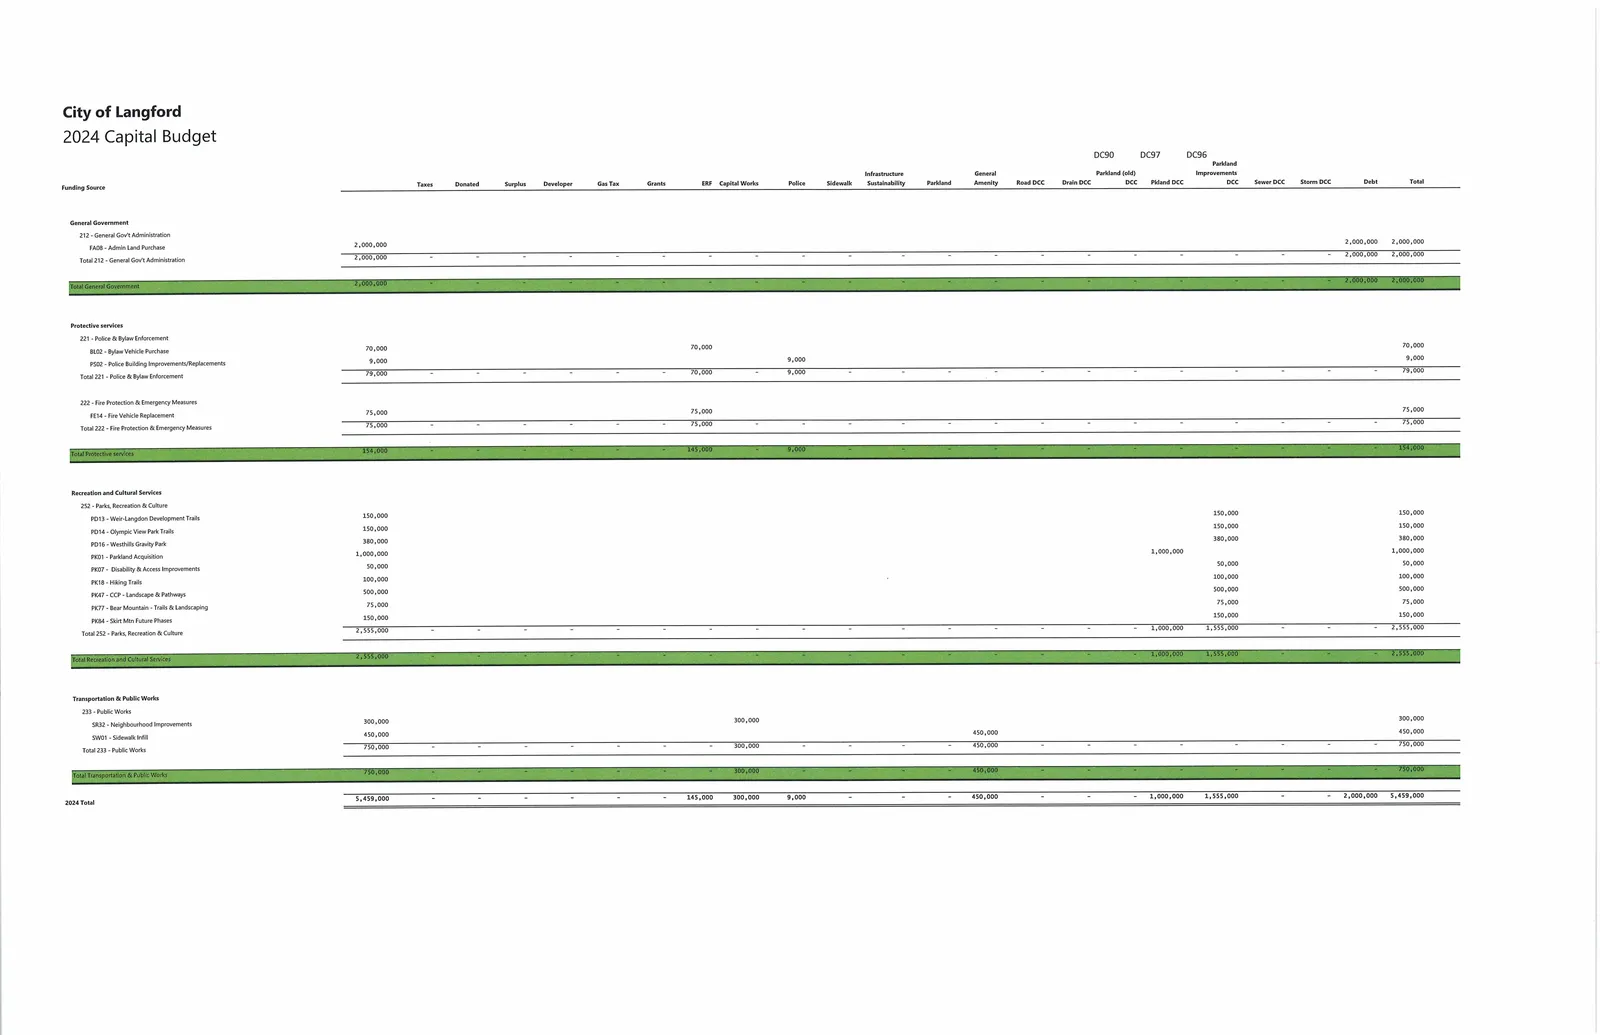
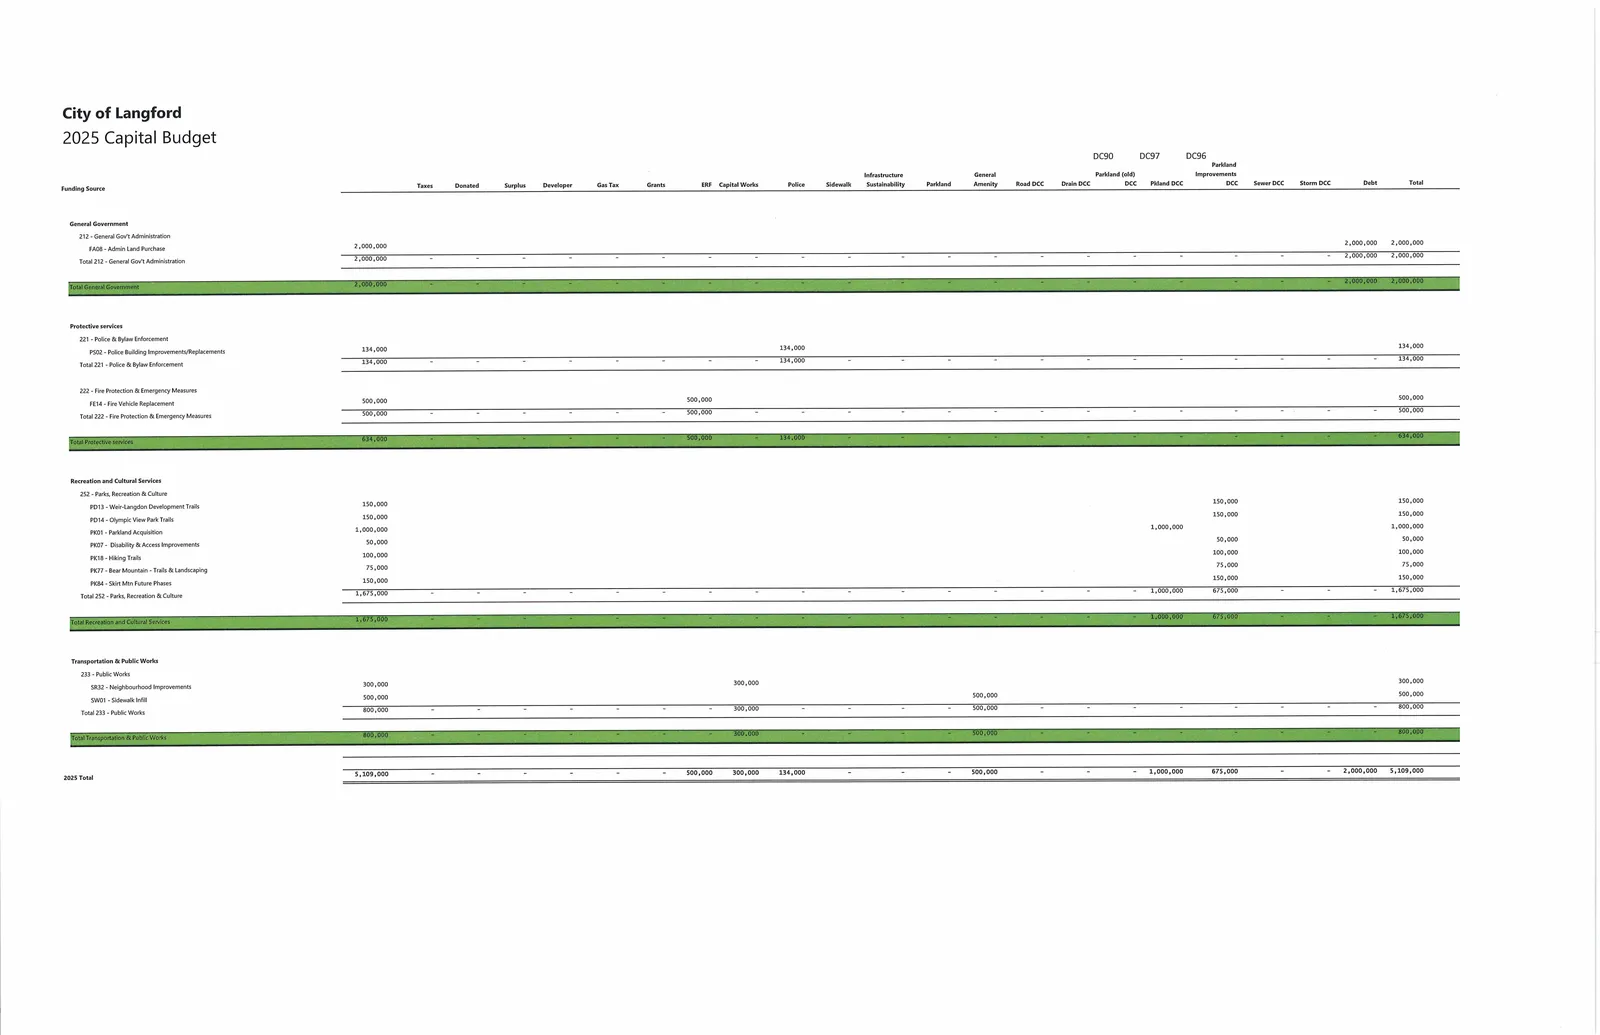
Annual Capital Totals (from extracted schedules)
| Year | Capital Total |
|---|---|
| 2021 | 39,711,275 |
| 2022 | 6,777,339 |
| 2023 | 7,596,023 |
| 2024 | 5,459,000 |
| 2025 | 5,109,000 |
(Annual totals are aggregated from the department capital programs and funding schedules.)
Departmental Capital Schedules and Funding Sources
Options (staff recommendations)
- That Council approve the 2021 – 2025 Five Year Financial Plan and direct staff to bring forward the Five Year Financial Plan Bylaw, 2021 and the 2021 Tax Rate Bylaw;
OR
- That Council direct staff to bring back a revised version of the 2021 – 2025 Five Year Financial Plan with the following amendments:
a. ___________________
b. ___________________
(Options preserved verbatim.)
Respectfully Submitted
Submitted by:
Michael Dillabaugh, CPA, CA, Director of Finance
Concurrence:
Marie Watmough, Manager of Legislative Services
Matthew Baldwin, MCIP, RPP Director of Planning
Cory Manton, Manager of Parks and Recreation
Michelle Mahovlich, P.Eng, P.Geo, Director of Engineering
Braden Hutchins, Director of Corporate Services
Darren Kiedyk, Chief Administrative Officer
Appendix: Extracted Financial Schedules and Reserve Fund Impacts
Revenues — Total Revenues (selected row reproduced)
Total Revenues
Actual 2020: 57,409,141
Budget 2020: 52,636,533
2021: 57,305,233
2022: 57,776,269
2023: 59,499,334
2024: 61,681,129
2025: 63,608,961
Departmental Totals (selected lines; numeric series from the schedules)
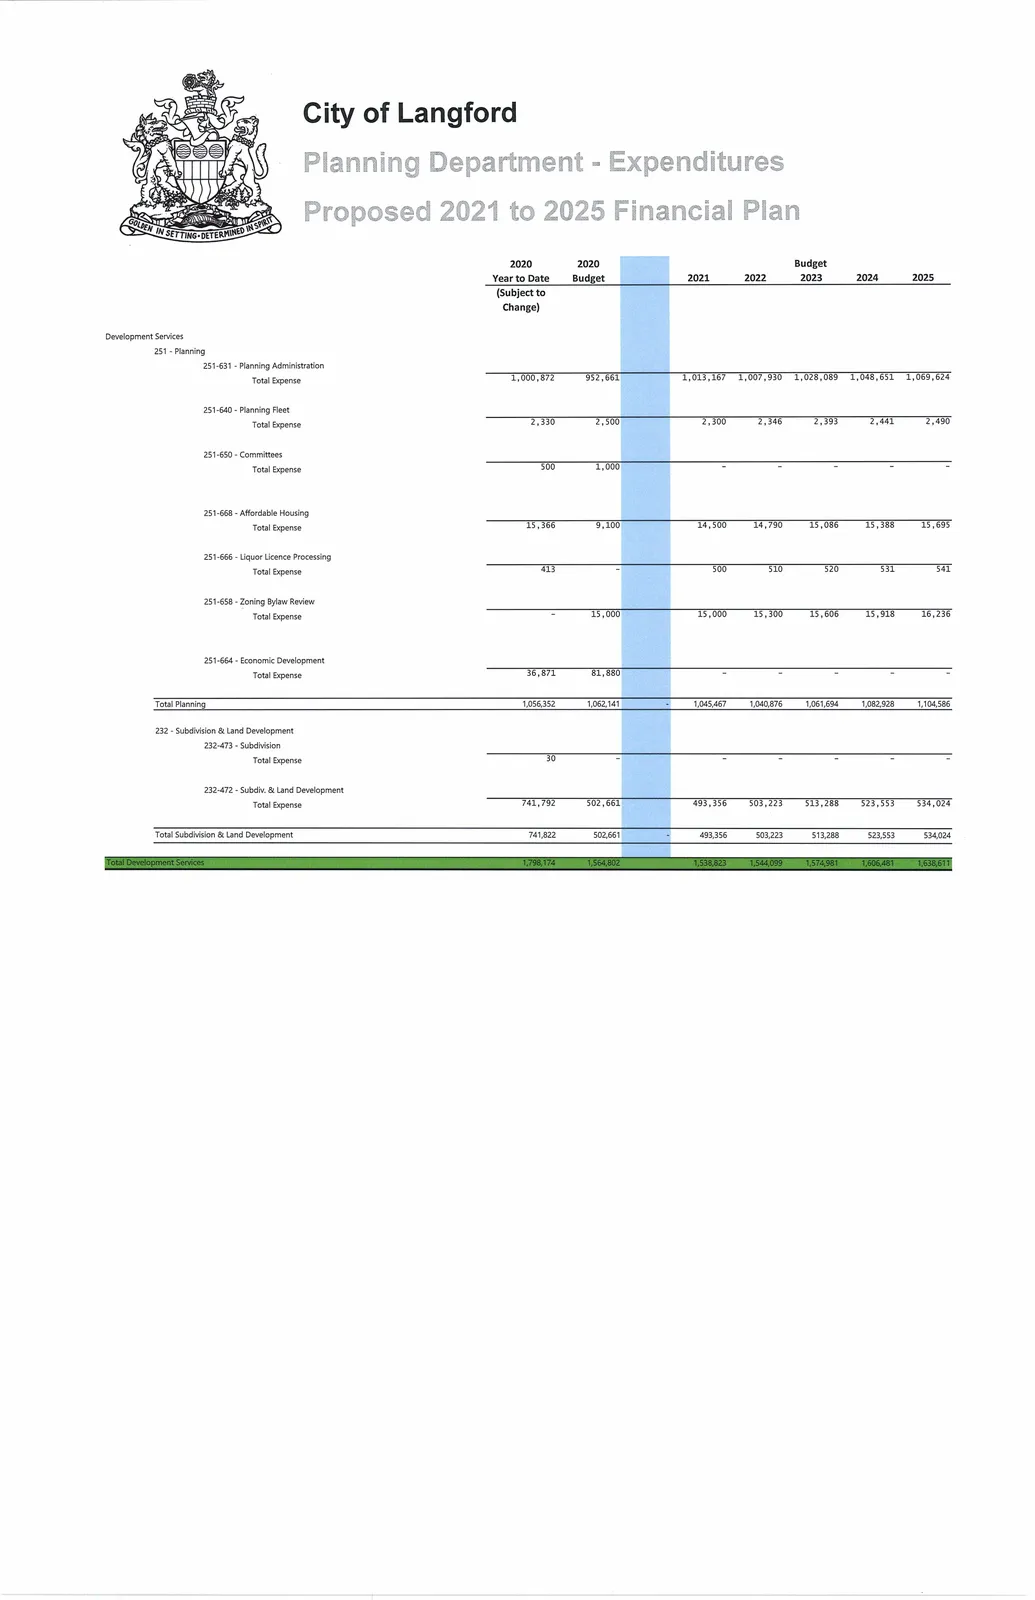
Planning (Total Planning)
Actual 2020: 1,056,352
Budget 2020: 1,062,141
2021: 1,045,467
2022: 1,040,876
2023: 1,061,694
2024: 1,082,928
2025: 1,104,586

Subdivision & Land Development (Total)
Actual 2020: 741,822
Budget 2020: 502,661
2021: 493,356
2022: 503,223
2023: 513,288
2024: 523,553
2025: 534,024

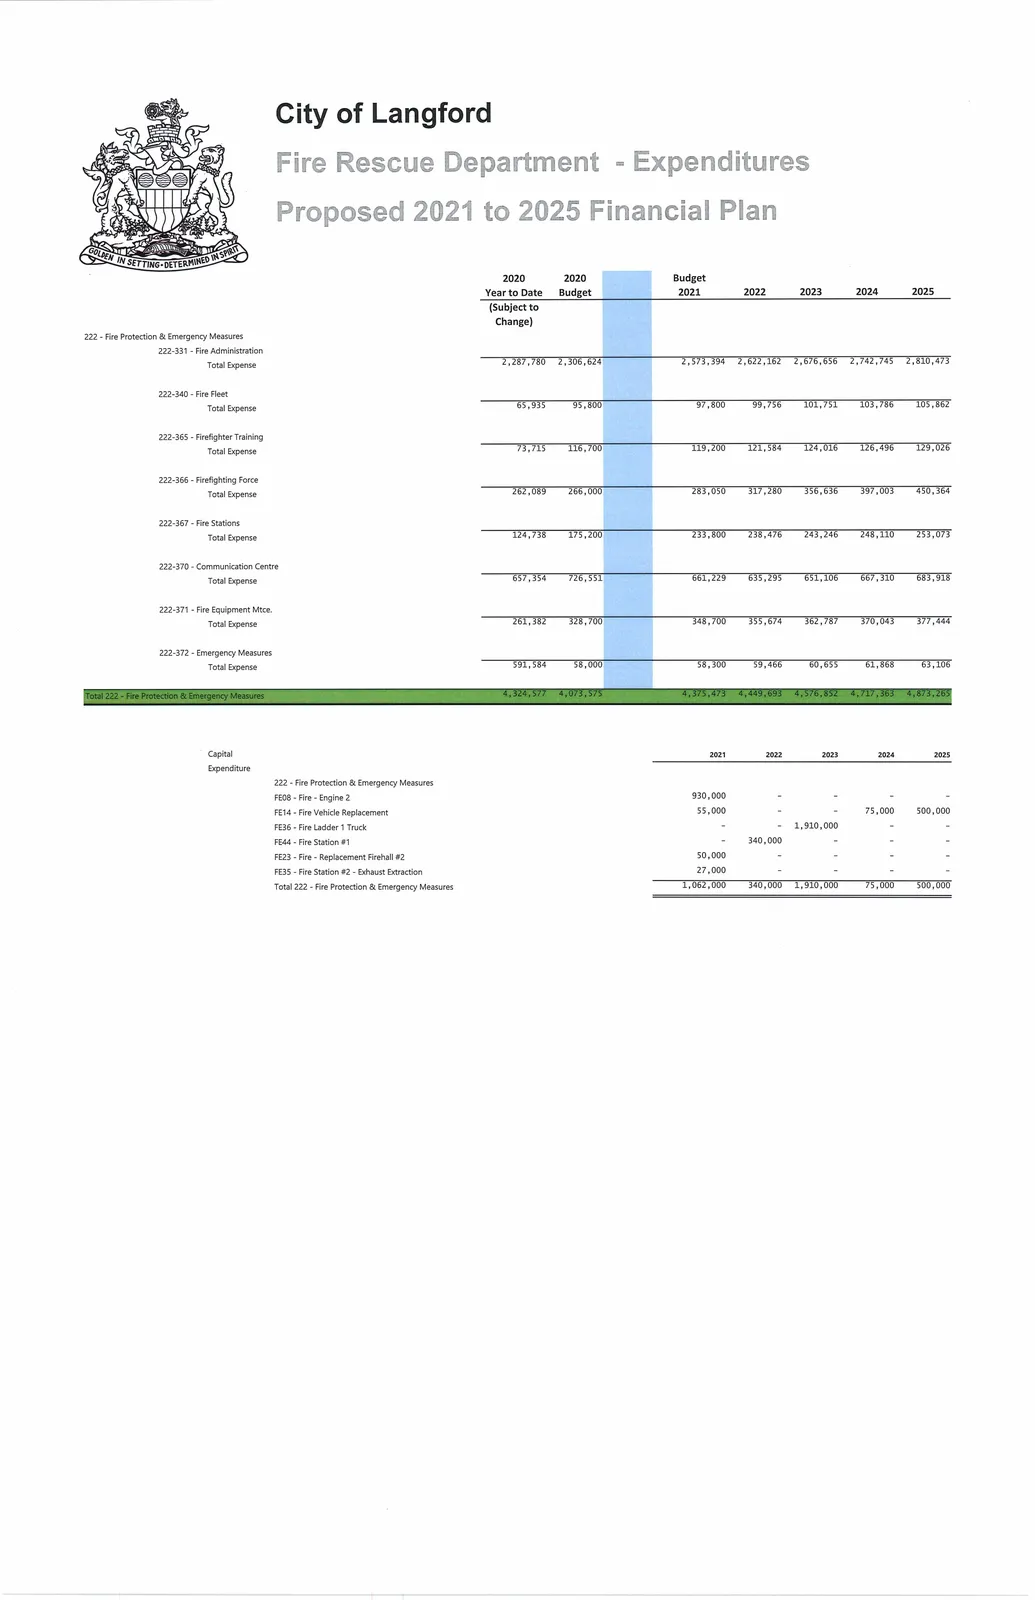
Building Inspection (Total)
Actual 2020: 729,570
Budget 2020: 836,281
2021: 876,686
2022: 873,820
2023: 891,296
2024: 909,122
2025: 927,304

Parks, Recreation & Culture (Total)
Actual 2020: 10,901,124
Budget 2020: 12,282,617
2021: 12,932,396
2022: 13,183,277
2023: 13,395,812
2024: 13,663,578
2025: 13,936,699

Westshore Parks & Recreation (Total)
Actual 2020: 2,668,592
Budget 2020: 2,668,592
2021: 3,397,472
2022: 2,940,332
2023: 3,013,841
2024: 3,089,187
2025: 3,166,416

Recreation Purchase of Service (Total)
Actual 2020: 950,000
Budget 2020: 950,000
2021–2025: 950,000 (each year)
Engineering - Common Services (Total)
Actual 2020: 1,391,223
Budget 2020: 1,607,400
2021: 1,785,719
2022: 1,815,313
2023: 1,851,620
2024: 1,888,652
2025: 1,926,425

Public Works (Total)
Actual 2020: 5,074,322
Budget 2020: 4,928,000
2021: 5,317,500
2022: 5,423,650
2023: 5,531,923
2024: 5,642,361
2025: 5,755,008

Transit - Trolley Service (Total)
Actual 2020: 121,085
Budget 2020: 91,000
2021: 137,000
2022: 139,740
2023: 142,535
2024: 145,385
2025: 148,293
Fire Protection & Emergency Measures (selected totals)
Fire Administration & related lines show increases for 2021–2025 to support staffing and equipment.
Select capital items for Fire in 2021 include:
FE08 - Fire - Engine 2: 930,000
FE14 - Fire Vehicle Replacement: 55,000
FE23 - Fire - Replacement Firehall #2: 50,000
FE35 - Fire Station #2 - Exhaust Extraction: 27,000
Police Services
Actual 2020: 10,211,660
Budget 2020: 8,430,294
2021: 9,969,330
2022: 10,668,566
2023: 11,400,293
2024: 12,156,372
2025: 12,751,333

Bylaw Enforcement (selected lines)
Actual 2020: 1,334,070
Budget 2020: 1,523,483
2021: 1,668,528
2022: 1,741,898
2023: 1,835,937
2024: 1,900,655
2025: 1,956,068

Total Police and Bylaw Enforcement (combined)
Actual 2020: 11,807,612
Budget 2020: 10,194,813
2021: 11,899,495
2022: 12,677,334
2023: 13,508,437
2024: 14,334,679
2025: 14,990,605
General Government (selected totals)
Legislative (Total)
Actual 2020: 547,470
Budget 2020: 596,841
2021: 566,595
2022: 623,927
2023: 581,406
2024: 589,033
2025: 596,814

General Gov't Administration (Total)
Actual 2020: 3,956,998
Budget 2020: 3,673,811
2021: 4,716,223
2022: 4,078,051
2023: 4,110,381
2024: 4,194,189
2025: 4,319,472

General Gov't - Other (Total)
Actual 2020: 2,063,370
Budget 2020: 2,350,310
2021: 2,556,194
2022: 2,589,630
2023: 2,641,422
2024: 2,694,251
2025: 2,748,136

Total General Government (combined)
Actual 2020: 7,839,012
Budget 2020: 7,291,607
2021: 7,333,209
2022: 7,477,473
2023: 7,664,422
2024: (See Capital)
2025: (See Capital)
2021–2025 Capital Budgets (detailed funding tables available in the Plan)
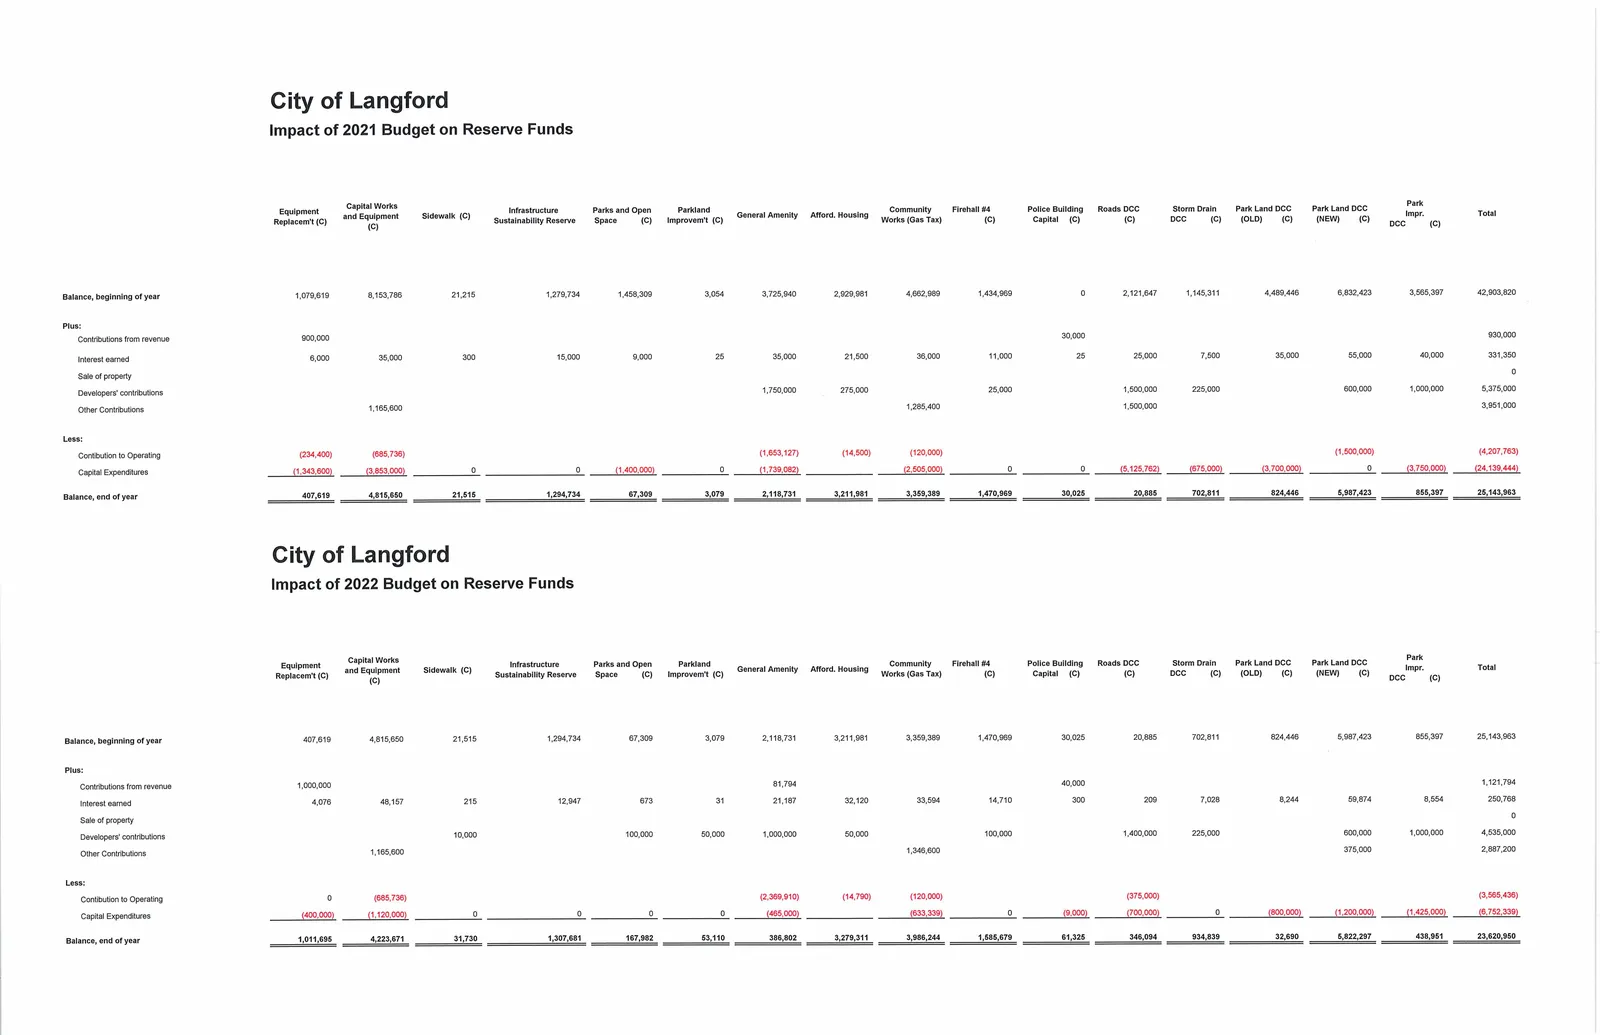
Reserve Fund Impacts — Year-end Balances (Summary)
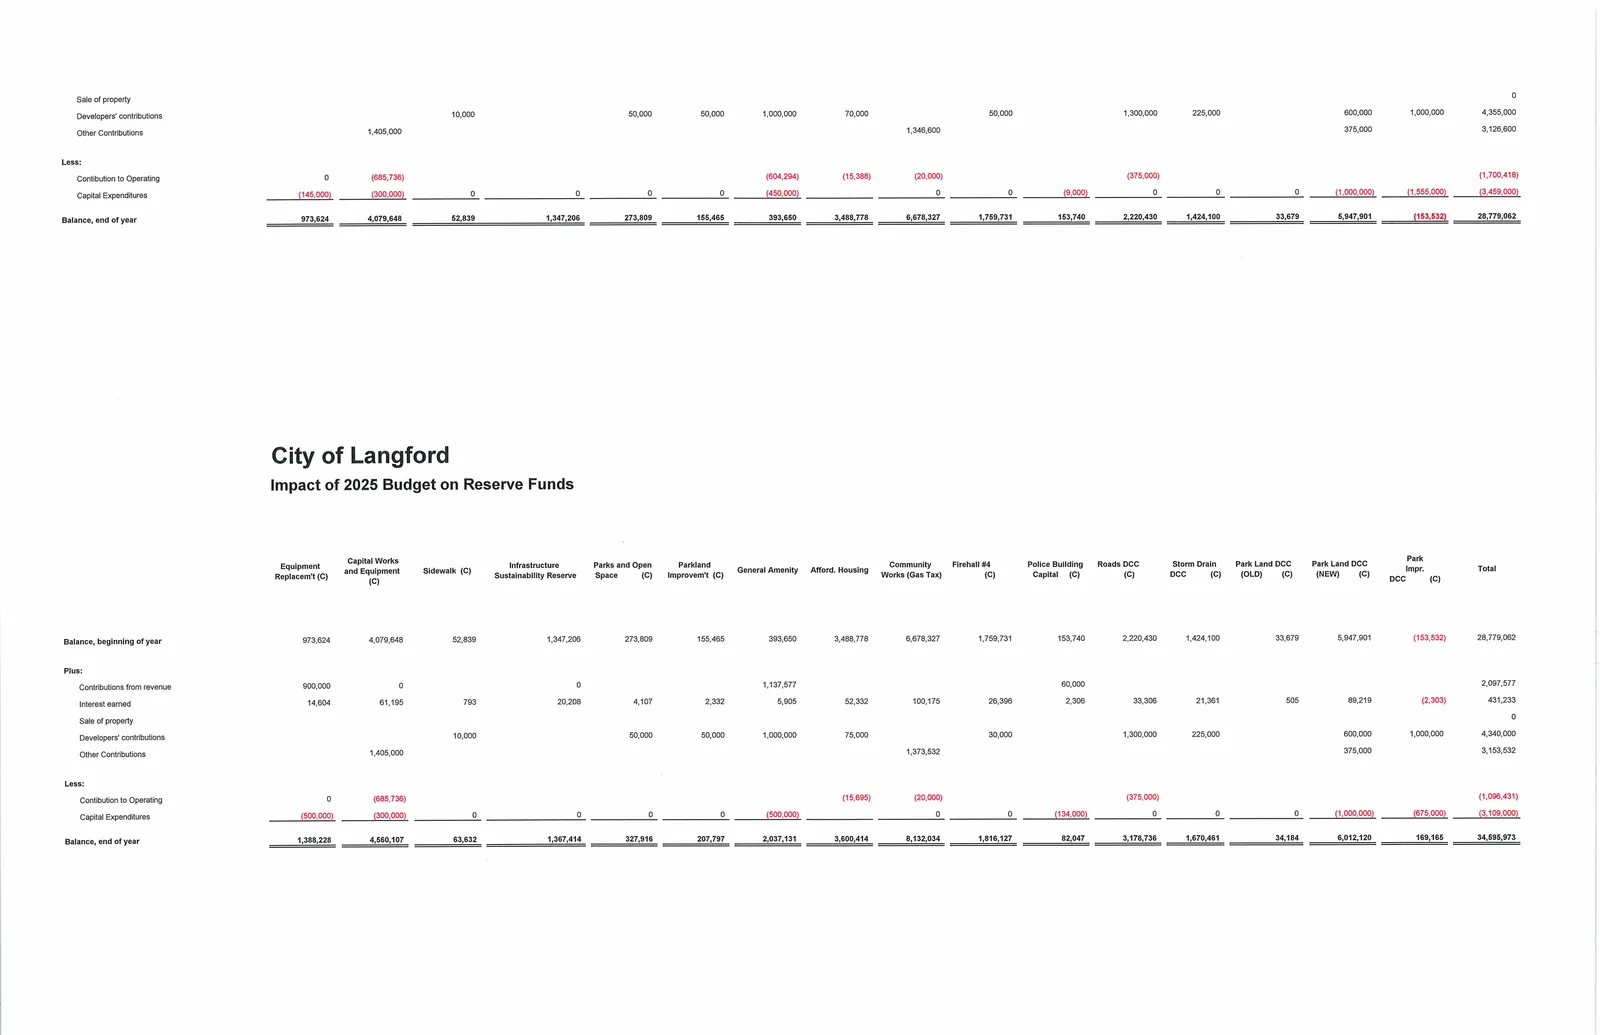
(Impact of the Plan on Reserves — end-of-year balances extracted from the schedules.)
| Reserve / Year | End of Year 2021 Total | End of Year 2022 Total | End of Year 2023 Total | End of Year 2024 Total | End of Year 2025 Total |
|---|---|---|---|---|---|
| Total (all reserves aggregated) | 25,143,963 | 23,620,950 | 24,665,566 | 28,779,062 | 34,595,973 |
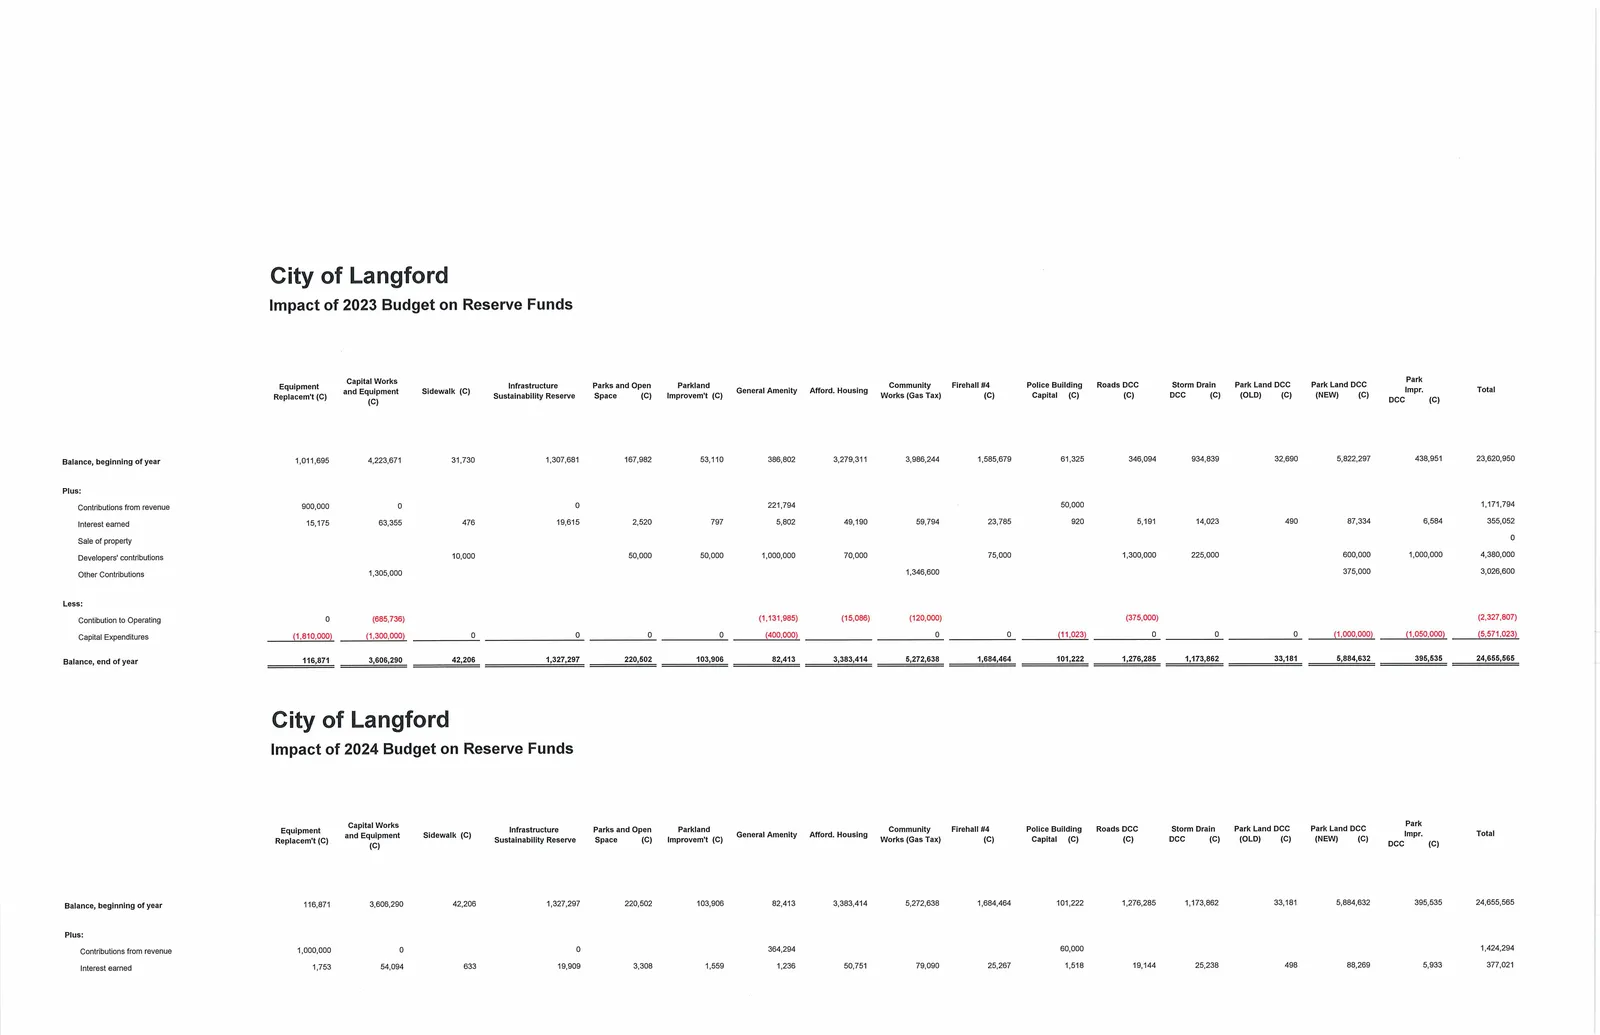
(Selected reserve fund end-of-year totals were taken from the extracted "Balance, end of year" rows in the reserve schedules for each plan year. Individual reserve balances for categories such as Capital Works, Equipment Replacement, Sidewalk, Infrastructure Works (Gas Tax), Sustainability Reserve, Parkland, Community Space, Police Building Capital, Roads DCC, Storm Drain DCC, Park Land DCC (old/new) and others are shown in the full schedule.)
End of extracted pages 83–106 (2021 - 2025 Five-Year Financial Plan Approval).