DocumentsCorrespondenceFeb 19, 2019Pages 46–55
Correspondence: Greater Victoria Public Library - 2019 Budget and Five-Year Financial Plan
Letter from GVPL (Maureen Sawa, CEO) submitting the 2019 Operating Budget and Five-Year Financial Plan (2019-2023) and requesting municipal approval; includes budget highlights and municipal requisition breakdowns.
Key facts
- Date of letter: October 31, 2018 (submitted to Mayor & Council)
- Requested municipal contribution increase for 2019: 2.25%
- City of Langford 2019 requisition/share: $1,862,234 (Langford share shown and includes rent adjustment)
- GVPL 2019 operating budget (total): $18,727,639; Total Municipal Contribution (2019): $17,400,121
- Cost per capita (2019): $53.08; various budget line items, revenue and capital schedules included
Greater Victoria Public Library — Letter to Mayor and Council
October 31, 2018
Mayor and Council
City of Langford
877 Goldstream Avenue
Langford, BC V9B 2X8
Dear Mayor and Council:
Re: Greater Victoria Public Library 2019 Budget and Five-Year Financial Plan
On behalf of the Board, I am pleased to submit Greater Victoria Public Library’s 2019 Operating Budget and Five-Year Financial Plan for 2019-2023. As per the terms of the Library Operating Agreement, approval by council resolution is required by May 1, 2019.
The overall municipal contribution increase requested for 2019 is 2.25%. The City of Langford’s share of the 2019 requisition is $1,862,234 which is based on converted assessment values and population of your municipality, including rental adjustment. Building maintenance costs budgeted to be paid on your behalf are an additional $58,688.
Budget drivers include salaries and benefits, building occupancy costs and other factors, which are described in the 2019 budget notes.
Now more than ever, public libraries are essential partners in building smart, sustainable and successful communities.
The Greater Victoria Public Library continues to rank as one of the highest circulation per capita public library systems in Canada (i.e. community members borrow more items, per capita, compared to other large Canadian library systems) and consistently delivers exemplary services, programs and collections.
We provide community-inspired service at twelve library branches and online at gvpl.ca, serving 327,797 residents in our 10 member municipalities. Through the power of partnerships, the Greater Victoria Public Library is a place where doors…and minds…are always open.
Thank you for your ongoing support of the role public libraries play in building strong and vibrant communities.
Sincerely,
Maureen Sawa, CEO, Greater Victoria Public Library
Enclosures
Copies: Darren Kiedyk, CAO, City of Langford; Michael Dillabaugh, Director of Finance, City of Langford; Rob Martin, Chair, Greater Victoria Public Library Board; Paul McKinnon, Director, Finance & Facilities, Greater Victoria Public Library
2019 Final Budget and 2019-2023 Five Year Financial Plan
Approval Dates
- Finance Committee – August 21, 2018
- Finance Committee – September 18, 2018
- GVPL Board – October 16, 2018
Budget at a Glance
| 2019 | 2018 | |
|---|---|---|
| Operating Budget¹ | $18,727,639 | $18,285,077 |
| Operating Budget Increase | 3.67% | 2.37% |
| Capital Budget | $2,070,067 | $2,167,637 |
| Capital Budget Increase (Decrease) | -4.50% | -7.79% |
| Total Budget - Funded² | $19,275,506 | $18,764,414 |
| Total Budget Increase | 2.72% | 1.08% |
| Municipal Contribution - Total | $17,400,121 | $17,017,338 |
| Municipal Contribution - Increase | $382,783 | $478,939 |
| Municipal Contribution - Increase (%) | 2.25% | 2.90% |
| Cost per Capita | $53.08 | $51.52 |
| Cost per Capita Increase | $1.17 | $1.49 |
Notes:
1 – Operating budget consists of operating expenses only
2 – Total budget funded is equal to Expenses (Operating budget) less amortization (non-funded expense) + capital budget
Note to Budget Increase:
The operating budget increase is higher than the municipal contribution increase as there are specific one-time costs within the 2019 budget that are being offset through the use of accumulated surplus. Therefore there are no direct impacts related to these costs to the municipal contribution total. These one-time costs include items such as project related ITS Hardware replacement costs, organizational leadership training, and organizational restructuring costs.
Revenues and Expenses (2018–2023)
| Item | 2018 | 2019 | Change | Change% | Notes | 2020 | 2021 | 2022 | 2023 |
|---|---|---|---|---|---|---|---|---|---|
| Revenues | |||||||||
| Municipal Contributions - Operating | 17,017,338 | 17,400,121 | 382,783 | 2.2% | 1 | 17,863,961 | 18,191,289 | 18,533,181 | 18,850,264 |
| Municipal Contributions - Start-up | 460,600 | 355,280 | (105,320) | -22.9% | 2 | 61,720 | - | - | - |
| Provincial Grants | 642,339 | 642,339 | - | 0.0% | 3 | 642,339 | 642,339 | 642,339 | 642,339 |
| Federal Grants | 7,379 | - | (7,379) | -100.0% | 4 | - | - | - | - |
| Fines, Fees and Printing | 502,191 | 476,816 | (25,375) | -5.1% | 5 | 459,342 | 442,939 | 427,544 | 413,096 |
| Contracts for Service | 28,450 | 28,450 | - | 0.0% | 6 | 28,450 | 28,450 | 28,450 | 28,450 |
| Investment Income | 74,000 | 74,000 | - | 0.0% | 7 | 74,000 | 74,000 | 74,000 | 74,000 |
| Donations and Other Grants | 49,300 | 42,000 | (7,300) | -14.8% | 8 | 42,000 | 42,000 | 42,000 | 42,000 |
| Total Revenues | 18,781,597 | 19,019,006 | 237,409 | 1.3% | 19,171,812 | 19,421,017 | 19,747,514 | 20,050,149 | |
| Expenses (Operating Budget) | |||||||||
| Salaries and Benefits | 13,491,583 | 14,006,477 | 514,894 | 3.8% | 9 | 14,182,382 | 14,465,484 | 14,754,035 | 15,048,569 |
| Library Materials | 903,000 | 862,000 | (41,000) | -4.5% | 10 | 862,000 | 862,000 | 862,000 | 862,000 |
| Amortization | 1,688,300 | 1,522,200 | (166,100) | -9.8% | 11 | 1,452,300 | 1,363,400 | 1,554,800 | 1,576,000 |
| Supplies and Services | 1,077,525 | 1,088,938 | 11,413 | 1.1% | 12 | 1,098,705 | 1,082,104 | 1,082,158 | 1,076,213 |
| Building Occupancy | 762,838 | 894,056 | 131,218 | 17.2% | 13 | 911,403 | 927,365 | 943,654 | 956,313 |
| Other Expenses | 361,831 | 353,968 | (7,863) | -2.2% | 14 | 356,119 | 344,177 | 345,781 | 347,165 |
| Total Expenses | 18,285,077 | 18,727,639 | 442,562 | 2.4% | 18,862,909 | 19,044,530 | 19,542,428 | 19,866,260 | |
| Annual Surplus/(Deficit) | 496,520 | 291,367 | (205,153) | -41.3% | 308,903 | 376,487 | 205,086 | 183,889 | |
| Add back: Unfunded Amortization | 1,688,300 | 1,522,200 | (166,100) | -9.8% | 11 | 1,452,300 | 1,363,400 | 1,554,800 | 1,576,000 |
| Total (Surplus + Amortization) | 2,184,820 | 1,813,567 | (371,253) | -17.0% | 1,761,203 | 1,739,887 | 1,759,886 | 1,759,889 | |
| Total Budget - Funded | 18,764,414 | 19,275,506 | 19,192,496 | 19,421,017 | 19,727,515 | 20,030,147 |
Municipal Contributions - Operating Increase (annual): 2018 = 2.9% ; 2019 = 2.25% ; 2020 = 2.67% ; 2021 = 1.83% ; 2022 = 1.88% ; 2023 = 1.71%
CONFIDENTIAL
Capital Expenses and Transfers (2018–2023)
| Item | 2018 | 2019 | Change | Notes | 2020 | 2021 | 2022 | 2023 |
|---|---|---|---|---|---|---|---|---|
| Balance forward from Page 1 | 2,184,820 | 1,813,567 | (371,253) | 1,761,203 | 1,739,887 | 1,759,886 | 1,759,889 | |
| Capital Expenses | ||||||||
| Library Materials - Operating | 1,459,887 | 1,459,887 | - | 10 | 1,459,887 | 1,459,887 | 1,459,887 | 1,459,887 |
| Hardware - Operating | 93,000 | 100,000 | 7,000 | 15 | 100,000 | 100,000 | 100,000 | 100,000 |
| Furniture and Equipment - Operating | 60,000 | 60,000 | - | 15 | 60,000 | 60,000 | 60,000 | 60,000 |
| Building Improvement - Operating | 120,000 | 120,000 | - | 15 | 120,000 | 120,000 | 120,000 | 120,000 |
| Branch Start-ups: | 2 | |||||||
| Library Materials - sxʷeŋxʷəŋ təŋəxʷ James Bay Branch | 74,250 | - | (74,250) | 2 | - | - | - | - |
| Library Materials - Esquimalt Branch | 10,000 | 8,000 | (2,000) | 2 | 2,000 | - | - | - |
| Hardware - sxʷeŋxʷəŋ təŋəxʷ James Bay Branch | - | - | - | 2 | - | - | - | - |
| Hardware - Esquimalt Branch Relocation | 66,000 | 66,000 | - | 2 | 10,000 | - | - | - |
| Furniture and Equipment - sxʷeŋxʷəŋ təŋəxʷ James Bay Branch | - | - | - | 2 | - | - | - | - |
| Furniture and Equipment - Esquimalt Branch Relocation | 284,500 | 256,180 | (28,320) | 2 | 30,000 | - | - | - |
| Building Improvement - sxʷeŋxʷəŋ təŋəxʷ James Bay Branch | - | - | - | - | - | - | - | - |
| Total Capital Expenses | 2,167,637 | 2,070,067 | (97,570) | 1,781,887 | 1,739,887 | 1,739,887 | 1,739,887 | |
| Transfers | 16 | |||||||
| Transfer to Replacement Reserve | 120,000 | 120,000 | 16 | - | - | - | - | |
| Transfer from Replacement Reserve | (120,000) | (120,000) | 16 | |||||
| Transfer from Personnel Contingency Reserve | (145,000) | (145,000) | 16 | (10,000) | (10,000) | |||
| Transfer from Library Materials Reserve | (39,000) | (39,000) | 16 | |||||
| Transfer to Contingency Reserve | 20,000 | 20,000 | 16 | |||||
| Transfer from Contingency Reserve | (15,000) | (92,500) | (77,500) | 16 | (10,683) | 10,000 | 20,000 | 20,000 |
| Transfer to/(from) Reserves | 5,000 | (256,500) | (261,500) | (20,683) | - | 20,000 | 20,000 | |
| Transfer to/(from) Accumulated Surplus | - | - | - | |||||
| Debt repayments | 12,183 | - | (12,183) | - | - | - | - | |
| Net Transfers | 17,183 | (256,500) | (273,683) | (20,683) | - | 20,000 | 20,000 |
Financial Plan Balance: -
CONFIDENTIAL
2019 Municipal Contributions
Summary by Municipality (2018 → 2019)
| Municipality | % 2018 | 2018 Total Requisition | % 2019 | 2019 Operating Budget | Rent Adjustment¹ | Total Requisition 2019 | Increase | Building Maint. Costs² | Total Municipal Budget 2019 |
|---|---|---|---|---|---|---|---|---|---|
| Central Saanich | 5.20% | $884,902 | 5.08% | $883,926 | $8,992 | $892,918 | $8,017 | 0.90% | $0 |
| Colwood | 4.69% | $798,113 | 4.73% | $823,026 | $6,336 | $829,362 | $31,249 | 3.90% | $27,151 |
| Esquimalt | 5.42% | $922,340 | 5.25% | $913,506 | -$4,095 | $909,411 | -$12,928 | -1.40% | $0 |
| Highlands | 0.65% | $110,613 | 0.73% | $127,021 | $981 | $128,002 | $17,389 | 15.70% | $3,928 |
| Langford | 10.04% | $1,708,541 | 10.62% | $1,847,893 | $14,341 | $1,862,234 | $153,693 | 9.00% | $58,688 |
| Metchosin | 1.43% | $243,348 | 1.31% | $227,942 | $1,734 | $229,676 | -$13,672 | -5.60% | $9,055 |
| Oak Bay | 6.88% | $1,170,793 | 6.86% | $1,193,648 | -$4,859 | $1,188,789 | $17,996 | 1.50% | $0 |
| Saanich | 33.95% | $5,777,386 | 33.98% | $5,912,561 | -$22,259 | $5,890,302 | $112,916 | 2.00% | $0 |
| Victoria | 28.73% | $4,889,081 | 28.51% | $4,960,774 | -$2,316 | $4,958,458 | $69,377 | 1.40% | $0 |
| View Royal | 3.01% | $512,222 | 2.93% | $509,824 | $1,145 | $510,969 | -$1,253 | -0.20% | $0 |
| Total | 100% | $17,017,338 | 100% | $17,400,121 | $0 | $17,400,121 | $382,783 | 2.25% | $98,822 |
Notes: 2 Building Maintenance Costs for jointly owned buildings are additional municipal budget amounts that are over-and-above the requisition for the library operating budget. The two branches that are jointly owned are the Central Branch and the Juan de Fuca Branch. Similar costs at other branches do not flow through GVPL and are paid by the municipalities directly. Other than the contributions to the Juan de Fuca Major Asset Maintenance Trust fund ("JF MAM"), building costs are estimates. Once actual costs are known, GVPL invoices the municipalities. Budgeted building costs for the branch portion of the jointly-owned buildings, excluding administrative area costs that are included in the library operating budget, are as follows: (table continues in source)
1 The Rent Adjustment is calculated in accordance with Section 8.12 (a), (b) and (c) of the Library Operating Agreement and relates to portions of buildings used to benefit all member municipalities: the Collection and Technical Services section of the Juan de Fuca Branch building and the Administrative portion of the Central Branch building. Municipalities which did not contribute to the initial acquisition of such building or who did not subsequently purchase a portion of such building pays reasonable rent to those Municipalities that did.
2019 Municipal Per Capita Contributions
| Municipality | Total Requisition 2019 | Population¹ | Cost Per Capita 2019 | 2019 Increase per capita |
|---|---|---|---|---|
| Central Saanich | $883,926 | 16,213 | 54.52 | $0.49 |
| Colwood | $823,026 | 17,952 | 45.85 | $1.74 |
| Esquimalt | $913,506 | 16,899 | 54.06 | -$0.77 |
| Highlands | $127,021 | 2,561 | 49.60 | $6.79 |
| Langford | $1,847,893 | 38,317 | 48.23 | $4.01 |
| Metchosin | $227,942 | 4,764 | 47.85 | -$2.87 |
| Oak Bay | $1,193,648 | 18,717 | 63.77 | $0.96 |
| Saanich | $5,912,561 | 115,864 | 51.03 | $0.97 |
| Victoria | $4,960,774 | 86,130 | 57.60 | $0.81 |
| View Royal | $509,824 | 10,380 | 49.12 | -$0.12 |
| Total | $17,400,121 | 327,797 | $53.08 | $1.17 |
1 Source of population figures - BC Stats website: http://www.bcstats.gov.bc.ca/StatisticsBySubject/Demography/PopulationEstimates.aspx, 2017 population estimates, accessed on July 2018.
General note: Percentage share of costs by municipality are determined based on 50% property assessment value and 50% population estimate. More detailed information on assessment values and population are available on request.
CONFIDENTIAL
Notes to the 2019 Budget and Five-Year Financial Plan
Budget allocations are also determined by our operational decisions and actions, which are based on our organizational values, policies and external mandates and legislation.
Approximately 90% of the GVPL operating budget is funded by our ten municipal partners. Consequently, a key objective is to keep municipal contribution increases within an acceptable range, typically based on rates of inflation and wage increases as negotiated through GVLRA. “Acceptable” increases are ultimately determined by Councils upon consideration of our budget requisition.
Because needs and opportunities change over time as we strive to best serve our communities within the Greater Victoria area, GVPL’s budget process allows reasonable flexibility for business areas to adapt and optimize their activities as events unfold, while still requiring system-wide financial planning and accountability.
For 2019, operational efficiencies and cost avoidance strategies will continue to be explored as the demand for new and expanding services continues to increase. After the successful opening of the sxʷeŋxʷəŋ təŋəxʷ James Bay Branch, the library is looking to 2019 to leverage the lessons learned and opportunities to align to the move of the Esquimalt branch.
Modest revenue generation opportunities will continue to be explored in 2019 in addition to the new passive revenue source of the coin donations boxes now installed at all branches.
GVPL is committed to operating efficiently and effectively to deliver library service to 10 municipalities. The library system leverages more than 100 active community partnerships to expand programs and lifelong learning opportunities for Greater Victoria residents.
Components of the 2019 budget include the following:
1. Municipal Contributions – Operating
Increase $382,783
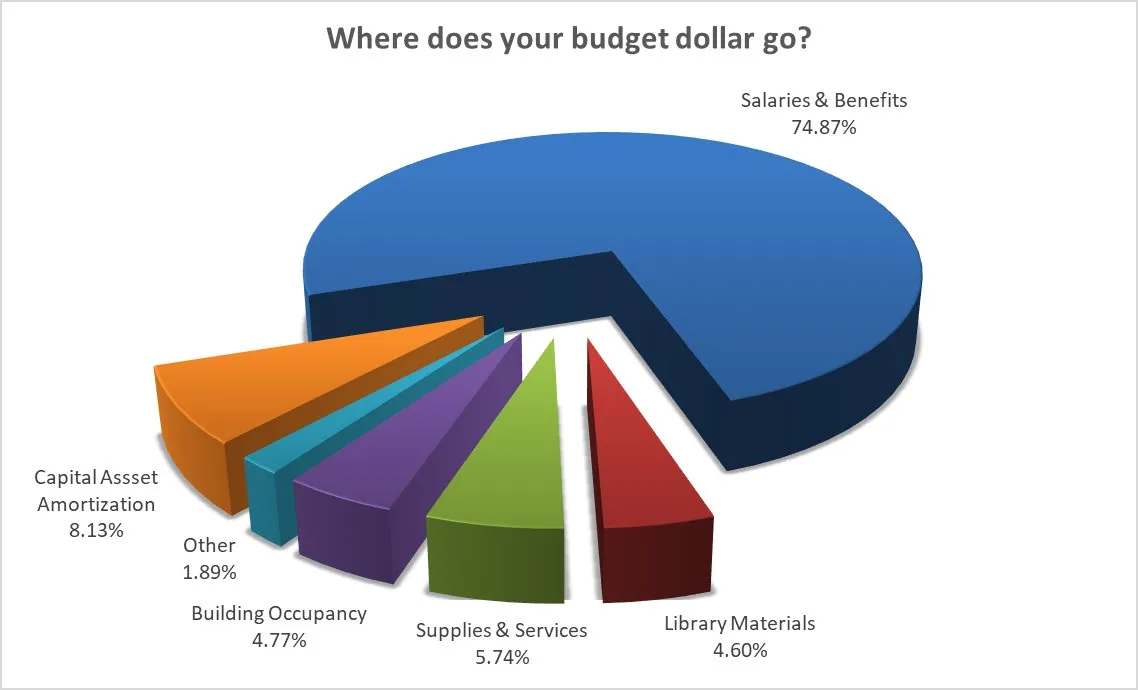
Of the 2.25% increase in municipal contributions, the majority (75%) is attributed to salaries and benefits which are jointly negotiated through the GVLRA. Salaries and benefits are the key cost driver for GVPL. The remainder is allocated by the following:
2. Municipal Contributions – Start-up
Decrease $105,320
In 2019 there is a decrease in the amounts for new and relocated branch start-up costs (furnishing and equipping the branch, as well as a collection inventory for new branches). As with prior years these are funded by the individual municipalities providing the facilities.
For 2018 the following was identified for branch start-up funds:
- sxʷeŋxʷəŋ təŋəxʷ James Bay Branch - $75,000
- Esquimalt relocation - $385,600
For 2019 the following has been identified for branch start-up funds:
- Esquimalt relocation - $355,280
The majority of these contributions are for capital expenditures, with a small percentage of start-up funding going towards non-capital costs, such as moving and some supplies below the asset threshold.
3. Provincial Grants
No Change
For 2019 there is no expected change to the grant levels of the prior year of $642,339.
Provincial funding has been frozen since approximately 2009, had this funding increased with CPI (annualized at 1.5%) as with other expenses to the present budget year, there would have been an increase to this funding by approximately $120,000. This shortfall continues to be made up by individual municipalities in order to maintain status quo on ongoing programming and services.
4. Federal Grants
Decrease $7,379
Federal grants are cyclical in nature and are dependent on specific programs planned during the operating budget year.
5. Fines, Fees and Printing
Decrease $25,375
Revenue from fines, fees and printing is estimated to continue to decline modestly. Fees (e.g. meeting room rentals) are under review and additional opportunities for revenue generation will continue to be explored in 2019. GVPL is currently investigating potential revenue sources such as fees for overdue holds not picked up.
6. Contracts for Service
No Change
This is an annual payment of $28,450 from the Capital Regional District.
7. Investment Income
No Change
Investment revenue is conservatively estimated to reflect projected continuation of modest earnings in the Municipal Finance Authority bond fund and slight increases in returns for secured GIC’s.
8. Donations and Other Grants
No Change
New funding opportunities will continue to be explored in 2019, in tandem with new donor engagement strategies.
9. Salaries and Benefits
Increase $514,894
The library’s CUPE Collective Agreement expired on December 31, 2016.
The full-time equivalent (FTE) count for regular employees (including full and part time employees) remains at 150 FTE. Salaries and benefits account for 75% of the library’s overall budget in 2019.
This budget includes employee benefit costs and payroll withholding costs such as EI and CPP. A detailed benefit review took place as part of the 2019 budget development and it was determined that the rate of benefits and withholding costs will be adjusted down from 24.5% to 23.75% of total salaries and wages, this is despite the anticipated increase associated with the newly implemented British Columbia Employer Health Tax.
10. Library Materials (Expensed and Capital)
Decrease $41,000
The library materials budget is split between Expenses, for periodicals and eResources, and Capital Expenses, for books, audio visual and electronic materials, which are capitalized as assets and amortized over 7 years. The reduction year over year is being offset by an additional $135,000 in surplus funds, $96,000 in 2018, and $39,000 in 2019.
11. Amortization
Decrease $166,100
This is the estimated amortization expense for tangible capital assets, in accordance with the Board’s Tangible Capital Asset policy. Since this is an unfunded expense (see explanation below), it is added back to the budgeted annual surplus, and does vary year over year pending capital asset purchases and disposals.
12. Supplies and Services
Increase $11,413
Supplies and services include such items as telephone, networks, printer paper and other supplies and shuttle fuel. These items have all increased slightly, but through efficient negotiation of service contracts, cost reduction in other areas the increase is below the Vancouver CPI (Consumer Price Index of 2%).
13. Building Occupancy
Increase $131,218
Building occupancy includes maintenance contracts, security, garbage and utilities. The primary driver for the increase is a significant increase in budgeted janitorial costs, and higher security costs (Central). Janitorial costs have increased significantly in the market due to such items as increased environmental fees, and higher labour costs. Security costs have increased due higher contract costs due to increases in minimum wage, contract renewal and additional services requested from our service provider.
14. Other Expenses
Decrease $7,863
Other expenses include such items as insurance and employee recruitment costs, marketing costs, and business travel expenses.
Document Images
(3)