DocumentsStaff ReportSep 8, 2026Pages 1–71
CITY OF LANGFORD ASSET MANAGEMENT PLAN & LONG TERM FINANCIAL PLAN FINAL 2026
The City of Langford’s Asset Management and Long-Term Financial Plan assesses municipal infrastructure, its condition and renewal needs, and the City’s long-term funding sustainability. It recommends building reserves in advance, dedicating renewal funding to existing assets, and adopting policies and studies to support lifecycle funding, growth, roads, and sewer utility sustainability.
Key facts
- Estimated replacement value of City assets: approximately $1.8 billion; approximately $2.2 billion including WSES assets
- Current annual infrastructure replacement funding: approximately $14.4 million
- Estimated annual funding gap: $5.7 million for City-owned assets; $11.0 million including WSES assets
- Forecasted infrastructure replacement spending for 2027–2101: approximately $1.6 billion for City-owned assets; approximately $2.0 billion including WSES assets
- Estimated lifecycle funding gap: approximately $900 million
CITY OF LANGFORD ASSET MANAGEMENT PLAN & LONG TERM FINANCIAL PLAN FINAL 2026
Page 1
CITY OF LANGFORD ASSET MANAGEMENT PLAN & LONG TERM FINANCIAL PLAN FINAL 2026
Page 2
i CITY OF LANGFORD | Asset Management & Long-Term Financial Plan EXECUTIVE SUMMARY As one of British Columbia's fastest-growing municipalities, Langford continues to invest in infrastructure to support growth, maintain service levels, and meet the needs of a growing community. This Asset Management Plan evaluates the City's infrastructure portfolio, identifies future renewal requirements, and provides a framework for maintaining long-term financial sustainability. Key Findings
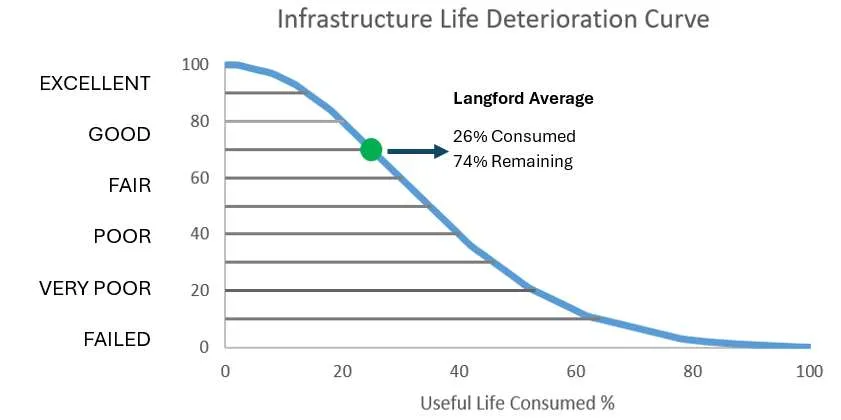
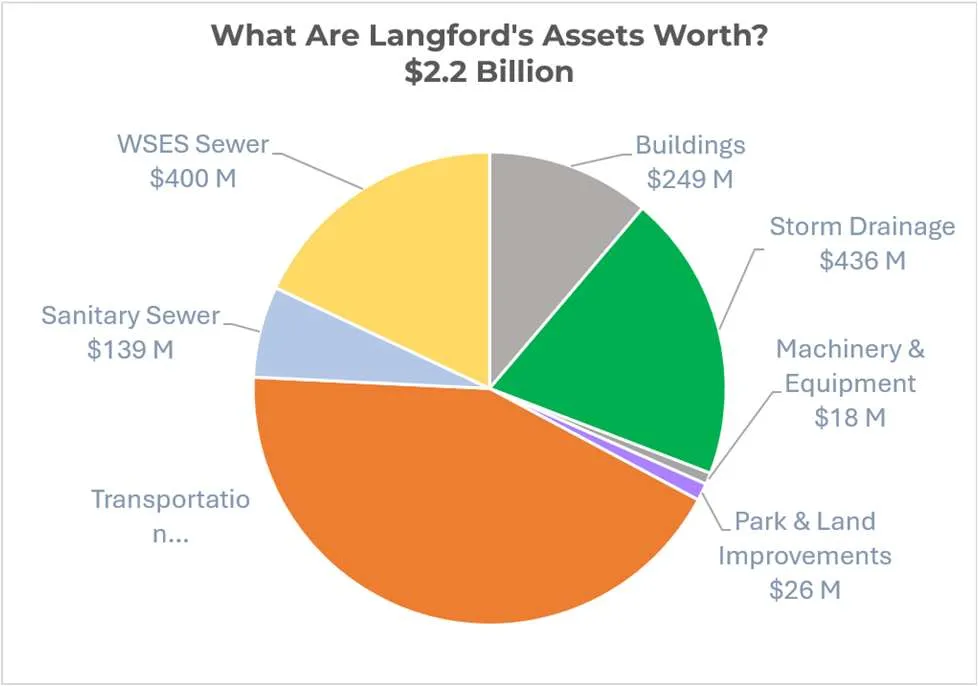
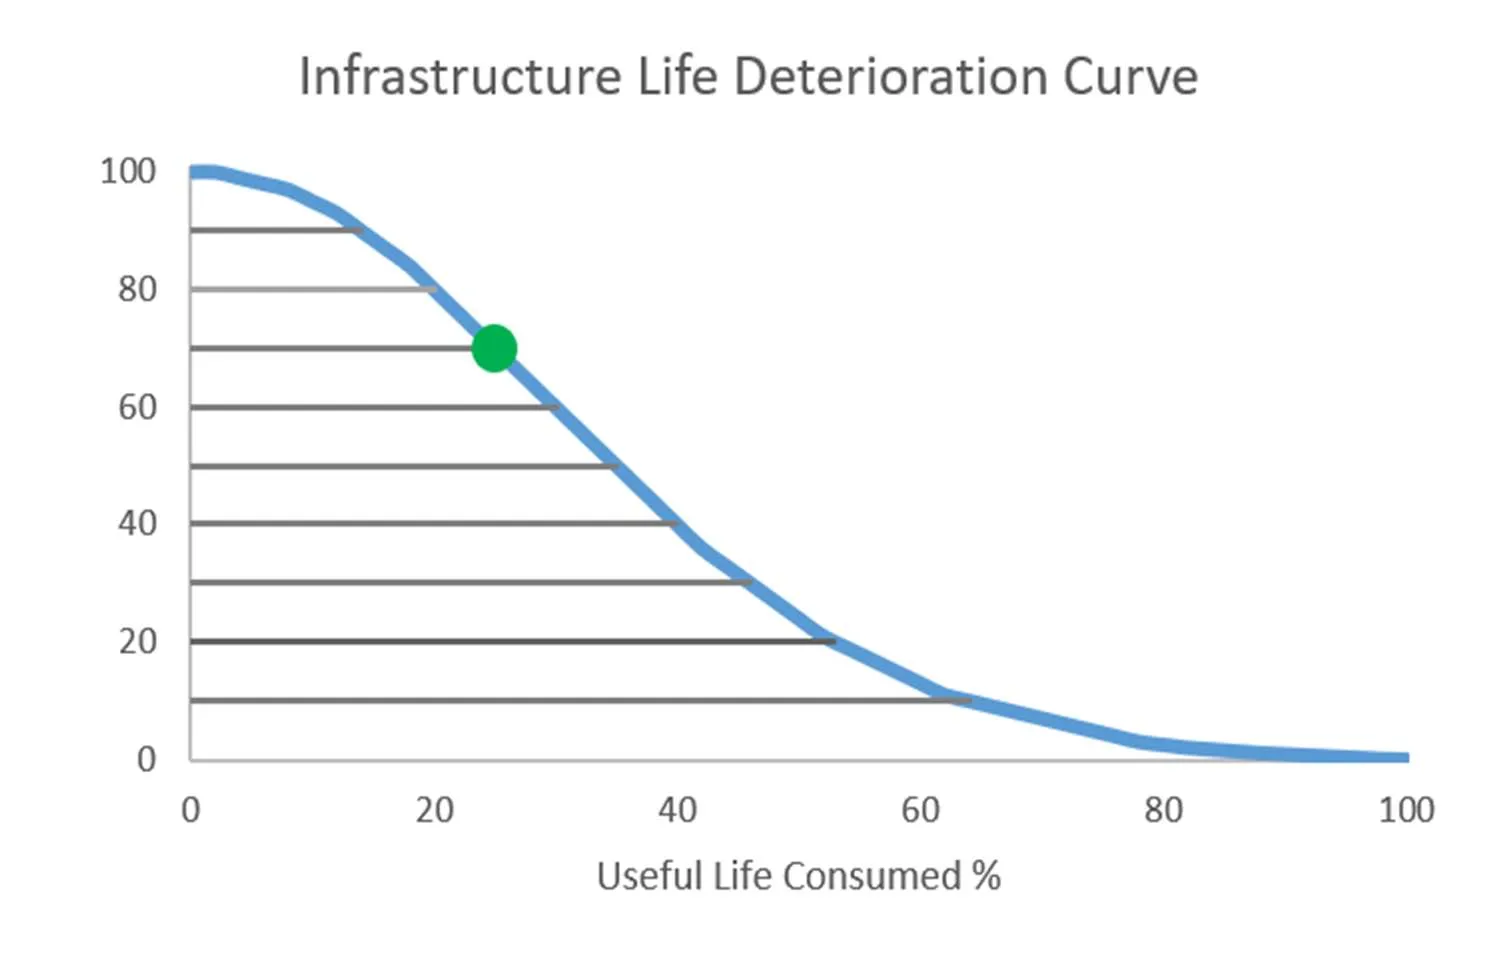
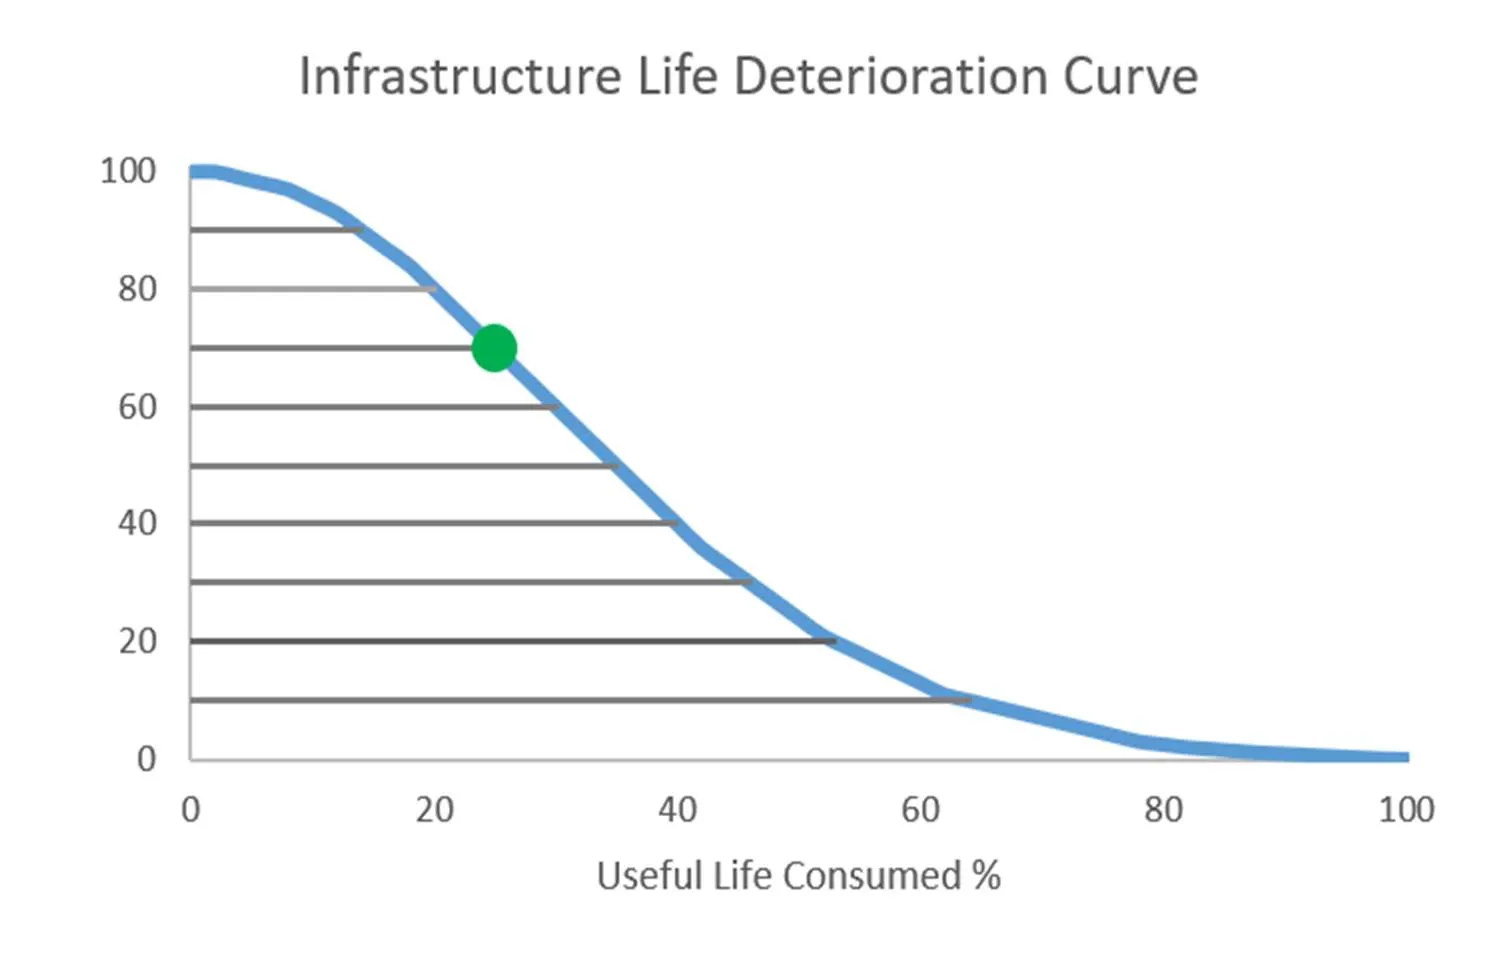
Infrastructure Value Overall Asset Condition Useful Life Remaining Annual Funding Gap Lifecycle Funding Gap % Sustainability 1.8 – 2.2 Billion GOOD ≈ 74% ≈ 5.7M – 11.0M ≈ $900 M 57% Table 1: Key Findings What We Own The City's current infrastructure portfolio has an estimated replacement value of approximately $1.8 billion. If the City acquires the Langford sewer infrastructure currently owned by West Shore Environmental Services (WSES), the estimated replacement value increases to approximately $2.2 billion. Transportation, storm drainage, and sewer infrastructure represent the largest components of the City's asset portfolio by value. What Condition are Assets In? The City's infrastructure portfolio remains relatively young, with only 26% of useful life consumed and approximately 74% of useful life remaining. As a result, the overall infrastructure portfolio is assessed to be in good condition, with most major asset classes still in the early stages of their lifecycle. This provides an opportunity to establish proactive funding strategies before significant renewal and replacement requirements begin to emerge. Figure 2: Langford Consumption on Typical Deterioration Curve Figure 1: Asset Inventory Replacement Values
Page 3
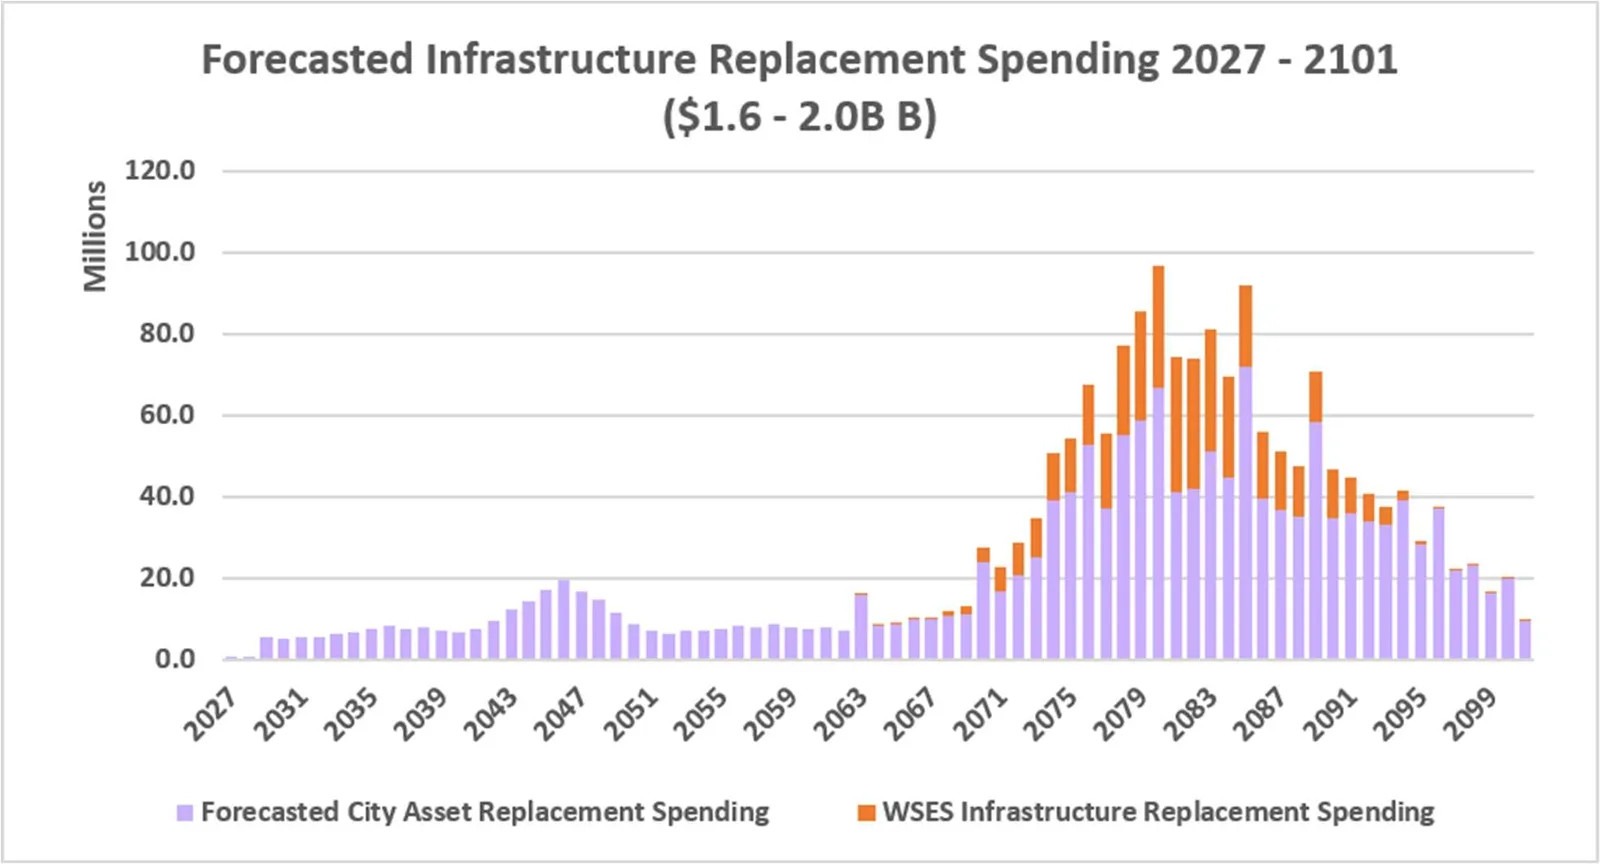
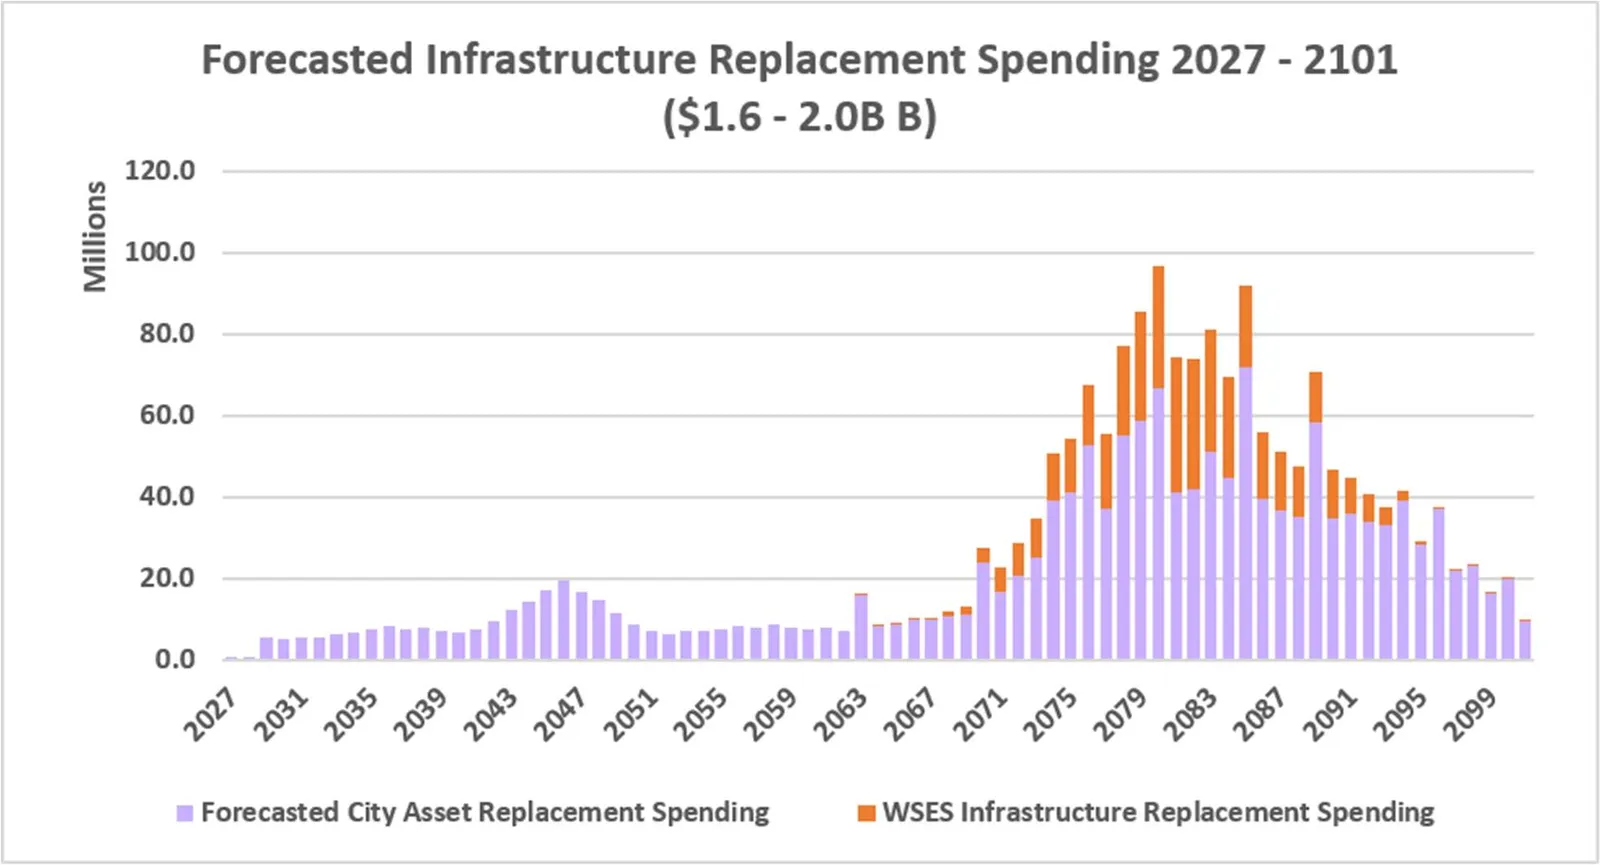
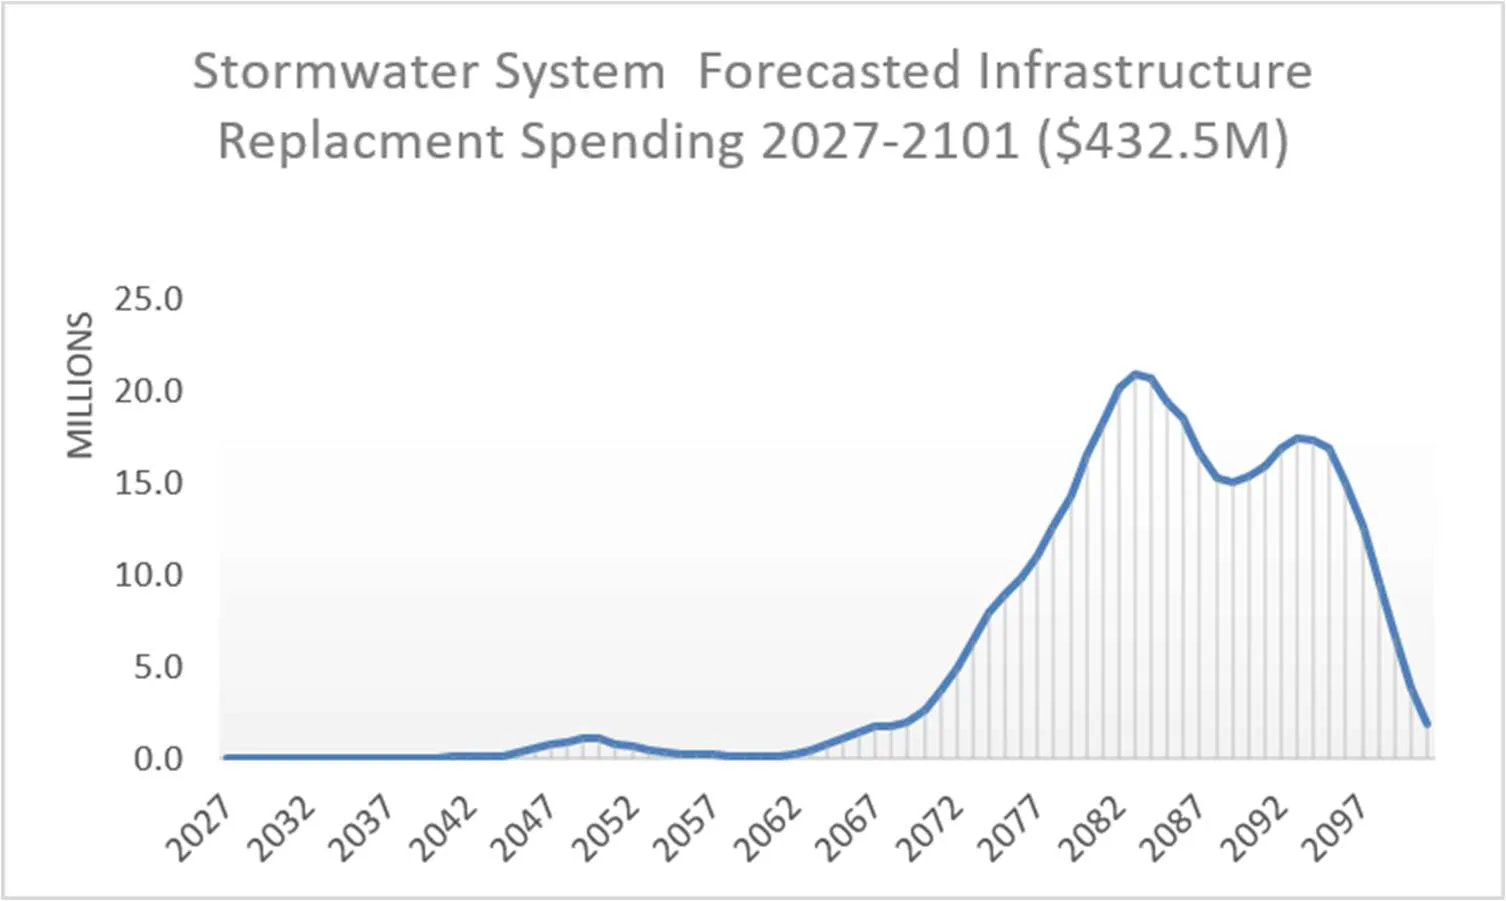
ii CITY OF LANGFORD | Asset Management & Long-Term Financial Plan What Is the Forecast Infrastructure Spending Over the Next 75 Years? Infrastructure renewal requirements are forecast to total approximately $1.6 billion over the next 75 years. If WSES assets are included, total renewal requirements increase to approximately $2.0 billion.
Annual renewal requirements remain relatively modest in the near term but increase as infrastructure ages and major asset groups reach the end of their useful lives. Long-term planning is therefore required to ensure sufficient funding is available when assets require rehabilitation or replacement. How Well Can the City Afford It? Infrastructure funding sustainability measures the City's ability to fund infrastructure renewal and replacement over the long term.
Current annual infrastructure funding is estimated at approximately $14.4 million, compared with a sustainable funding requirement of approximately $20.1 million. This results in an annual infrastructure funding gap of approximately $5.7 million. Current Assets Including WSES assets Total Annual Capital Funding 16.4 M 16.4 M Less: Funding utilized for new capital (2.0) M (2.0) M Total annual Capital Replacement Funding 14.4 M 14.4 M Sustainable Annual Funding (AAAC table 5) 20.1 M 25.4 M Annual Funding Gap 5.7 M 11.0 M
Page 4
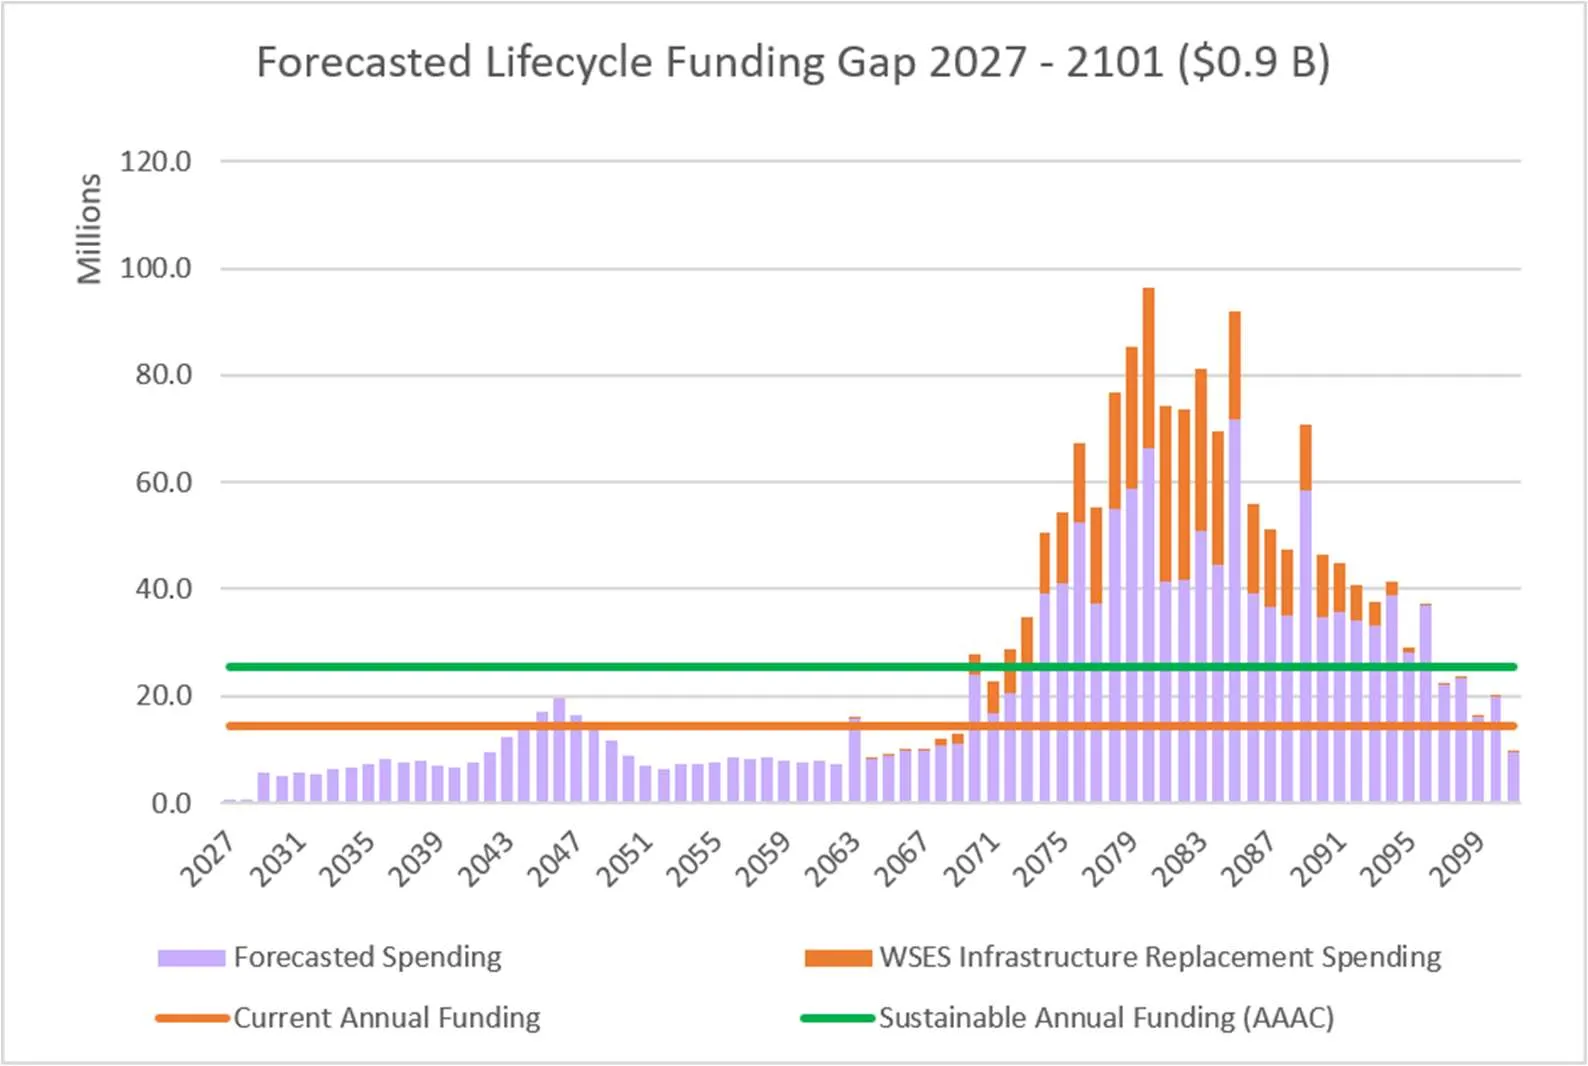
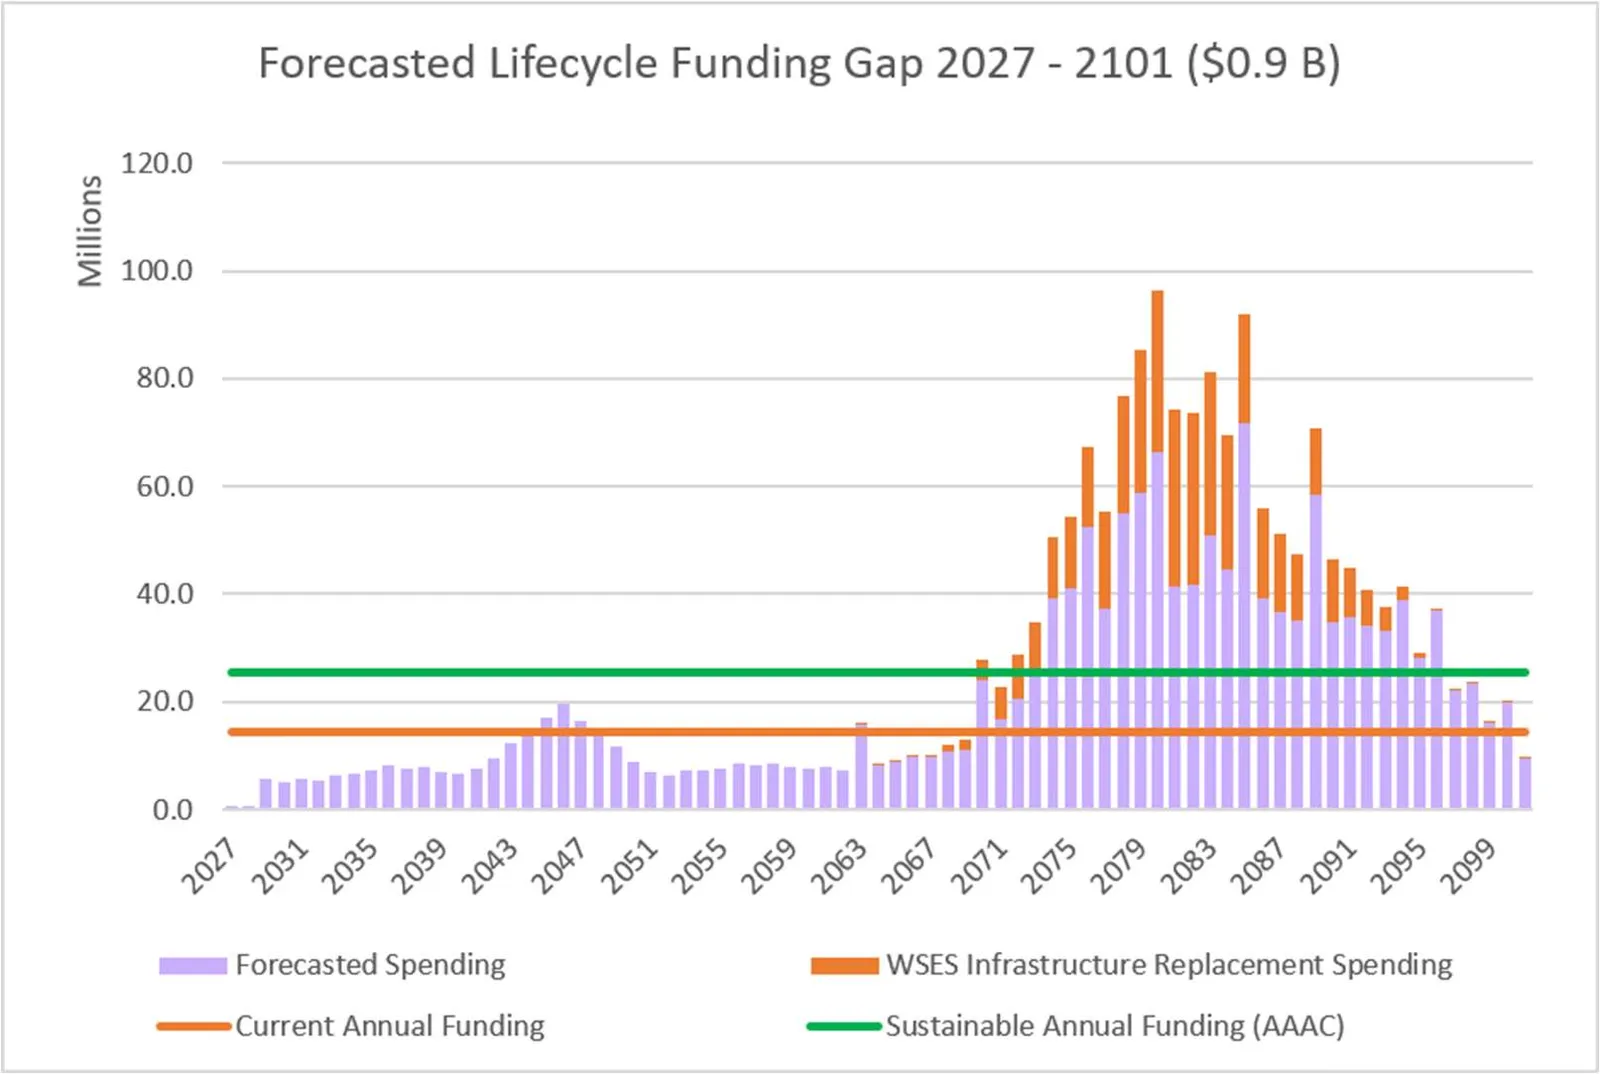
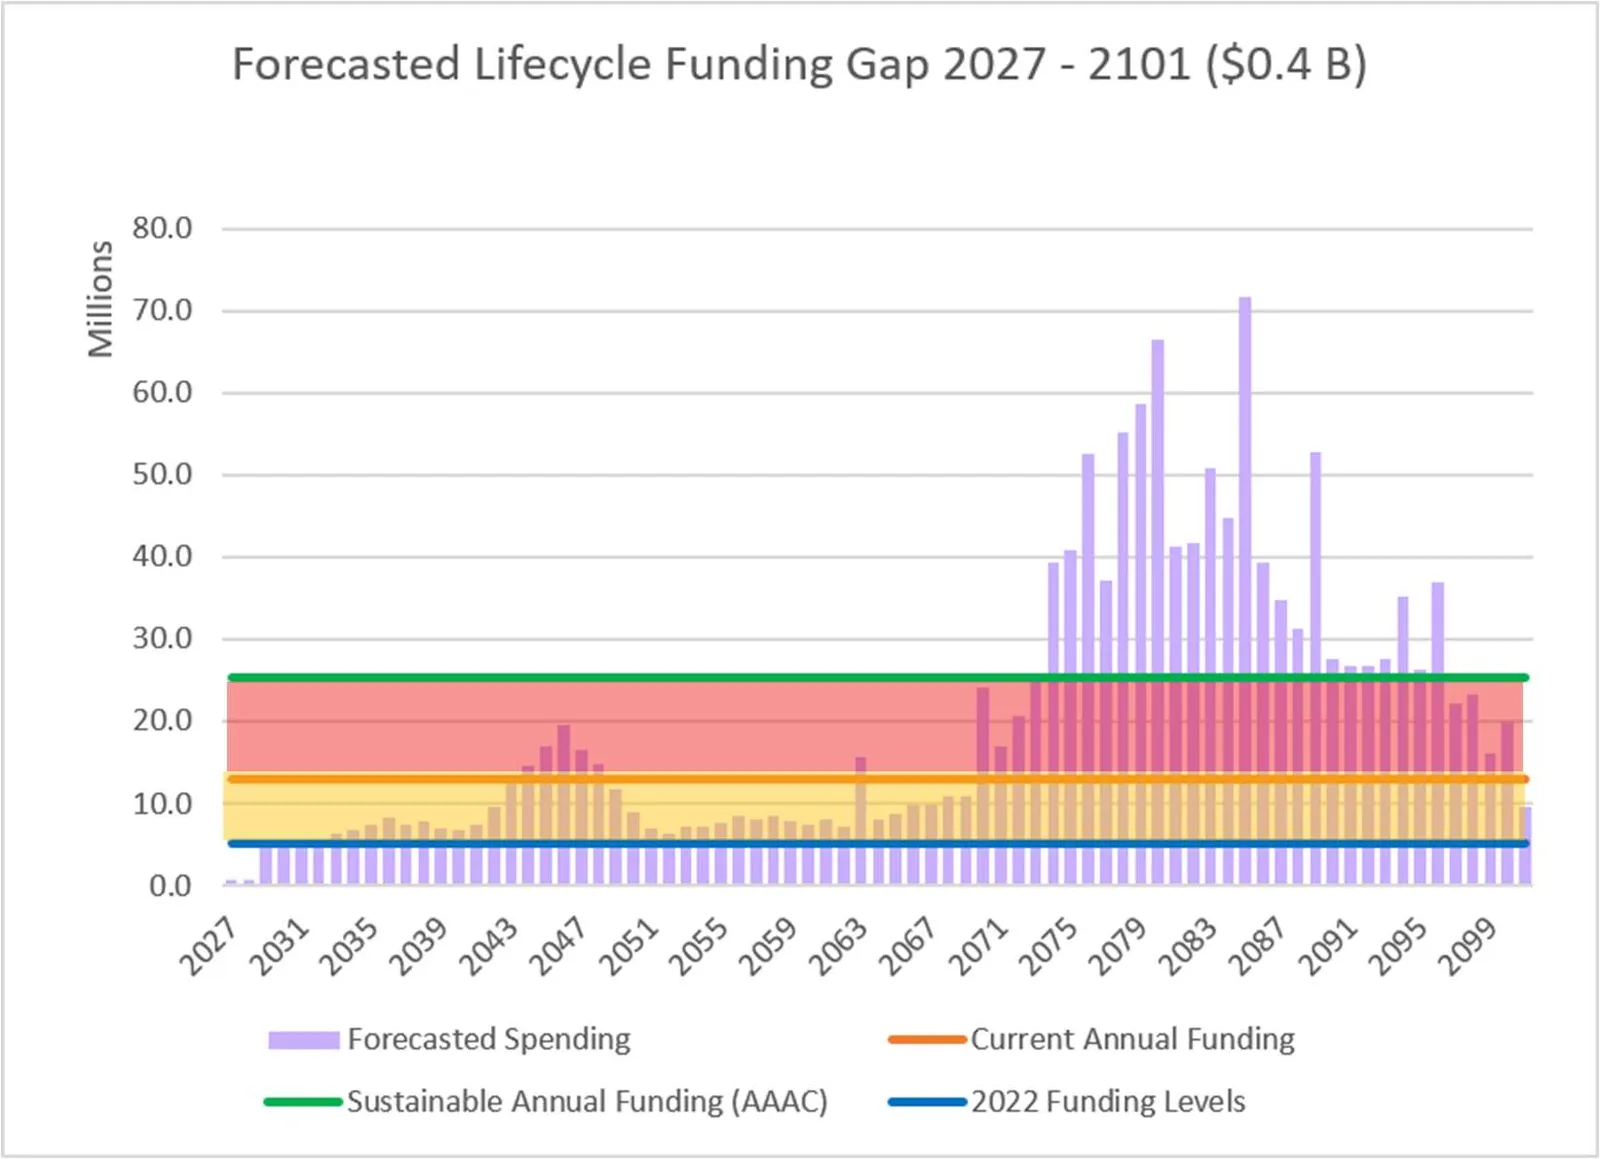
iii CITY OF LANGFORD | Asset Management & Long-Term Financial Plan Based on current funding levels, the City is projected to accumulate approximately $900 million in unfunded lifecycle infrastructure requirements over the planning period.
Figure 3: Forecasted Lifecycle Funding Gap What is Being Done? Recent tax increases and financial planning initiatives have materially improved the City's long- term infrastructure funding position. Since 2022, additional renewal funding has increased projected lifecycle funding by approximately $742.5 million over the planning horizon.
Figure 4: Historical Funding Gap Addressed 2022-2026 Cumulative Funding Gap $900M
Page 5
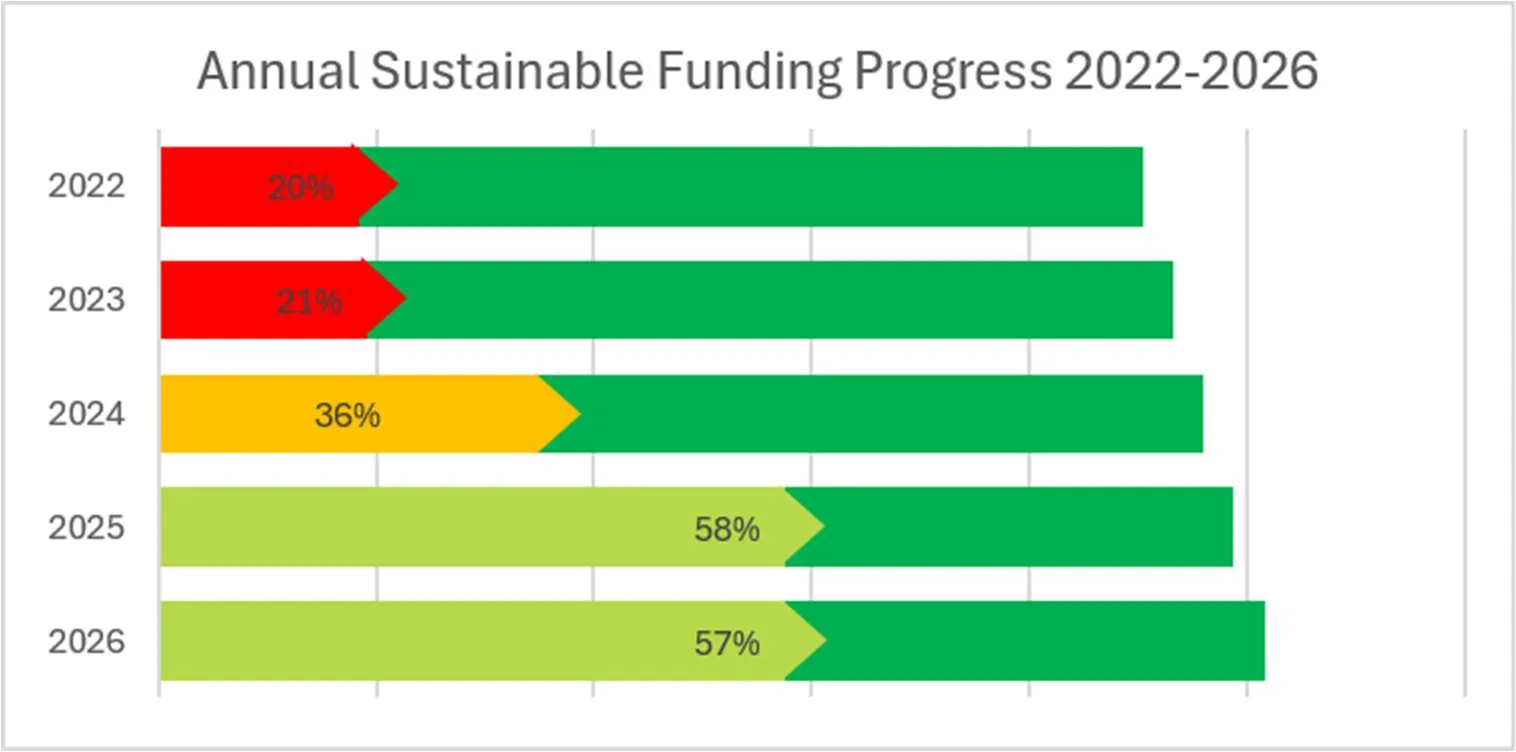
iv CITY OF LANGFORD | Asset Management & Long-Term Financial Plan The City's current financial plan is forecast to improve lifecycle funding sustainability from approximately 20% in 2022 to approximately 57% in 2026, with sustainability projected to approach 80% by 2030. Funding Approach A proactive funding strategy, where reserve contributions are made throughout an asset's lifecycle, is the most cost-eƯective, and intergenerationally equitable approach to managing future infrastructure replacement costs. By generating investment income and reducing reliance on future debt financing, this approach is projected to reduce long-term taxpayer funding requirements by approximately $1.0 billion (38%) compared to funding infrastructure replacements when assets reach the end of their service lives.
The City's 2026-2030 Financial Plan supports this approach by redirecting retiring debt servicing payments toward infrastructure reserve contributions. Sensitivity Analysis A sensitivity analysis was conducted to help authenticate the broad findings of this review. Broad findings include estimated annual sustainable funding, annual funding gap, and 75- year forecasted spending. Overall, the sensitivity analysis confirms Langford is facing an annual funding gap that will need to be addressed now or at some point in the future.
Page 6
v CITY OF LANGFORD | Asset Management & Long-Term Financial Plan Recommendations Based on the analysis presented in this report, the following recommendations are provided:
- Maintain the build reserve approach reflected in the 2026-2030 Financial Plan to fund future infrastructure renewal and replacement needs.
- Dedicate $14.4M of the current infrastructure funding stream to existing infrastructure replacement or maintenance only.
- Develop an investment policy that aligns with the City’s approach to long-term infrastructure reserve funding.
- Create a policy in the annual Five Year Financial Plan Bylaw which dedicates a portion of non-market change revenues to funding future operating, maintenance, and lifecycle replacement costs associated with growth.
- Develop a policy requiring development lifecycle costing analysis for major land use decisions.
- Increase annual road funding to $5.0M by reallocating reserve contributions to maintain current pavement condition.
- Undertake a Sewer Utility Sustainability Study to evaluate long-term ownership, lifecycle funding requirements, and utility rate sustainability.
Page 7
vi CITY OF LANGFORD | Asset Management & Long-Term Financial Plan Contents EXECUTIVE SUMMARY ................................................................................................... i Key Findings ............................................................................................................. i Recommendations .................................................................................................. v ACKNOWLEDGEMENTS ..............................................................................................viii 1. INTRODUCTION ..................................................................................................... 1 1.1. Overview ........................................................................................................ 2 1.2. Council Direction ............................................................................................ 3 1.3. Summary of Asset Inventory and Services ......................................................... 3 1.4. Asset Management Approach .......................................................................... 4 2. FINANCIAL FINDINGS ............................................................................................ 5 2.1. Inventory Replacement Value ........................................................................... 6 2.2. Inventory Consumption ................................................................................... 7 2.3. Sustainable Funding by Asset Class ................................................................. 9 2.4. Current Funding Levels .................................................................................. 10 2.5. Annual Funding Gap ...................................................................................... 11 2.6. Lifecycle Spending Forecasts ......................................................................... 12 2.7. Lifecycle Spending Funding Gap ..................................................................... 13 2.8. Funding Sustainability History ........................................................................ 14 2.9. Forecasted Sustainability 2027-2030 .............................................................. 16 2.10. Growth ...................................................................................................... 18 2.11. Sensitivity Analysis .................................................................................... 19 3. FINANCIAL STRATEGY .......................................................................................... 20 3.1. Funding Increase Options .............................................................................. 21 3.2. Funding Dedication ....................................................................................... 25 3.3. Reserves & Investment Strategy ..................................................................... 26 3.4. Non-Market Change Revenue Policy ............................................................... 28 3.5. Lifecycle Costing Analysis Policy .................................................................... 30
Page 8
vii CITY OF LANGFORD | Asset Management & Long-Term Financial Plan 3.6. Road Network Funding Strategy ...................................................................... 31 3.7. Sewer Utility Financial Sustainability .............................................................. 32 4. ASSET CONDITION ASSESSMENT ......................................................................... 33 4.1. Condition Assessment Overview .................................................................... 35 4.2. Current Asset Condition Ratings..................................................................... 35 4.3. Road Network Condition ................................................................................ 36 5. LEVELS OF SERVICE ............................................................................................. 37 6. RISK MANAGEMENT ............................................................................................. 40 7. DETAILED ASSET INVENTORY ............................................................................... 41 7.1. Transportation .............................................................................................. 42 7.2. Parks & Recreation ........................................................................................ 45 7.3. Stormwater System ....................................................................................... 47 7.4. Sanitary Sewer .............................................................................................. 49 7.5. Water System................................................................................................ 50 7.6. Building and Structures ................................................................................. 51 7.7. Natural Assets .............................................................................................. 53 APPENDIX A – ASSUMPTIONS ...................................................................................... 54 APPENDIX B – SOURCES OF INFORMATION .................................................................. 58 GLOSSARY ................................................................................................................. 60 LIST OF TABLES AND FIGURES ..................................................................................... 62
Page 9
viii CITY OF LANGFORD | Asset Management & Long-Term Financial Plan ACKNOWLEDGEMENTS The authors would like to acknowledge the City of Langford, West Shore Environmental Services (WSES), and other supporting organizations for their collaboration and contributions to this Asset Management and Long-Term Financial Plan. The development of this analysis relied on the expertise, data, and insights provided by staff from a range of departments and service areas, including Finance, Engineering and Public Works, Parks, Recreation and Facilities, Communications, Geographic Information Systems (GIS), and Asset Management. Their participation helped inform service level assessments, asset inventories, financial forecasts, and long-term infrastructure planning. The authors also acknowledge the contributions of WSES and utility service partners who provided technical information, operational perspectives, and supporting data related to water, wastewater, and environmental services infrastructure. The review comments, technical knowledge, and ongoing cooperation provided throughout the project materially enhanced the quality, accuracy, and reliability of this plan. The authors are grateful for the commitment and support of all participating departments, organizations, and stakeholders.
Page 10
- INTRODUCTION
SECTION 1 INTRODUCTION
Page 11
2
CITY OF LANGFORD | Asset Management & Long-Term Financial Plan SECTION 1: INTRODUCTION 1.1. Overview The City of Langford is one of British Columbia's fastest-growing communities, with its population increasing from 49,199 in 2021 to an estimated 59,664 in 2025. As the largest municipality in the Western Communities, Langford must continually expand, maintain, and replace infrastructure to support a rapidly growing population. This Asset Management and Long-Term Financial Plan supports informed decision-making by summarizing the City's asset base, the services those assets provide, and the factors that influence lifecycle needs, renewal timing, and financial risk. The report provides a foundation for long-term capital planning and sustainable service delivery. To provide a comprehensive overview of the City's stewardship strategy, the report is organized into the following sections: SECTION 1: INTRODUCTION Introduces the purpose, scope, methodology, and key assumptions that underpin the Asset Management and Long-Term Financial Plan. SECTION 2: FINANCIAL FINDINGS Summarizes the City's infrastructure asset values, replacement forecasts, funding requirements, and long-term funding gap. SECTION 3: FINANCIAL STRATEGY Outlines the funding approach, financial targets, and strategies required to support sustainable asset management. SECTION 4: ASSET CONDITION ASSESSMENT Presents the City's approach to condition assessment and summarizes the current condition of major infrastructure and community assets. SECTION 5: LEVELS OF SERVICE Defines the quality, reliability, and performance of services provided to residents and links service expectations to financial sustainability. SECTION 6: RISK MANAGEMENT Describes the City's framework for identifying, assessing, and managing infrastructure risks to support informed decision-making. SECTION 7: DETAILED ASSET INVENTORY Provides a detailed inventory of the City's infrastructure and community assets by service area, including asset quantities, values, condition, and estimated useful lives.
Page 12
3
CITY OF LANGFORD | Asset Management & Long-Term Financial Plan SECTION 1: INTRODUCTION 1.2. Council Direction Within Council's 2023–2027 Strategic Plan, Langford identifies increasing infrastructure costs as a significant challenge facing the community and specifically acknowledges the need to develop a Comprehensive Asset Management Plan as part of the City's long-term planning framework. The Strategic Plan recognizes that continued population growth, rising construction costs, and increasing infrastructure obligations require proactive planning and sound financial management to ensure services remain sustainable and affordable for current and future residents.
“we commit to governing responsibly, respectfully and strategically, with a focus on transparency, fiscal responsibility, and the careful management of assets”
Through the development and implementation of its Asset Management Plan, the City is advancing Council's commitment to financial stability, sustainable development, and informed decision-making by establishing a framework to understand infrastructure needs, prioritize investments, and plan for long-term renewal and replacement requirements. 1.3. Summary of Asset Inventory and Services Currently, the City owns and maintains approximately $1.8 billion worth of municipal assets and infrastructure, with roads and transportation making up roughly $950 million of this total. As a relatively young municipality, Langford benefits from having the majority of its infrastructure still within the first half of its expected useful life.
The inventory is organized by service area, beginning with transportation and expanding to parks and recreation, stormwater, buildings and structures, fire rescue, and utility services. Where available, it notes representative quantities, locations, and governing plans or agreements (e.g., master plans, regional service providers). This summary is not a complete accounting of every component; rather, it establishes a broad snapshot of the City’s asset base to provide the reader with some context for the analysis contained within other sections of this report.
Page 13
4
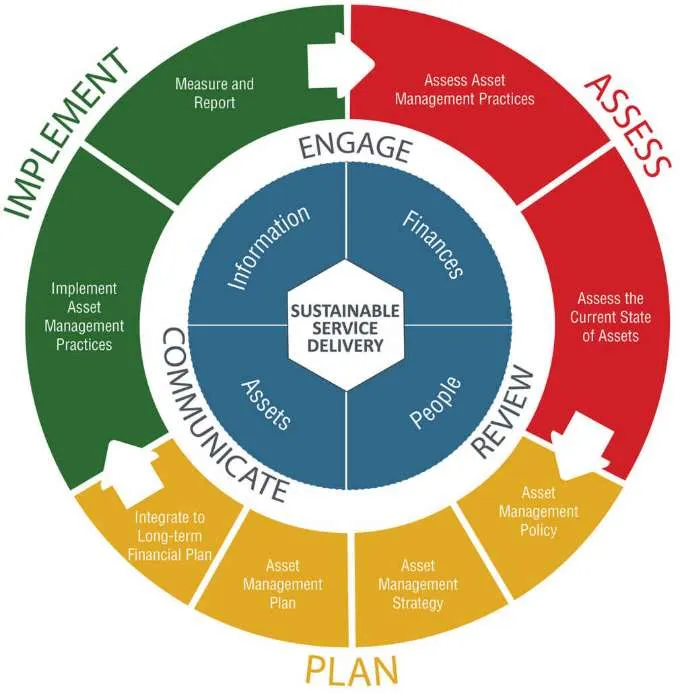
CITY OF LANGFORD | Asset Management & Long-Term Financial Plan SECTION 1: INTRODUCTION 1.4. Asset Management Approach The City has developed this Asset Management Plan and Long-Term Financial Plan using the Asset Management BC Framework for Sustainable Service Delivery. The framework promotes a continuous improvement approach to asset management, recognizing that effective asset management is an ongoing process of assessing asset information, planning future actions, and implementing improvements over time. The framework consists of three interconnected phases:
- Assess: Evaluate the condition, performance, risks, and available information related to City assets to better understand current and future service needs.
- Plan: Develop policies, strategies, asset management plans, and long-term financial forecasts that support sustainable service delivery and informed investment decisions.
- Implement: Deliver capital projects, operational improvements, and asset management initiatives while monitoring outcomes and reporting on progress. These phases are supported by ongoing communication, engagement, measurement, and review to ensure that decisions remain aligned with community priorities, service objectives, and available resources. This report represents the City's first comprehensive Asset Management Plan and Long-Term Financial Plan. As a result, the analysis contains assumptions and is based on the best information currently available. Consistent with the Asset Management BC Framework, perfection is not the objective of the initial plan. Rather, the plan establishes a baseline from which the City can continuously improve asset data, refine forecasts, enhance decision- making, and strengthen asset management practices over time. Future updates to the plan will incorporate improved asset information, updated assumptions, and evolving community priorities, resulting in increasingly accurate and reliable long-term planning.
Figure 5: Asset Management BC Framework
Page 14
- FINANCIAL FINDINGS
SECTION 2 FINANCIAL FINDINGS
Page 15
6
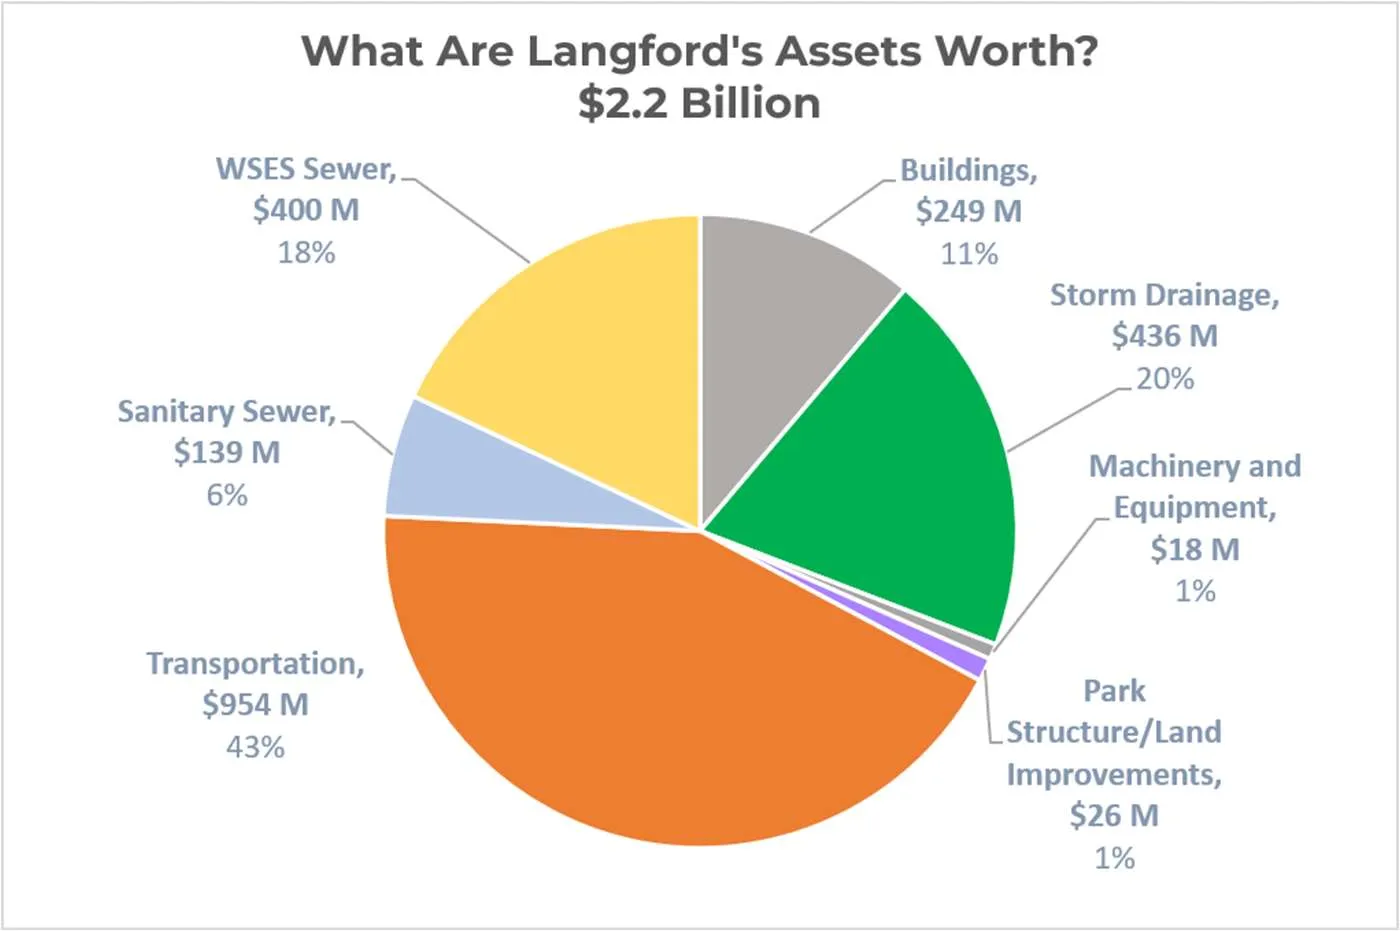
CITY OF LANGFORD | Asset Management & Long-Term Financial Plan SECTION 2: FINANCIAL FINDINGS 2.1. Inventory Replacement Value The City of Langford owns and maintains approximately $1.8 billion worth of municipal assets and infrastructure. The roads and transportation infrastructure make up about $950 million of this total. The tables below also illustrate the portion of asset value that remains versus the value already consumed based on estimated useful lives, helping to inform renewal priorities and long-term replacement planning. Asset Replacement Value Weighted Average Useful Life Buildings $248.6 M 75 Years Storm Drainage 436.3 M 74 Years Machinery and Equipment 17.5 M 15 Years Parks Structures/Land Improvements 26.4 M 50 Years Transportation 953.9 M 130 Years Sanitary Sewer 138.5 M 75 Years TOTAL 1,821.2 M 91 Years Sanitary Sewer owned by WSES 399.8 M 75 Years TOTAL POTENTIAL REPLACEMENT OBLIGATIONS 2,221.0 M 87 Years Table 2: Asset Inventory Replacement Values
Figure 6: Asset Replacement Values by Asset Class KEY TAKEAWAY
Transportation assets represent 43% ($954M) of Langford’s total asset value. Together, Transportation, Storm Drainage, and Sewer assets account for over 87% of the City's total asset value.
Page 16
7
CITY OF LANGFORD | Asset Management & Long-Term Financial Plan SECTION 2: FINANCIAL FINDINGS 2.2. Inventory Consumption Inventory consumption is a commonly used asset management metric that estimates how much of an asset's useful life has been consumed and, by extension, how much of its service potential has been used. It provides a high-level indication of the overall age and lifecycle position of an organization's infrastructure portfolio. For example, an asset class with 40% inventory consumption has, on average, utilized approximately 40% of its expected useful life, while the remaining 60% represents its estimated remaining service life.
Inventory consumption is often expressed as both a percentage of asset life consumed and a corresponding dollar value. The metric helps municipalities understand the extent to which infrastructure assets have been utilized, supports lifecycle planning, and provides context for future renewal and replacement requirements. While inventory consumption is not a direct measure of condition, it can serve as a useful indicator of long-term infrastructure sustainability when considered alongside condition assessments, risk analyses, levels of service, and financial planning information.
Asset $ Consumed $ Remaining Value Buildings 89.2 M 159.5 M Storm Drainage 94.2 M 342.1 M Machinery and Equipment 9.6 M 7.9 M Parks Structures/Land Improvements 5.9 M 20.6 M Transportation 226.2 M 727.7 M Sanitary Sewer 37.8 M 100.8 M TOTAL 462.9 M 1,358.6 M WSES Owned Sewer 109.0 M 290.8 M TOTAL INCLUDING WSES 571.8 M 1,649.2 M Table 3: Asset Inventory $ Consumed Values Asset % Consumed % Remaining Life Buildings 35.9 % 64.1 % Storm Drainage 21.7 % 78.3 % Machinery and Equipment 55.0 % 45.0 % Parks Structures/Land Improvements 22.2 % 77.8 % Transportation 23.7% 76.3 % Sanitary Sewer 27.3 % 72.7 % TOTAL 25.4 % 74.6 % WSES Owned Sewer 27.3 % 72.7 % TOTAL INCLUDING WSES 25.7 % 74.3 % Table 4: Asset Inventory % Consumed Values
Page 17
8
CITY OF LANGFORD | Asset Management & Long-Term Financial Plan SECTION 2: FINANCIAL FINDINGS
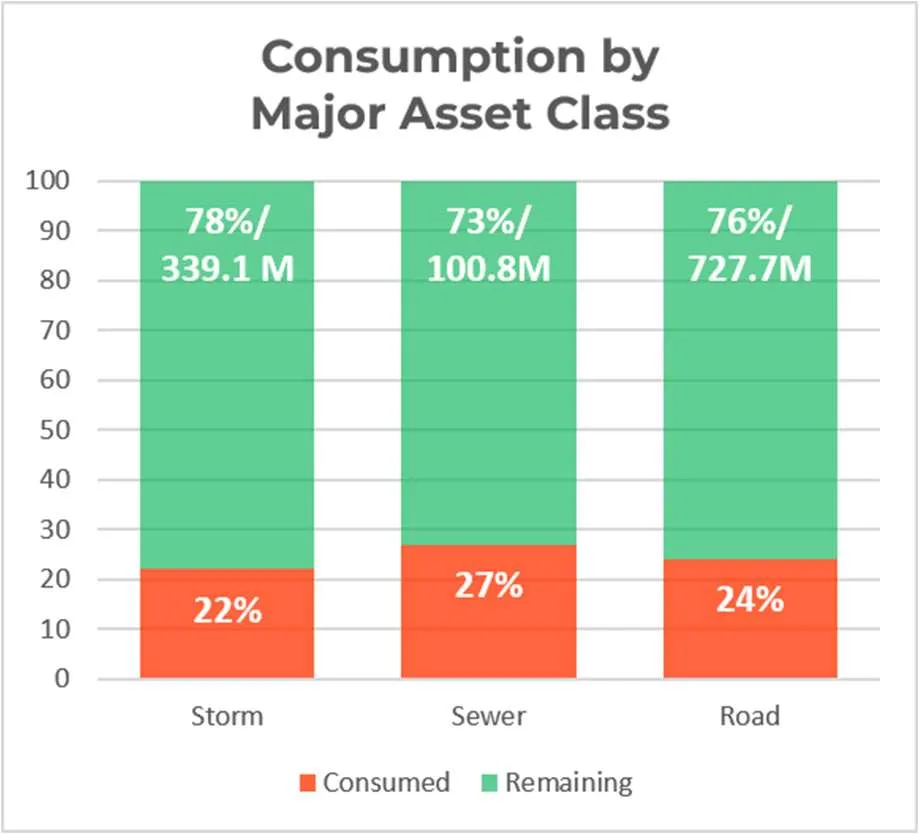
Figure 7: Consumption by Major Asset Class
The inventory consumption results indicate that Langford's major infrastructure systems remain in the earlier stages of their lifecycle, with significant remaining service life. Major renewal and replacement requirements are therefore not expected in the near term. These findings are supported by the condition assessment results presented in Section 4, which indicate that the majority of asset classes remain in good condition.
The City's relatively young asset base provides an opportunity to proactively build reserves before significant replacement cycles emerge. Establishing reserve contributions early and allowing funds to generate investment income over time can reduce future reliance on tax and utility rate increases while supporting long-term financial sustainability and intergenerational equity. KEY TAKEAWAY
Langford's major infrastructure assets remain relatively young, with between 73% and 78% of useful life remaining. This provides the City with an opportunity to proactively build reserves and prepare for future infrastructure replacement needs before significant renewal pressures emerge. EXCELLENT GOOD FAIR POOR VERY POOR FAILED Langford Average 26% Consumed 74% Remaining Figure 8: Langford average consumption with typical deterioration curve
Page 18
9
CITY OF LANGFORD | Asset Management & Long-Term Financial Plan SECTION 2: FINANCIAL FINDINGS 2.3. Sustainable Funding by Asset Class The Average Annual Asset Consumption (AAAC) represents the average annual amount of infrastructure value consumed as assets age and use a portion of their expected service lives. In asset management planning, AAAC is commonly used as a proxy for long-term infrastructure funding targets, representing the average annual investment required to sustain the asset portfolio at current service levels over its lifecycle. These funding targets can be achieved through a combination of annual tax-supported or utility-funded capital expenditures, transfers to reserve funds, and investment income generated from accumulated reserve balances. While actual renewal expenditures will vary from year to year, AAAC provides a useful benchmark for evaluating whether suƯicient funding is being set aside to support future infrastructure renewal and replacement requirements. Asset AAAC Buildings $3,315,300 Storm Drainage 5,894,700 Machinery and Equipment 1,152,200 Parks Structures/Land Improvements 528,500 Transportation 7,357,900 Sanitary Sewer 1,846,900 Total AAAC - Current City owned Infrastructure 20,095,500 WSES Sanitary Sewer Infrastructure 5,330,200 Total Potential AAAC 25,425,700 Table 5: Sustainable Funding by Asset Class The annual sustainable investment level of $25.4 million represents a long-term average intended to smooth infrastructure renewal requirements over time. The forecast presented later in this report reflects the timing of replacement needs based on the current age profile of the City's asset portfolio and is therefore expected to fluctuate from year to year. As a result, the sustainable funding target may exceed forecasted renewal expenditures in the near term when relatively few assets are expected to reach the end of their useful lives. Conversely, forecasted renewal expenditures may exceed the sustainable funding target in later years as larger cohorts of assets require rehabilitation or replacement during the same period. This difference highlights an important asset management principle: infrastructure renewal demand is not evenly distributed over time. Maintaining stable annual contributions to reserves during lower-demand years allows reserves and associated investment earnings to accumulate, helping fund periods of higher renewal activity in future years. This approach improves long- term financial sustainability and helps moderate future tax and utility rate increases when major replacement cycles begin to emerge.
Page 19
10
CITY OF LANGFORD | Asset Management & Long-Term Financial Plan SECTION 2: FINANCIAL FINDINGS 2.4. Current Funding Levels Sustainable funding is ongoing revenue that is dedicated to the renewal, rehabilitation, and replacement of existing infrastructure. Sources of sustainable funding may include property taxes, user fees, casino revenue, revenue-sharing agreements, and other recurring revenues that can be relied upon year after year. Sustainable funding is intended to preserve existing infrastructure and ensure that assets such can be repaired, renewed, or replaced as they age. It does not include funding for day-to-day operating costs, nor does it include funding for the construction of new infrastructure that expands services or capacity.
Sustainable funding also excludes one-time or temporary funding sources, such as project- specific grants, asset sales, and Development Cost Charges (DCCs). While DCCs can play an important role in financing growth-related infrastructure, they are intended to fund new or expanded infrastructure required to support development and generally cannot be used to replace existing assets.
The City has established several funding streams that can only be used for capital costs. However, these funding sources have not been clearly set aside for either replacing existing infrastructure or building new infrastructure. As a result, capital funding has generally been managed as a common pool of funding used to support a variety of capital priorities.
The City currently has the following funding streams dedicated to capital funding:
Funding Amount Transfer to Capital Fund $ 7.0 M Transfer to Equipment Reserve 1.0 M Transfer to Police Capital 0.1 M Transfer to Capital Works Fund 1.4 M Community Works Fund grant 2.2 M Debt Principal & Interest 3.2 M Roads Maintenance Budget 1.5 M Total Annual Capital Funding 16.4 M Less: funding dedicated to new capital (2.0) M Total Sustainable Funding 14.4M Table 6: Current Annual Capital Funding To assess whether the City has sustainable funding in place, capital funding must be separated between replacing existing infrastructure and building new infrastructure. Because this distinction has not always been made, assumptions have been used to estimate how much funding supports each purpose. This provides a reasonable basis for estimating the funding available to replace existing infrastructure in the future.
For the purpose of this analysis, it is assumed that the City will want to retain $2.0 million of the above revenue stream for the acquisition or construction of new capital. Based on this, the City’s current funding sustainability is estimated as follows:
KEY TAKEAWAY Sustainable funding is annual, ongoing funding dedicated to replacing existing assets, not building new capital. Estimated sustainable funding: $14.4 million annually.
Page 20
11
CITY OF LANGFORD | Asset Management & Long-Term Financial Plan SECTION 2: FINANCIAL FINDINGS 2.5. Annual Funding Gap Annual sustainable funding is estimated to be between $20.1 and 24.5M as outlined in Section 2.3. However, current funding is approximately $14.4 M (table 7). Therefore, the annual sustainable funding gap is estimated to be between $5.7 – 11.0M. For context, this is equivalent to a property tax increase of approximately 8.0% to 15.5%.
Table 7 Estimated Annual Funding Gap - Capital The City will be forced to close the funding gap via property tax increases or level of service reductions. There are limited options to reduce levels of service to meaningfully reduce this funding gap. Such property tax increases could be deferred for decades when major infrastructure replacement is forecasted (see figure 9). However, early investment in infrastructure funding reserves can help the City earn investment returns that can offset what would otherwise be property tax increases. Please see Section 3.4 and 3.5 for funding increase options and investment return projections.
Current Assets Including WSES assets Total Annual Capital Funding 16.4 M 16.4 M Less: Funding utilized for new capital (2.0) M (2.0) M Total annual Capital Replacement Funding 14.4 M 14.4 M Sustainable Annual Funding (AAAC table 5) 20.1 M 25.4 M Annual Funding Gap 5.7 M 11.0 M
Page 21
12
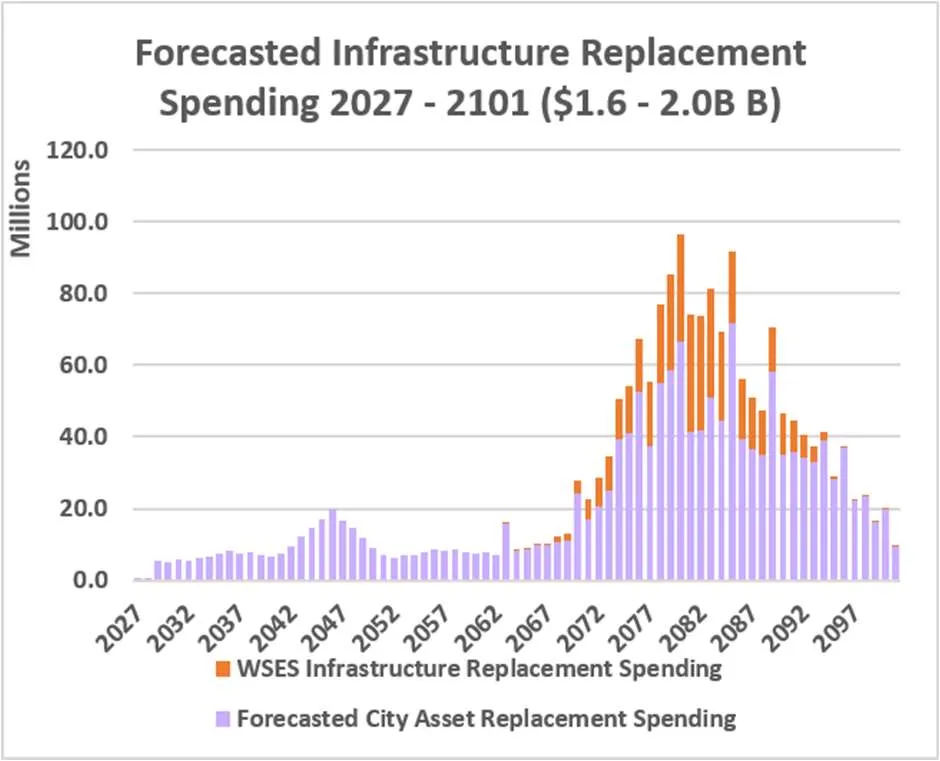
CITY OF LANGFORD | Asset Management & Long-Term Financial Plan SECTION 2: FINANCIAL FINDINGS 2.6. Lifecycle Spending Forecasts The City is forecasted to spend approximately $2.0 B (2026 dollars) over the next 75 years (2027-2101) on infrastructure replacement. This figure does not include new infrastructure acquired throughout that period. The City will need to prepare for this coming financial burden. Figures are expressed in nominal values without inflation applied so that the reader can understand the magnitude of the forecasts using current year dollar values. Forecasts are made over a 75-year period as all long-lived City assets should be replaced at least once over that timeframe.
Figure 9: Forecasted Infrastructure Replacement Spending 2027-2101
Infrastructure Forecasted Spending 2027-2101 Buildings 247.2 M Storm Drainage 432.5 M Machinery & Equipment 85.5 M Park Structures/Land Improvements 26.9 M Transportation 636.0 M Sanitary Sewer 138.5 M Total City owned Assets 1,566.6 M WSES Assets 399.7 M Total Forecasted Infrastructure Replacement 2027-2101 1,966.3 M Table 8: Forecasted Spending 2027-2101 by Asset Class
Page 22
13
CITY OF LANGFORD | Asset Management & Long-Term Financial Plan SECTION 2: FINANCIAL FINDINGS 2.7. Lifecycle Spending Funding Gap Forecasted spending over a 75-year lifecycle is $2.0B (section 2.6). Current funding over the same period would only support $1.1B, resulting in an approximate $900M lifecycle funding gap.
Figure 10: Forecasted Lifecycle Funding Gap 2027-2101 The spending forecast shown above is limited to the lifecycle costs of existing assets and excludes future growth-related capital investments. While most new infrastructure is funded and constructed by developers and supported through DCCs and ACCs, the City ultimately assumes responsibility for the operation, maintenance, rehabilitation, and replacement of these assets. A sustainable tax rate is therefore critical to supporting the long-term costs associated with growth. In addition, the City may elect to construct new infrastructure using municipal funds, in which case both the upfront capital costs and future lifecycle costs must be funded by the City. These costs have not been included in the forecast above. Primary Funding Included in Forecast? Existing Infrastructure Taxes, user fees, Investment Returns, Debt Yes Growth Related Infrastructure DCCs, ACCs, Developer donations No Improved Infrastructure Taxes, Debt No Table 9: Primary Funding Sources by Infrastructure Type
Cumulative Funding Gap $900M
Page 23
14
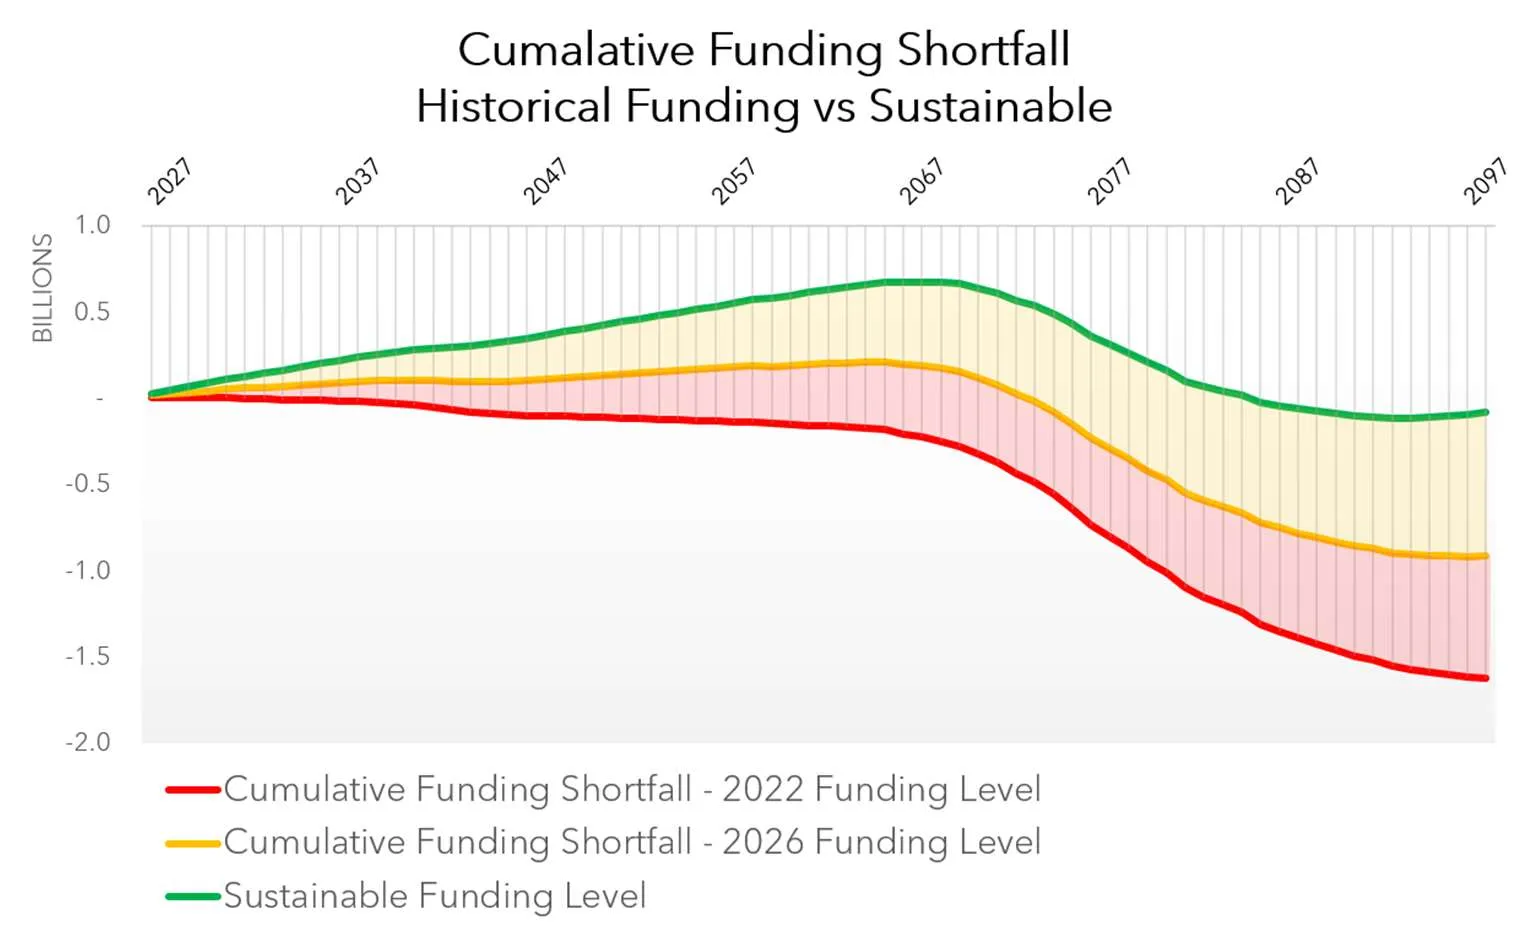
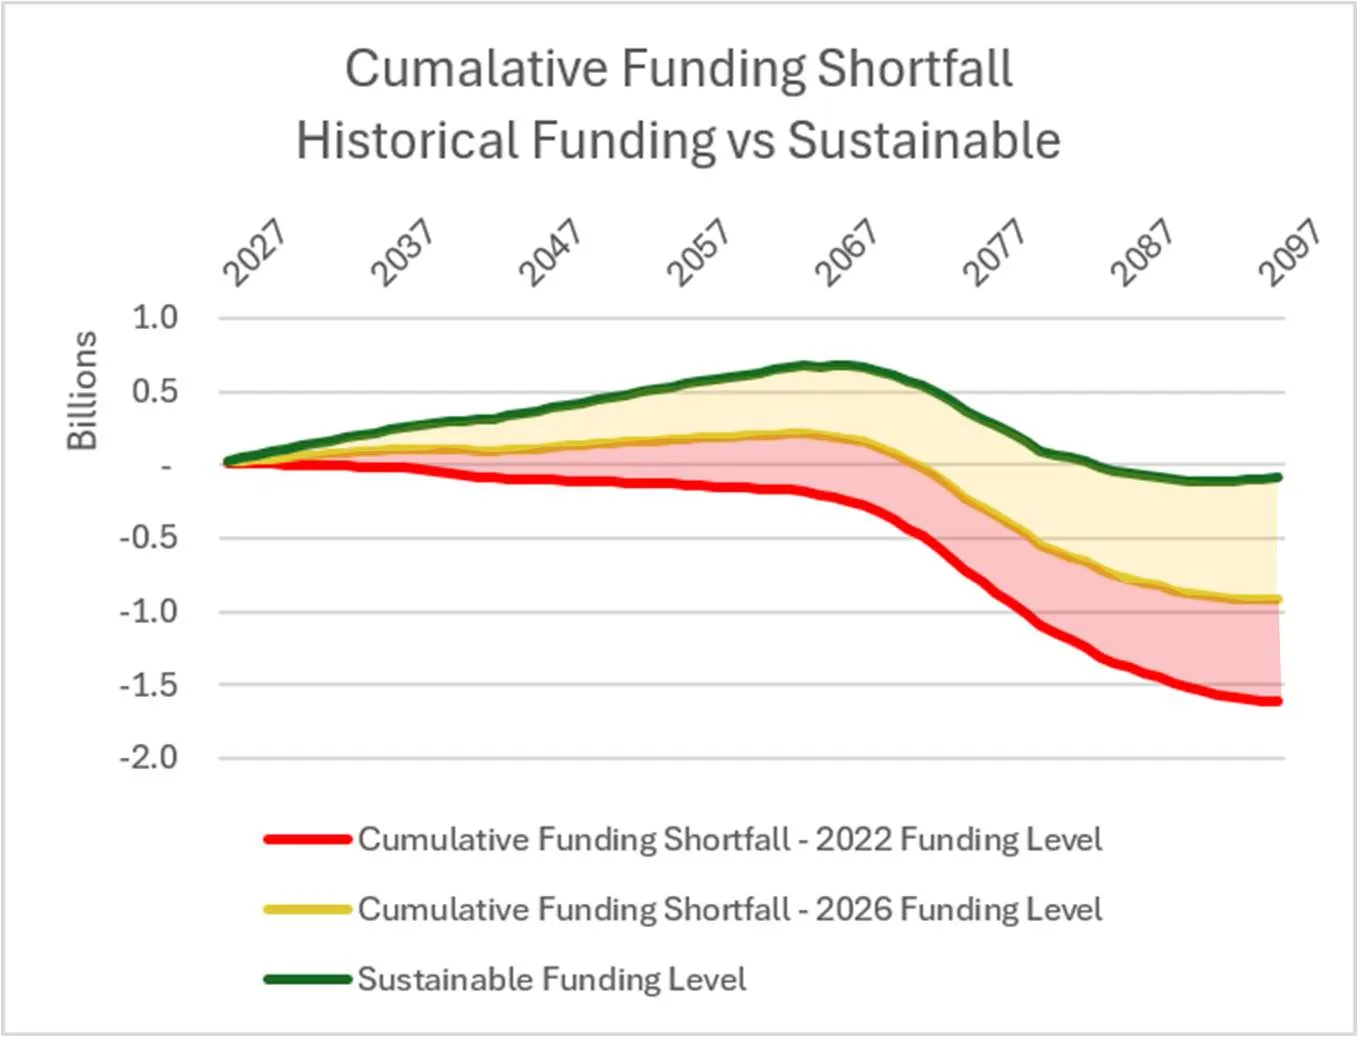
CITY OF LANGFORD | Asset Management & Long-Term Financial Plan SECTION 2: FINANCIAL FINDINGS 2.8. Funding Sustainability History In 2022, the City had approximately $4.6 million in annual funding available for infrastructure replacement, compared to estimated annual renewal requirements of $22.6 million. This resulted in an estimated annual funding gap of $18.0 million. If sustained over the long term, this funding level could have resulted in a lifecycle funding gap of approximately $1.4 billion. Year Annual Capital Funding Annual Capital Funding for Renewal AAAC Annual Funding Gap % Lifecycle Sustainability 2022 $ 6.6 M $ 4.6 M $ 22.6 M $ 18.0 M 20% 2023 $ 6.8 M $ 6.8 M $ 23.3 M $ 18.5 M 21% 2024 $ 10.7 M $ 8.7 M $ 24.0 M $ 15.3 M 36% 2025 $ 16.4 M $ 14.4 M $ 24.7 M $ 10.3 M 58% 2026 $ 16.4 M $ 14.4 M $ 25.4 M $ 11.0 M 57% Table 10: Funding Sustainability History 2022-2026 However, through successive tax increases, the City has closed the annual funding gap by $7.0M (table 9) and closed the lifecycle funding gap by over $742.5M.
Figure 11: Cumulative Funding Shortfall - Historical Fundings vs Sustainable
$825M $742M Funding Gap yet to be addressed Funding Gap addressed through 2022-2026 tax increases
Page 24
15
CITY OF LANGFORD | Asset Management & Long-Term Financial Plan SECTION 2: FINANCIAL FINDINGS
Figure 12: Long Term Funding Gap History
Figure 13: Sustainable Funding Progress 2022-2026
Funding Gap yet to be addressed Funding Gap addressed through 2022- 2026 tax increases
Page 25
16
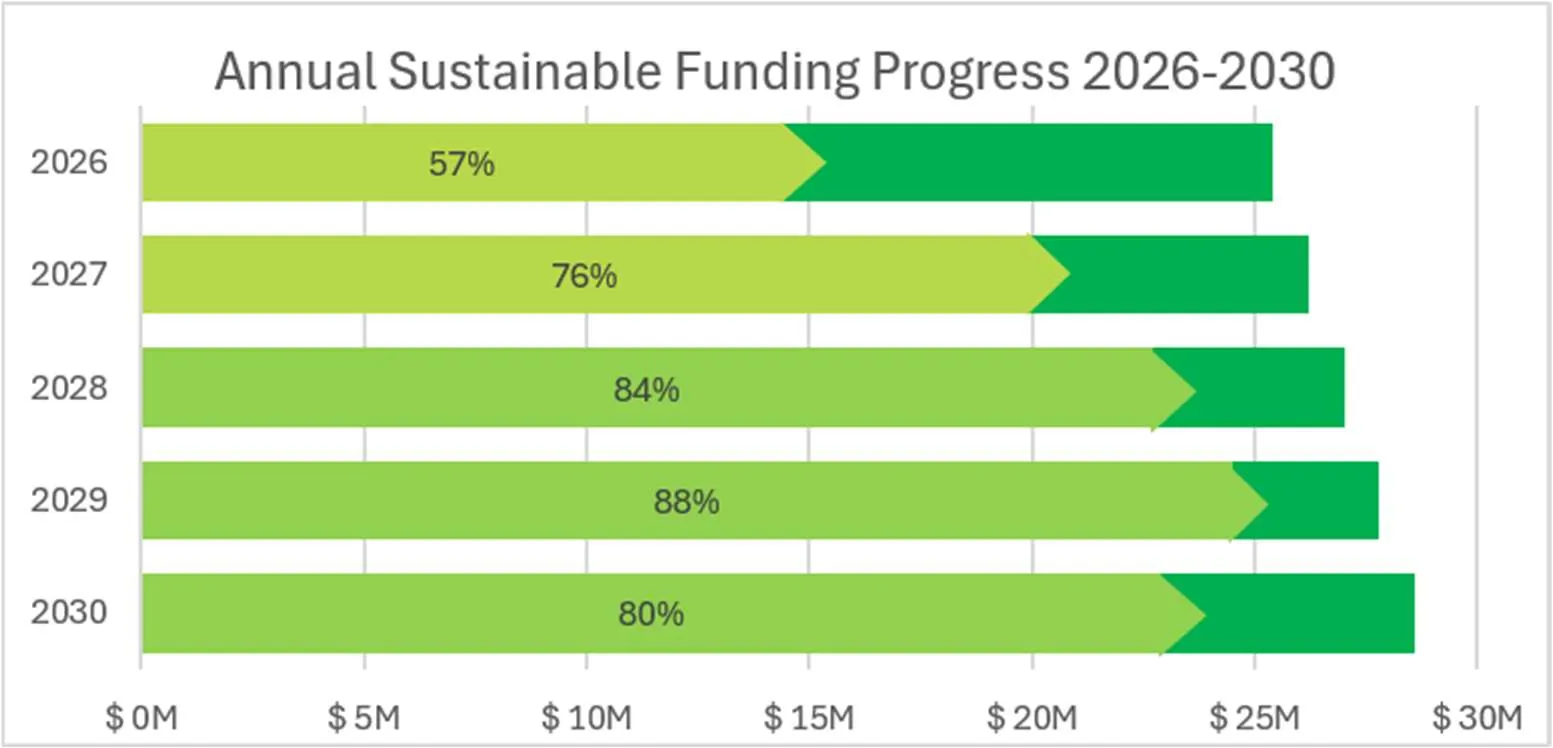
CITY OF LANGFORD | Asset Management & Long-Term Financial Plan SECTION 2: FINANCIAL FINDINGS 2.9. Forecasted Sustainability 2027-2030 The City of Langford's 2026-2030 Financial Plan demonstrates a positive step toward sustainable infrastructure funding, provided that the increased capital funding is directed primarily toward the renewal and replacement of existing infrastructure rather than the construction of new assets. The plan includes a significant increase in debt servicing costs to accelerate repayment of debt associated with the acquisition of the Langford Aquatic Centre. While this creates short- term budget pressure, it positions the City to benefit from increased financial flexibility once the debt burden declines. As debt servicing requirements are reduced in future years, the Financial Plan largely reallocates those funds to reserve contributions, strengthening the City's ability to fund future infrastructure replacement from internally generated sources. Although the City could choose to reduce taxation as debt is retired, maintaining these budget allocations for reserve funding would further advance its progress toward a sustainable asset management funding model. Building reserve balances also generates investment income, which can help offset future property tax and user fee increases that would otherwise be required to pay for infrastructure renewal and replacement. As a result, the strategy supports both long-term financial sustainability and greater intergenerational equity by ensuring today's assets are funded for tomorrow's needs.
Figure 14: Forecasted Sustainable Funding Progress 2026-2030 Year Annual Capital Funding for Renewal AAAC (Projected) Annual Funding Gap % Lifecycle Sustainability 2026 $ 14.4 M $ 25.4 M $ 11.0 M 57% 2027 $ 19.9 M $ 26.2 M $ 6.3 M 76% 2028 $ 22.7 M $ 27.0 M $ 4.3 M 84% 2029 $ 24.5 M $ 27.8 M $ 3.3 M 88% 2030 $ 22.9 M $ 28.6 M $ 5.7 M 80% Table 11: Forecasted Sustainable Funding Progress 2026-2030
Page 26
17
CITY OF LANGFORD | Asset Management & Long-Term Financial Plan SECTION 2: FINANCIAL FINDINGS Although the City is not projected to achieve a 100% sustainability rating by 2030, an estimated score of approximately 80% would likely place it ahead of the vast majority of municipalities in British Columbia. In addition, because a significant portion of the planned infrastructure funding is phased in over time, the City will have an opportunity to build reserve balances and generate investment income before the full funding requirements materialize. These investment returns will help reduce future funding gaps and support the City's progression toward fully sustainable lifecycle funding. As a result, the City may ultimately be able to achieve a fully sustainable funding model with less reliance on future property tax or user fee increases than would otherwise be required.
Page 27
18
CITY OF LANGFORD | Asset Management & Long-Term Financial Plan SECTION 2: FINANCIAL FINDINGS 2.10. Growth The City of Langford's Official Community Plan (OCP) is based on accommodating a future population of approximately 100,000 residents, representing an increase of roughly 42,000 residents from the 2024 population of just over 58,000. The OCP identifies a need for approximately 16,900 new homes by 2045, with approximately 40% to 50% of these homes already accommodated through existing zoning approvals and pre-committed growth areas. Rather than establishing a fixed planning horizon, the OCP uses a population-based approach focused on achieving a community of 100,000 residents. While significant growth is anticipated, this Asset Management and Long-Term Financial Plan does not include a detailed forecast of future growth-related infrastructure requirements. The City has undertaken a number of growth planning initiatives, including the Official Community Plan and Development Cost Charge (DCC) program; however, these initiatives are primarily intended to guide land use, housing, and growth-related capital funding decisions rather than quantify the full lifecycle implications of future infrastructure growth over the planning horizon of this Plan. As a result, this Plan focuses on the sustainability of existing infrastructure funding rather than modelling the future inventory of assets required to support growth. The City currently utilizes Development Cost Charges and is developing an Amenity Cost Charge (ACC) program to help ensure that a significant portion of the upfront capital cost of growth- related infrastructure is funded by new development rather than existing taxpayers. However, growth-related infrastructure creates obligations that extend well beyond initial construction. New assets require ongoing operation, maintenance, rehabilitation, and eventual replacement throughout their lifecycle. The most significant challenge facing the City is not forecasting the exact quantity of future infrastructure growth but ensuring that sufficient funding is available to maintain existing and future assets over the long term. This Plan addresses that challenge by establishing a sustainable funding framework for the existing asset portfolio. Once a sustainable tax-supported funding model is in place, the same principles can be applied to future growth and associated infrastructure assets. Conversely, if existing infrastructure continues to be funded at unsustainable levels, growth will widen funding gaps rather than solve them. Each new asset added to the City's inventory increases future maintenance, rehabilitation, and replacement obligations. As a result, improving funding sustainability for the existing asset portfolio is a critical prerequisite to successfully managing future growth. For this reason, the focus of this Plan is on establishing sustainable infrastructure funding rather than forecasting future growth-related infrastructure requirements.
Page 28
19
CITY OF LANGFORD | Asset Management & Long-Term Financial Plan SECTION 2: FINANCIAL FINDINGS 2.11. Sensitivity Analysis A sensitivity analysis has been conducted to help authenticate the broad findings of this plan. Broad findings include estimated annual sustainable funding, annual funding gap, and total replacement costs. The City used defensible assumptions, with the best information available when arriving at Plan findings. However, a sensitivity analysis was conducted by modelling a change in estimated useful lives of the City’s infrastructure. “Optimistic” assumptions are those that would increase useful lives, and “pessimistic” assumptions incorporate facility lifecycle capital maintenance forecasts. Overall, the sensitivity analysis confirms the City is facing an annual funding gap that will need to be addressed now or into the future Base Case Scenario Optimistic Scenario Pessimistic Scenario Estimated Useful Lives
- 0% +20% +0% Facilities Capital Maintenance Excluded Excluded Included Table 12: Sensitivity Analysis Parameter Modelling Base Case Scenario Optimistic Scenario Pessimistic Scenario AAAC – City Owned Infrastructure 20.1 M 17.6 M 24.2 M AAAC – Including WSES Infrastructure 25.4 M 22.1 M 29.5 M Annual Funding Gap – City Owned Infrastructure 5.7 M 3.2 M 9.8 M Annual Funding Gap – Including WSES Infrastructure 11.0 M 7.7 M 15.1 M Forecasted Spending 2027-2101 City Infrastructure 1.6 B 1.3 B 1.9 B Forecasted Spending 2027-2101 Including WSES Infrastructure 2.0 B 1.7 B 2.3 B Lifecycle Funding Gap ≈ $800 M ≈ $600 M ≈ $1,200 M % Annual Funding Sustainability ≈ 57% ≈ 65% ≈ 49% Table 13: Sensitivity Analysis Findings
Page 29
- FINANCIAL STRATEGY
SECTION 3 FINANCIAL STRATEGY
Page 30
21
CITY OF LANGFORD | Asset Management & Long-Term Financial Plan SECTION 3: FINANCIAL STRATEGY 3.1. Funding Increase Options The City has several options available to address the long-term infrastructure funding gap. Each option involves different trade-offs between affordability, timing, and long-term financial sustainability. Option 1: Build Reserves in Advance of Infrastructure Renewal Increase infrastructure funding proactively before major replacement expenditures occur. Contributions to reserves can be invested over time, generating investment returns that help fund future infrastructure replacement. This approach takes advantage of the power of compounding and typically results in the lowest long-term cost to taxpayers. Because investment earnings contribute toward replacement costs, the annual funding requirement may be lower than the Average Annual Asset Consumption (AAAC). The City has already begun implementing this approach. Under the current Five-Year Financial Plan, debt servicing costs associated with the Langford Aquatic Centre are expected to expire and be redirected toward infrastructure funding reserves. Should the City continue with this strategy, infrastructure funding sustainability is projected to reach approximately 80% of AAAC (see Section 2.9). At this funding level, reserve balances are expected to generate sufficient investment earnings over the lifecycle of the assets to fund a portion of future replacement costs, reducing the need to achieve funding levels equal to 100% of AAAC. Advantages Generates investment income to help fund future replacements Reduces reliance on debt financing Provides greater financial flexibility Results in lower long-term taxpayer costs Promotes intergenerational equity by smoothing tax and utility rate impacts over time Considerations Requires funding increases before major replacement needs materialize Requires ongoing discipline to maintain reserve contributions over the long term
Page 31
22
CITY OF LANGFORD | Asset Management & Long-Term Financial Plan SECTION 3: FINANCIAL STRATEGY Option 2: Defer Funding Increases Until Assets Require Replacement Maintain current funding levels and increase taxation when major infrastructure replacement projects occur. Under this approach, the City would likely need to borrow to finance significant replacement projects and repay the debt over time. Advantages Defers the financial impact on current taxpayers Maintains lower funding levels in the short term Considerations Borrowing costs and interest increase the total cost of replacement Debt repayment periods are generally shorter than asset lifecycles, creating higher annual funding requirements Future taxpayers face larger and more concentrated funding increases Current Funding Plan in Place In 2024, the City chose to finance the acquisition of the Langford Aquatic Centre using a five-year loan rather than a long-term amortization period. This approach was selected to reduce long-term borrowing costs and position the City to redirect debt servicing capacity toward infrastructure renewal funding sooner. The City's 2026-2030 Financial Plan reflects this strategy, with debt servicing costs increasing through 2029 before declining significantly in 2030. At that point, the City intends to redirect former debt servicing allocations to infrastructure reserve contributions, increasing forecast infrastructure funding sustainability to approximately 80% by 2030 (see Table 11, Section 2.9). If maintained, this strategy can materially reduce the long-term cost of funding infrastructure replacement for two reasons:
- Reduced Interest Costs Financing over a shorter repayment period results in lower total borrowing costs. Current Municipal Finance Authority indicative rates are approximately 3.63% for five-year financing compared to 4.30% for longer-term financing. Combined with the shorter repayment period, this approach is estimated to save approximately $15 million in interest costs compared to a traditional long-term amortization strategy.
- Earlier Reserve Funding and Investment Earnings By retiring debt earlier, the City can begin making meaningful reserve contributions sooner. This allows infrastructure reserves to accumulate and generate investment earnings for a longer period, helping offset future infrastructure replacement costs and reducing the tax increases that would otherwise be required to fund asset renewal and replacement.
Page 32
23
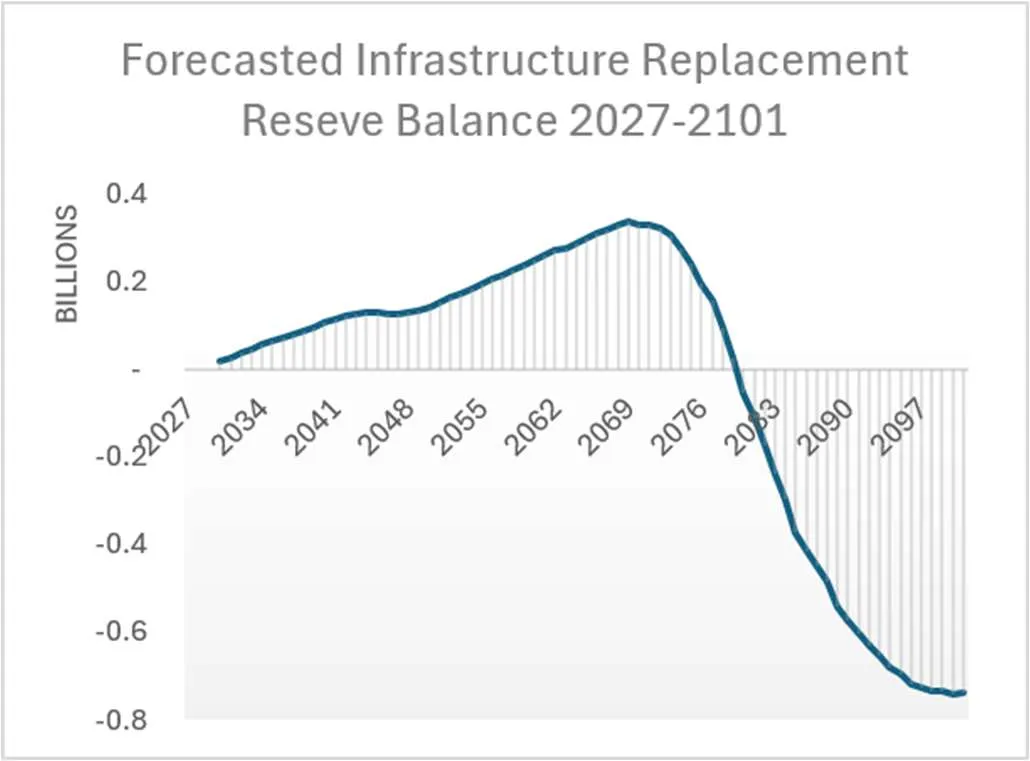
CITY OF LANGFORD | Asset Management & Long-Term Financial Plan SECTION 3: FINANCIAL STRATEGY Figure 15: Forecasted Infr. Replacement Reserves How Do the Financial Outcomes Compare (Build Reserves vs. Defer)? Under the deferred funding approach, infrastructure reserve balances are forecast to be fully depleted by approximately 2080 (Figure 15). At that point, reserve funding would no longer be sufficient to fund planned infrastructure renewal requirements and debt financing would be required to address the significant wave of asset replacements forecast to occur during the 2070s and 2080s (Figure 16).
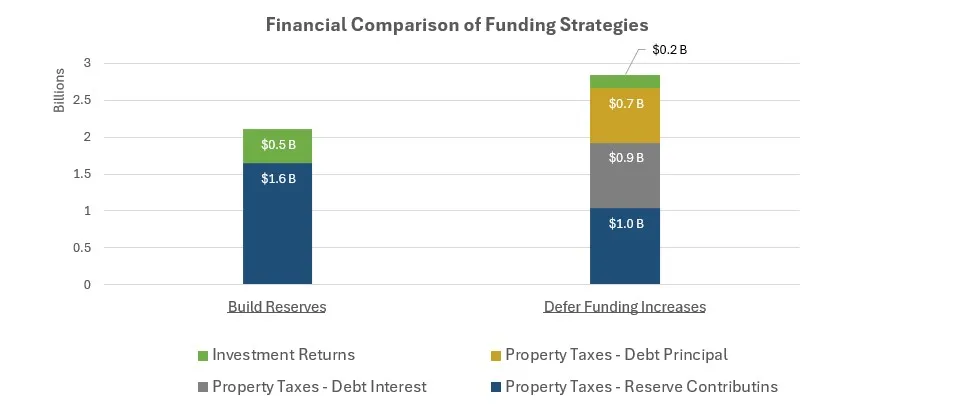
While debt financing can defer funding increases in the near term, it does not eliminate infrastructure replacement costs. Instead, future taxpayers must fund both asset replacement and the associated borrowing costs. As illustrated in Figure 17, the Defer Funding Increases option is projected to require approximately $2.6 billion in total taxpayer funding, including approximately $1.0 billion in reserve contributions, $0.7 billion in debt principal repayments, and $0.9 billion in debt interest. By comparison, the Build Reserves option is projected to require approximately $1.6 billion in total taxpayer funding through reserve contributions. Under this approach, accumulated reserves are projected to generate approximately $0.5 billion in investment earnings, reducing the amount that must ultimately be funded by taxpayers. Consequently, the Build Reserves option is projected to reduce long-term taxpayer funding requirements by approximately $1.0 billion compared to deferring funding increases.
Figure 17: Financial Comparison of Funding Strategies Figure 16: Forecasted Infr. Replacement Spending Debt Needed 1.6B Tax Funding 2.6B Tax Funding
Page 33
24
CITY OF LANGFORD | Asset Management & Long-Term Financial Plan SECTION 3: FINANCIAL STRATEGY Conclusion The analysis demonstrates that the build reserve approach provides a significantly lower long-term cost to taxpayers. While the defer funding approach reduces near-term reserve contributions, it results in substantial future debt principal and interest costs once infrastructure reserve balances are depleted. Over the asset lifecycle, the build reserve approach is projected to reduce total taxpayer funding requirements by approximately $1.0 billion, or 38%, compared to deferring funding increases. In addition to lowering long-term costs, the approach improves infrastructure funding sustainability and reduces future reliance on debt financing.
RECOMMENDATION Maintain the Build Reserve approach reflected in the 2026-2030 Financial Plan to fund future infrastructure renewal and replacement needs.
Page 34
25
CITY OF LANGFORD | Asset Management & Long-Term Financial Plan SECTION 3: FINANCIAL STRATEGY 3.2. Funding Dedication As discussed in Section 2.8, the City has made substantial progress toward improving the long- term sustainability of its infrastructure funding. Based on current funding levels, infrastructure replacement funding is estimated to be approximately 57% ($14.4M/$25.4M) sustainable if all infrastructure funding is directed toward existing asset renewal and replacement. In practice, however, a portion of this funding is currently being used to deliver new infrastructure, such as the City's infill sidewalk program. As a result, not all funding contributes directly to addressing existing infrastructure replacement needs. While the City currently has $16.4 million in annual capital funding sources, it is assumed that $2 million of this will be utilized for new infrastructure (see section 2.4, table 8). By way of illustration, each $1 million of annual funding contributes roughly 4% toward overall funding sustainability, redirecting $1 million from asset renewal to new infrastructure would reduce funding sustainability from approximately 57% to 53%. The long-term financial impact of this approach can be measured through forgone reserve growth and investment earnings. When infrastructure funding is redirected away from renewal activities, additional funding must be raised in future years to address replacement obligations, potentially resulting in higher future tax and utility rate increases. Therefore dedicating a portion of available capital funding to new infrastructure will ensure the City can maintain existing service levels.
RECOMMENDATION Dedicate $14.4M of the current infrastructure funding stream to existing infrastructure replacement or maintenance only.
Page 35
26
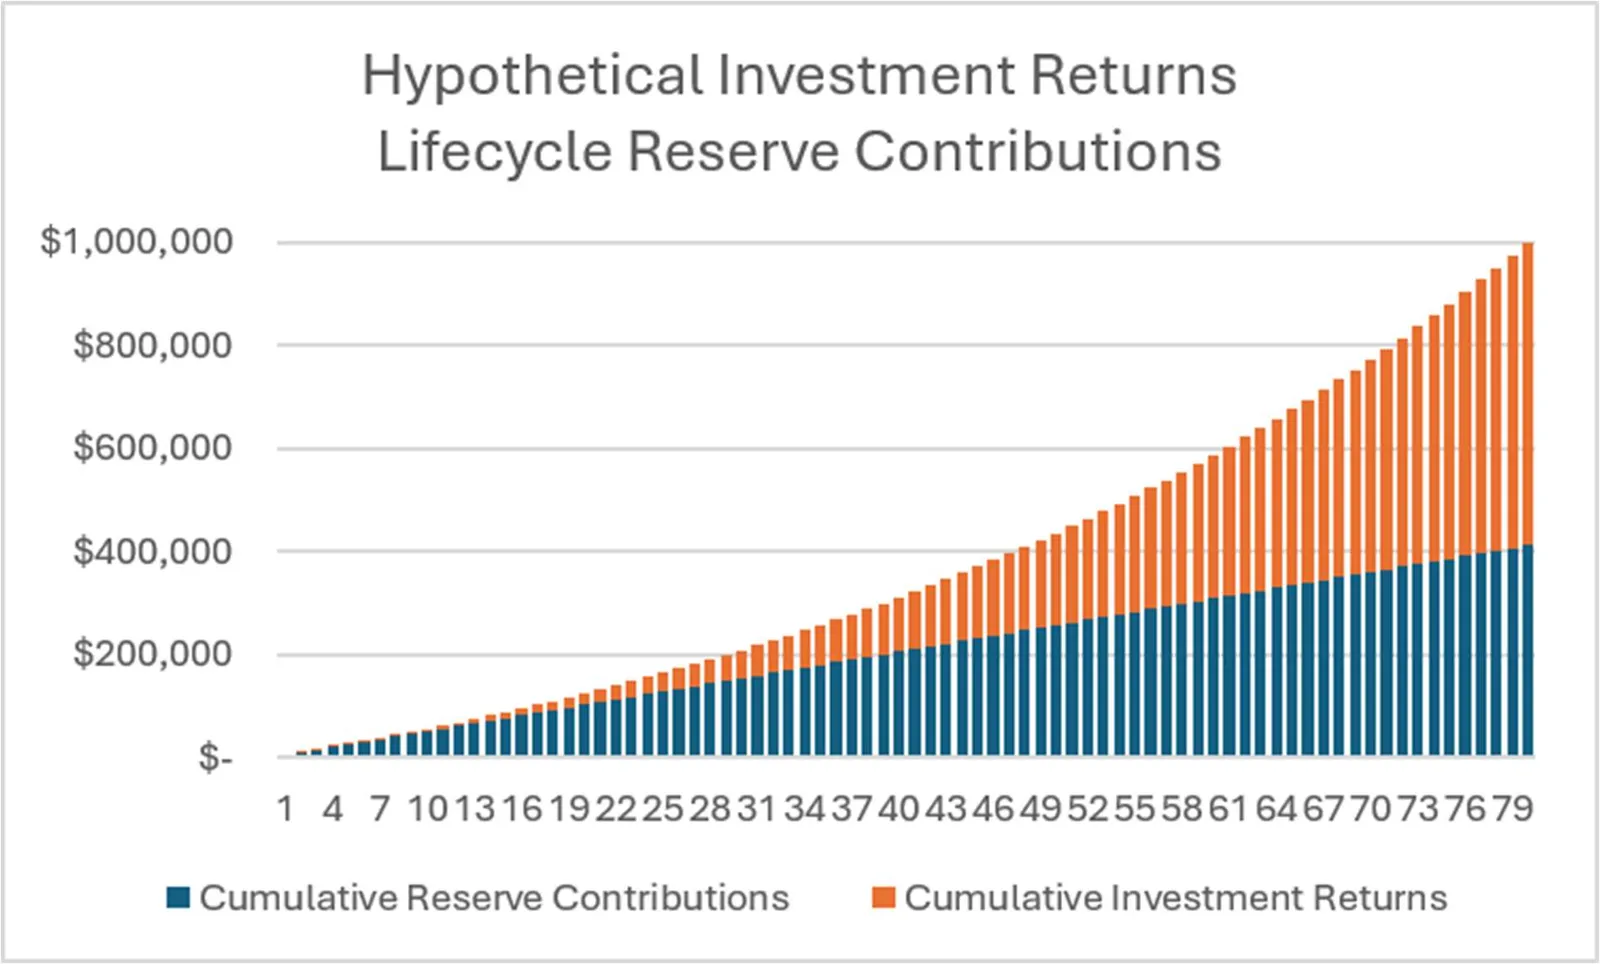
CITY OF LANGFORD | Asset Management & Long-Term Financial Plan SECTION 3: FINANCIAL STRATEGY 3.3. Reserves & Investment Strategy Potential investment returns are an important consideration when evaluating long-term funding options. Under the Community Charter and Local Government Act, investment earnings on reserve balances must remain within the reserve fund, allowing those earnings to directly support future infrastructure expenditures. As infrastructure funding needs can be volatile, a reserve fund strategy provides flexibility and helps stabilize property tax and user fee increases over time. This approach promotes intergenerational equity and can significantly reduce the amount of future funding that must be raised through taxation or user fees. Consider a hypothetical example. Suppose the City owns a pipe with an estimated replacement cost of $1,000,000 and an expected service life of 80 years. Without advance planning, the City would need to fund the full replacement cost when the asset reaches the end of its life, potentially requiring debt financing, significant tax increases, or the diversion of funds from other priorities. By making annual contributions to a lifecycle reserve throughout the asset's service life and investing those funds, the City would only need to contribute approximately $413,000. The remaining $587,000 would be generated through compounded investment returns, as illustrated below.
Figure 18: Compounding Investment Return Example
Page 36
27
CITY OF LANGFORD | Asset Management & Long-Term Financial Plan SECTION 3: FINANCIAL STRATEGY As a British Columbia municipality, the City is eligible to invest reserve funds through the Municipal Finance Authority's (MFA) Pooled Investment Funds. One such option is the Diversified Multi-Asset Class Fund, which has a long-term performance objective of generating returns approximately 2% to 3% above inflation. Assuming a long-term inflation rate of 3%, this corresponds to an expected return of approximately 5% to 6% annually. Under the same assumptions used in the previous example, the impact of investment earnings becomes even more significant. Total reserve contributions would be reduced to approximately $82,000, while the remaining $918,000 of the $1,000,000 replacement cost would be funded through compounded investment returns. While it would be unusual for a municipality to begin funding infrastructure replacement from the first year of an asset's service life, this example demonstrates the power of compounded investment returns as a funding source. It also highlights the importance of establishing reserve funding as early as practical, as earlier contributions can significantly reduce the overall cost borne by taxpayers over an asset's lifecycle. As discussed in Section 2.2, the City's asset portfolio is, on average, only 26% consumed, indicating that many assets remain relatively early in their service lives. This presents an opportunity to establish proactive funding strategies before major replacement obligations arise. In practice, municipalities often begin building reserves partway through an asset's life. Even when this example is revised to assume a 50-year contribution period rather than 80 years, investment returns still account for a substantial share of the eventual replacement cost, demonstrating the effectiveness of long-term reserve funding and investment strategies. 80 Year Contribution 50 Year Contribution Investment Return Cumulative Reserve Contributions Cumulative Investment Returns Cumulative Reserve Contributions Cumulative Investment Returns 2% $ 413,000 $ 587,000 $ 828,000 $ 172,000 5% $ 82,000 $ 918,000 $ 414,000 $ 586,000 Table 14: Lifecycle Reserve Investment Returns RECOMMENDATION Develop an investment policy that aligns with the City’s approach to long-term infrastructure reserve funding. THE POWER OF COMPOUNDING $587,000 Investment Earnings 59% of the replacement cost funded through investment returns
Page 37
28
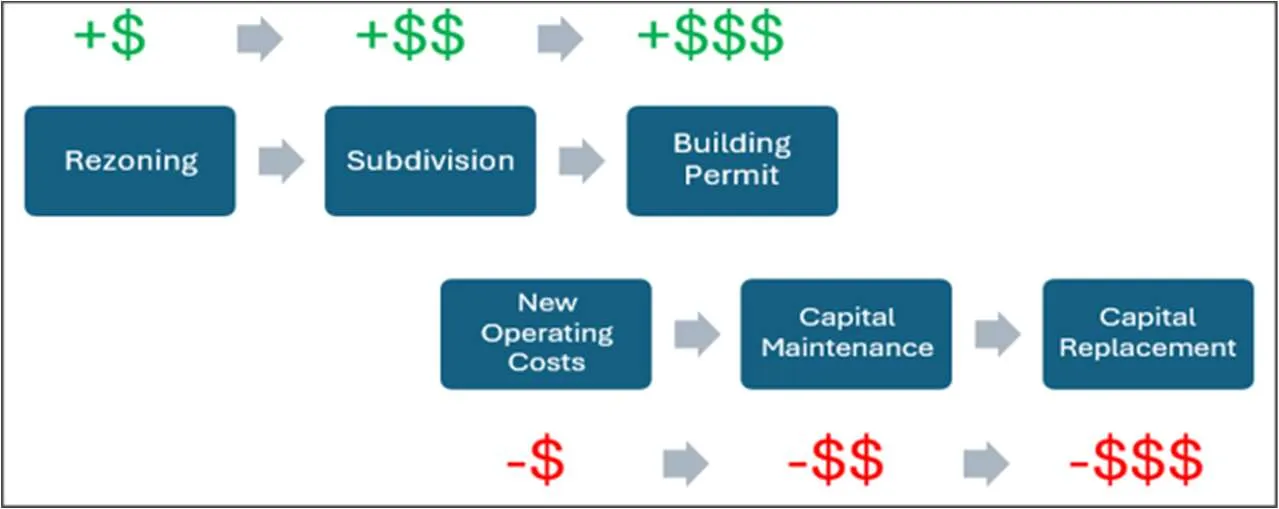
CITY OF LANGFORD | Asset Management & Long-Term Financial Plan SECTION 3: FINANCIAL STRATEGY 3.4. Non-Market Change Revenue Policy Non-market change refers to property tax revenue generated from new development that did not exist on the assessment roll in the previous year. For example, when a property is subdivided and a new home is constructed, that home begins paying property taxes for the first time. The resulting tax revenue is considered non-market change revenue in the first year. Municipalities track non-market change separately because it represents community growth. As properties are subdivided and developed, they are serviced with municipal infrastructure before build-out occurs. Roads, sewer systems, drainage infrastructure, sidewalks, parks, and other municipal assets are expanded or added to accommodate development. Once these assets are accepted by the municipality, they become part of the municipal asset inventory and create ongoing operating, maintenance, rehabilitation, and replacement obligations. Growth also increases demand for municipal services as new residents and businesses are added to the community. While growth creates new tax revenue, it also creates long-term financial obligations. A key challenge is that new tax revenue is typically received before many of the related costs occur. Operating costs often increase gradually over time, while infrastructure renewal and replacement costs may not arise for decades. As a result, revenues are generally received upfront, whereas many costs are deferred into the future. This timing difference can make a growing community appear more financially sustainable in the short term than it actually is. Although new development generates immediate revenue, municipalities should ensure that a portion of that revenue is available to fund the future operating, maintenance, renewal, and replacement costs associated with growth-related infrastructure.
Figure 19: Timing DiƯerence: New Development Tax Revenue and Lifecycle Costs
KEY TAKEAWAY
Growth creates near- term tax revenue while many lifecycle costs are deferred for decades
Page 38
29
CITY OF LANGFORD | Asset Management & Long-Term Financial Plan SECTION 3: FINANCIAL STRATEGY Langford has experienced significant growth since incorporation in 1992. As a result, the community has received significant non-market change revenue year after year. However, as figure 9 shows, the infrastructure obligations are accumulating and will likely come due during a concreated period in the future. Notably, Langford has been successful in building and maintaining a strong non-residential tax base. Between 2005 and 2026, the City's non-residential tax base increased by 29%. By comparison, the aggregate non-residential tax base of all other municipalities in British Columbia declined by approximately 2% over the same period. Further highlighting this achievement, 110 of the 154 municipalities in existence in 2005 experienced a reduction in their non-residential tax base during that timeframe. 1 This is significant because non-residential properties typically generate higher property tax revenues per dollar of assessed value than residential properties. For instance, business class assessment can generate 2.57 times the property tax revenues per dollar of assessed values in 2026 (see table 15). As a result, growth in the non-residential tax base can play an important role in oƯsetting the operating, maintenance, and lifecycle costs associated with growth. Tax Rate 2026 General Municipal Tax Rate Tax Rate Residential Multiple Residential 2.96074 1.00 Utilities 22.24554 7.51 Major Industry 9.44921 3.19 Light Industry 8.10918 2.74 Business 7.60970 2.57 Table 15: 2026 Tax Rate Multiples
1 Source: Province of British Columbia, Municipal Tax Rates and Tax Burden Statistics, Assessed Values (Schedule 701), 2005 and 2025 reporting years. Analysis based on municipal non-residential assessed values reported by the Province RECOMMENDATION Create a policy in the annual Five Year Financial Plan Bylaw which dedicates a portion of non-market change revenues to funding future operating, maintenance, and lifecycle replacement costs associated with growth.
Page 39
30
CITY OF LANGFORD | Asset Management & Long-Term Financial Plan SECTION 3: FINANCIAL STRATEGY 3.5. Lifecycle Costing Analysis Policy Development lifecycle costing is an important tool for evaluating the long-term financial sustainability of land use decisions. The analysis estimates the ongoing revenues generated by a proposed development, such as property taxes and user fees, and compares them to the long- term costs of servicing that development, including operating, maintenance, rehabilitation, and replacement costs. Asset Management BC's Land Use Planning and Asset Management Primer identifies land use planning and asset management as "inextricably linked" and notes that decisions regarding the location, density, scale, and form of development can have significant implications for infrastructure affordability and service sustainability. The guidance recommends that lifecycle costs be explicitly considered when evaluating major land use changes, including Official Community Plan amendments, neighbourhood plans, and significant rezoning applications.
This approach aligns with Langford Council's Strategic Plan, which emphasizes sustainable development, financial stability, and the careful management of public assets. As Langford continues to accommodate growth and evaluate future development opportunities, understanding the full lifecycle implications of land use decisions will become increasingly important. Development lifecycle costing can help Council identify potential funding gaps, evaluate the long-term affordability of growth, and make more informed decisions regarding infrastructure investment, growth management, and service delivery.
2 Source: Asset Management BC, UBCM & Province of British Columbia, Land Use Planning and Asset Management: A Sustainable Service Delivery Primer (2019).
Land use planning has direct and long-lasting impacts on service sustainability and lifecycle costs. 2 Asset Management BC, 2019 RECOMMENDATION Develop a policy requiring development lifecycle costing analysis for major land use decisions.
Page 40
31
CITY OF LANGFORD | Asset Management & Long-Term Financial Plan SECTION 3: FINANCIAL STRATEGY 3.6. Road Network Funding Strategy The City's 2023 Pavement Management Report identified that current road funding levels are insufficient to maintain the long-term condition of the road network. The analysis evaluated several funding scenarios and concluded that approximately $5.0 million annually is required to maintain the network at its current average Pavement Quality Index (PQI) and prevent the continued growth of the rehabilitation backlog. The report found that the City's current funding level of approximately $2.0 million annually would result in a gradual decline in overall pavement condition over time, with an increasing proportion of roads falling below acceptable service levels. By comparison, annual funding of approximately $5.0 million would maintain the current average network condition and limit the accumulation of deferred maintenance. The City currently transfers approximately $7.0 million annually to capital reserves. Redirecting approximately $3.5 million of these reserve contributions to pavement rehabilitation and preservation activities would increase annual road funding from approximately $2.0 million to the recommended $5.0 million level identified in the Pavement Management Report. Importantly, this approach would not require a property tax increase, as it would utilize existing funding capacity already included within the City's financial plan. While this recommendation would reduce the amount currently being transferred to reserves, it would support the preservation of the City's largest asset class and help avoid more costly reconstruction requirements in the future. Maintaining pavement condition through timely rehabilitation is generally recognized as one of the most cost-effective infrastructure investment strategies available to municipalities.
RECOMMENDATION Increase annual road funding to $5.0M by reallocating reserve contributions to maintain current pavement condition.
Page 41
32
CITY OF LANGFORD | Asset Management & Long-Term Financial Plan SECTION 3: FINANCIAL STRATEGY 3.7. Sewer Utility Financial Sustainability The City of Langford's sanitary sewer system operates under a unique ownership and service delivery model. While the City owns approximately 48 km of sanitary sewer infrastructure, the majority of the collection system, approximately 138 km of sewer mains, is currently owned and operated by West Shore Environmental Services (WSES) under the existing franchise agreement. As a result, a significant portion of the City's sewer infrastructure lifecycle obligations currently reside outside of direct municipal ownership. Although WSES currently owns and maintains most of the sewer assets, the franchise agreement includes provisions that may result in the transfer of these assets back to the City in the future. As a result, the City may ultimately assume responsibility for both the acquisition cost and the long-term operation, maintenance, rehabilitation, and replacement of a substantial sewer infrastructure portfolio. This creates several long-term financial and operational considerations. Future ownership of the sewer system could expose the City to significant lifecycle replacement liabilities, require dedicated utility funding strategies, and necessitate the development of internal operational and asset management capacity. In addition, uncertainty regarding the timing, purchase price, and future condition of the system makes it difficult to fully assess long-term funding requirements within the context of this Asset Management and Long-Term Financial Plan. Given the importance of these issues, a dedicated review of the long-term sustainability of the sewer utility is warranted. Such a review should evaluate future ownership scenarios, acquisition costs, lifecycle replacement obligations, utility rate requirements, reserve funding strategies, and governance options. The study would provide Council with a clearer understanding of the long- term financial implications associated with the sewer system and support informed decision- making regarding future utility management.
RECOMMENDATION Undertake a Sewer Utility Sustainability Study to evaluate long-term ownership, lifecycle funding requirements, and utility rate sustainability
Page 42
- ASSET CONDITION ASSESSMENT
SECTION 4 ASSET CONDITION ASSESSMENT
Page 43
34
CITY OF LANGFORD | Asset Management & Long-Term Financial Plan SECTION 4: ASSET CONDITION ASSESSMENT As a relatively young municipality, the City of Langford benefits from having the majority of its infrastructure still within the first half of its expected useful life. As a result, most asset classes remain in good overall condition and continue to provide acceptable levels of service. To support long-term service delivery and informed capital planning, the City monitors asset condition through a combination of formal condition assessments, operational inspections, and age-based deterioration modelling. Where detailed condition information is not available, asset condition is estimated using asset age and remaining useful life assumptions. As additional condition data becomes available, these estimates can be refined to improve lifecycle planning and investment decision-making.
Figure 20: Estimated Position of City Assets on the Deterioration Curve Figure 20 illustrates the City's overall position on a typical infrastructure deterioration curve. Based on the current asset inventory, approximately 26% of the portfolio's useful life has been consumed, leaving approximately 74% of useful life remaining. The City's average position falls within the Good condition range, reflecting the relatively young age of much of Langford's infrastructure and indicating that the municipality remains in a favourable position to emphasize preventative maintenance and timely rehabilitation activities.
EXCELLENT GOOD FAIR POOR VERY POOR FAILED Langford Average 26% Consumed 74% Remaining
Page 44
35
CITY OF LANGFORD | Asset Management & Long-Term Financial Plan SECTION 4: ASSET CONDITION ASSESSMENT 4.1. Condition Assessment Overview The City currently employs a variety of condition assessment practices across its asset classes: Roads: A comprehensive pavement condition assessment was completed as part of the 2024 Pavement Management Program and serves as the primary tool for identifying rehabilitation and renewal priorities. Sidewalks: Staff undertake annual visual inspections to identify safety hazards and maintenance requirements. Stormwater Infrastructure: CCTV inspections are performed on portions of the drainage network to identify defects and support maintenance planning; however, a formal condition rating framework such as PACP has not yet been implemented. Buildings and Technology Assets: Formal facility condition assessments and Facility Condition Index (FCI) evaluations have not yet been completed. Consequently, these assets are currently assessed using age-based methodologies and staff knowledge of asset performance. 4.2. Current Asset Condition Ratings Asset conditions are categorized based on the estimated proportion of remaining value relative to replacement value. Assets with more than 66% of their useful life remaining are generally considered Good, assets with between 33% and 66% remaining are considered Fair, and assets with less than 33% remaining are considered Poor. The City's overall infrastructure portfolio is currently assessed as being in Good condition. This result is largely attributable to the relatively young age of the City's infrastructure network. Roads represent the only major asset class currently rated as Fair, while technology-related assets are approaching the end of their expected service lives and are rated Poor.
Asset Category Average Condition Buildings and Structures GOOD Storm Drainage GOOD Transportation (excluding roads) GOOD Vehicles and Equipment GOOD West Shore Parks and Recreation GOOD Roads FAIR Technology and Misc. OƯice POOR Overall Condition Score GOOD Table 16: Asset Condition Assessment Summary
Page 45
36
CITY OF LANGFORD | Asset Management & Long-Term Financial Plan SECTION 4: ASSET CONDITION ASSESSMENT 4.3. Road Network Condition Roads represent the City's most extensively assessed asset class and provide the clearest indication of the overall state of municipal infrastructure. The pavement condition assessment found that Langford's road network is generally in fair condition, with an overall Pavement Quality Index (PQI) score of approximately 67. Surface condition and structural adequacy were found to be relatively strong, indicating that most roads continue to provide acceptable service and retain sufficient structural capacity to accommodate anticipated traffic demands. The assessment identified that approximately 82 percent of the network currently meets established service level targets, while approximately 18 percent of road assets have fallen below target condition thresholds and will require rehabilitation or renewal interventions in the future. Although the network remains generally serviceable, condition varies across roadway classes, with major roads exhibiting lower average condition ratings than collector and local roads. This reflects the higher traffic volumes and accelerated deterioration experienced on key transportation corridors. The pavement assessment concluded that the City's road network is currently providing an acceptable level of service; however, rehabilitation requirements are expected to increase as the network ages. These findings reinforce the importance of continued investment in pavement preservation and timely rehabilitation activities to avoid future increases in renewal backlogs and lifecycle costs.
Page 46
- LEVELS OF SERVICE
SECTION 5 Levels of Service
Page 47
38
CITY OF LANGFORD | Asset Management & Long-Term Financial Plan SECTION 5: LEVELS OF SERVICE
Levels of Service (LOS) define the specific quality, reliability, and frequency of services provided by the City to its residents. Establishing clear LOS is critical because it bridges the gap between community expectations and financial sustainability; it allows the City to measure performance, prioritize infrastructure investments, and ensure that tax dollars are allocated to maintain assets at acceptable standards. TRANSPORTATION Service levels for the road network are established by the Engineering and Public Works Department and governed by Streets and Traffic Bylaw No. 2233. Operational Standards: LOS for seasonal activities, such as snow clearing, are defined by a priority list that targets high-volume major and collector streets first. Maintenance Execution: While the City retains oversight, the physical execution of road repairs and infrastructure support is managed through a contract with Victoria Contracting and Municipal Maintenance Corporation. WATER The establishment of water service levels depends on the location within the City: General City: The Capital Regional District (CRD) Infrastructure Operations division establishes the LOS and operates the drinking water system. Westhills Development: This area operates under a "distributed utility" model where Sustainable Services Ltd. (SSL) manages specialized water and energy utility systems. SEWER Levels of service for the sanitary sewer system are formally established within a private operating agreement with West Shore Environmental Services (WSES). Performance Metrics: The agreement defines specific standards for customer call responses, issue resolution, and emergency response times. Accountability: To ensure these service levels are met, the agreement includes financial penalties for non-compliance.
Page 48
39
CITY OF LANGFORD | Asset Management & Long-Term Financial Plan SECTION 5: LEVELS OF SERVICE PARKS AND RECREATION FACILITIES For a significant portion of Langford’s recreational infrastructure, LOS is established through a multi-municipal Operating, Maintenance and Management Agreement. Shared Management: The West Shore Parks & Recreation Society (WSPRS) manages these services for its five member municipalities. Scope: This agreement covers the maintenance of 44 hectares of diverse facilities, including the Q Centre Arena, aquatic centers, and specialized sports fields. MUNICIPAL BUILDINGS The City's Parks, Recreation, and Facilities Department is responsible for the overall sustainability and safety of public assets, including municipal buildings.
Page 49
40
CITY OF LANGFORD | Asset Management & Long-Term Financial Plan SECTION 6: RISK MANAGEMENT 6. RISK MANAGEMENT The City currently does not have a standardized risk assessment framework or a formalized ranking process (such as a 1 to 5 scale) across all asset classes. At present, the risk of asset failure is managed in an ad hoc manner as part of the broader capital planning process. Implementing a standardized system is recognized as a future opportunity to better prioritize investments across different types of infrastructure.
Page 50
- DETAILED ASSET INVENTORY
SECTION 7 DETAILED ASSET INVENTORY
Page 51
42
CITY OF LANGFORD | Asset Management & Long-Term Financial Plan SECTION 7: DETAILED ASSET INVENTORY 7.1. Transportation The City of Langford’s transportation infrastructure is currently undergoing a significant transition from a vehicle-centric model to a multi-modal "Active Transportation" system. Managed by the Engineering Department under the 2025 Transportation Master Plan, the network focuses on accommodating the city’s rapid growth through densification and improved safety. The system is anchored by major corridors including Langford Parkway, Jacklin Road, Goldstream Avenue, and Millstream Road, which connect the urban core to the Trans-Canada Highway. Transportation Inventory The city's paved road network includes approximately 191,000 metres of roads, which result in approximately 2 million square metres of pavement surface. In addition to the road surfaces, the City's transportation portfolio includes: Pedestrian Infrastructure: A comprehensive network of sidewalks, multi-use paths, trails, connectors, stairs, ramps, and bridges, all tracked by length. Curbs: An extensive inventory featuring mountable, non-mountable, inverted gutter, median island, extruded concrete, and extruded asphalt types. Traffic Signs: Various categories including regulatory (stop, yield), parking, school and pedestrian, warning, and guide signs. Streetlights: Fixtures consist primarily of post top and cobra style units. Street Furniture: Miscellaneous benches and bike racks.
Road Classification Quantity Replacement Cost Annualized Cost Local 128,884 m 463,980,800 Collector 45,459 m 222,748,300 Arterial 16,406 m 103,357,300 TOTAL ROAD 190,749 m 790,086,400 5,000,000 Curb & Gutter 235,912 m 120,786,700 1,610,500 Sidewalks 123,671 m 31,628,900 421,700 Streetlights 3,806 ea 11,400,000 325,700 TOTAL TRANSPORTATION 953,902,000 7,357,900 Table 17: Transportation System Detailed Inventory
Page 52
43
CITY OF LANGFORD | Asset Management & Long-Term Financial Plan SECTION 7: DETAILED ASSET INVENTORY Transportation Spending Forecasts In 2023, the City of Langford retained Stantec Consulting Ltd. to complete a comprehensive assessment of the City's paved road network and develop a pavement management plan. The study evaluated approximately 187 km of paved roads, measured current pavement condition, projected future deterioration, and modelled the impacts of various funding strategies over a ten-year period. The assessment found that the overall road network is currently in fair condition, with a Pavement Quality Index (PQI) of 67, and approximately 18% of the network already requiring rehabilitation. Budget Scenario Analysis To understand the long-term implications of pavement investment decisions, Stantec modelled three funding scenarios.
- Current Funding Scenario ($15 Million over 10 Years) This scenario reflected the City's 2023 pavement budget. While the current funding level allowed some maintenance and rehabilitation work to occur, it is insufficient to keep pace with pavement deterioration. Under this approach, the overall network condition is projected to decline from a PQI of approximately 65 in 2024 to 56 by 2033, while the percentage of deficient roads increases from 19% to between 27% and 29%. In practical terms, this represents a managed decline in road conditions and the continued growth of the maintenance backlog.
- Maintain Current Condition Scenario ($50 Million over 10 Years) Stantec estimates that approximately $50 million over ten years would be required to maintain the network at its current average condition. Under this scenario, the overall PQI remains stable at 67 and the percentage of deficient roads decreases slightly to approximately 13% by 2033. This approach does not significantly improve road conditions but prevents further deterioration and limits the accumulation of deferred maintenance.
- Enhanced Service Level Scenario ($71 Million over 10 Years) The highest funding scenario assumes that roads are rehabilitated whenever they reach the point where treatment is recommended. This would require approximately $71 million over ten years. Under this approach, the network PQI improves to approximately 76 and the percentage of deficient roads falls to less than 1%. While this option provides the best long-term pavement performance and effectively eliminates the rehabilitation backlog, it requires a substantially greater capital investment.
Page 53
44
CITY OF LANGFORD | Asset Management & Long-Term Financial Plan SECTION 7: DETAILED ASSET INVENTORY Key Takeaway As this plan assumes that the City wishes to maintain existing levels of service, it has selected scenario 2 ($50M over 10 years, or $5M/year) as the sustainable target. This figure has been factored into the AAAC calculation.
Page 54
45
CITY OF LANGFORD | Asset Management & Long-Term Financial Plan SECTION 7: DETAILED ASSET INVENTORY 7.2. Parks & Recreation The City of Langford’s parks and recreation portfolio includes extensive municipal assets, as well as a share of regional facilities managed by the West Shore Parks & Recreation Society (WSPRS). Shared Society Facilities (WSPRS) WSPRS manages a 44-hectare regional recreation site featuring a wide range of indoor and outdoor infrastructure. Major buildings include the West Shore Recreation Complex (aquatic centre, arena, and daycare), The Q Arena, the Senior Citizens’ Centre, and the Juan de Fuca Branch Library. The site also features a 9-hole par-3 golf course, four tennis courts, three beach volleyball courts, a 333 m asphalt velodrome, and a BMX track with a specialized starting shelter. Additional amenities include three ball diamonds with scorekeeper booths and concessions, a lacrosse box, basketball courts, and an accessible 2.8 km jogging trail. A community skate park, completed in 2023, further enhances the site’s specialized offerings. Recreational and Cultural Facilities The City also supports major recreational and cultural destinations, including City Centre Park and Starlight Stadium, a large complex featuring a dry floor arena and the Sportsplex (expanded in 2019). These facilities incorporate specialized infrastructure such as video screens, press boxes, bleachers, and changerooms. Additional specialized centres include the Al Cherron Centre (Rugby Building) and the Jordie Lunn Clubhouse (completed in 2024), which support regional sports. The City also maintains the Goldstream Station Library and contributes to leasehold expenses for the YMCA Library. Municipal Parks and Infrastructure Langford’s municipal inventory includes a diverse range of neighborhood parks and outdoor assets. The City maintains 16 playgrounds and two play surfaces, three playing fields, additional basketball courts, and a pickleball court. Aquatic infrastructure includes 13 boat launches and docks (both inshore and offshore), 11 fountains, two aerators, and four water parks. Parks are further equipped with amenities such as swing sets, climbing walls, exercise equipment, benches, picnic tables, and freestanding bleachers. Public infrastructure also includes washrooms at Langford Lake, Glen Lake, and Centennial Park, along with boat launches, docks, and fishing piers. Trails and Active Transportation
Page 55
46
CITY OF LANGFORD | Asset Management & Long-Term Financial Plan SECTION 7: DETAILED ASSET INVENTORY The City manages an extensive network of nature trails, multi-use pathways, and specialized mountain bike trails, complementing the jogging and cycling infrastructure available at WSPRS facilities
Page 56
47
CITY OF LANGFORD | Asset Management & Long-Term Financial Plan SECTION 7: DETAILED ASSET INVENTORY 7.3. Stormwater System Stormwater Inventory The City of Langford manages its stormwater and drainage through a decentralized model that emphasizes on-site infiltration and development-funded infrastructure. Unlike many municipalities that rely solely on underground pipe networks, Langford's Subdivision and Development Servicing Bylaw requires developers to manage rainwater directly on their properties. The City has a significant stormwater collection system comprised of approximately 160km of pipes ranging in size from 100mm to 9500mm. The system includes over 2100 manholes, and approximately 4000 catch basins. OTHER STORMWATER INFRASTRUCTURE In addition to the collection system the City also owns and maintains a variety of other infrastructure: Detention Ponds & Channels: The city maintains a network of ponds (e.g., Desmond Pond, Flatman Pond) to store excess water and lower peak flows during extreme weather events. Pollution Prevention: Under Watercourse Protection Bylaw, property owners must maintain devices (like oil-water separators in industrial areas) to prevent silt or petroleum from entering local waterways. Low Impact Development (LID): Infrastructure often includes "green" elements such as bioswales parallel to roads and urban forest canopy to assist with stormwater abatement.
Storm System Length Replacement Cost Annualized Cost (AAAC) Mains 145.5 km $433.3M $5,778,000 Culvert 11.1 km 3.0 M $116,700 TOTAL STORMWATER $436.3 M $5,894,700 Table 18: Storm System Detailed Inventory
Page 57
48
CITY OF LANGFORD | Asset Management & Long-Term Financial Plan SECTION 7: DETAILED ASSET INVENTORY Stormwater Spending Forecast Because the stormwater system is relatively new, most replacement and renewal costs are not expected until after 2065. In fact, approximately $418 million in capital spending is projected between 2067 and 2101, representing roughly 97% of all forecasted stormwater infrastructure expenditures over the 75-year planning horizon.
Figure 21: Storm Sewer Infrastructure Replacement Spending 2027- 2101
Page 58
49
CITY OF LANGFORD | Asset Management & Long-Term Financial Plan SECTION 7: DETAILED ASSET INVENTORY 7.4. Sanitary Sewer Sanitary Sewer Inventory The City’s sanitary sewer services are provided through an agreement with West Shore Environmental Services (WSES), which builds, owns, operates, and maintains the network. This has been a successful arrangement to date but does expose the City to some future risks: Financial Repurchase Obligation: Upon the termination of the current agreement, the City of Langford has the option to repurchase the infrastructure financed and built by WSES. This represents a potential significant future capital requirement. Long-Term Infrastructure Liability: Sewer assets have an estimated useful life of 75 years. Once (or if) ownership reverts to the city, it will assume full responsibility for the ongoing rehabilitation and replacement costs of an aging system. Operational Dependency: Because a private entity (part of the Nexus Water Group) handles all operations and customer inquiries. This exposes the City to a skills and knowledge gap should the City repurchase the system.
Given the complexity of the current ownership structure, contractual arrangements, and potential future repurchase obligations, the City should consider undertaking a dedicated Sanitary Sewer Utility Sustainability Study. The study should evaluate long-term ownership scenarios, future lifecycle funding requirements, and the role of user fees in supporting sustainable funding for sewer infrastructure. Such a review would assist the City in understanding the long-term financial implications of the current arrangement and help establish a funding strategy should ownership of the system ultimately transfer to the City.
3 See sewer data limitations in Appendix A Sanitary Sewer Components Length 3 Replacement Cost3 Annualized Cost (AAAC) Main – City Owned 47.7 km 138,520,800 1,846,900 Mains – WSES owned 137.7 km 399,764,600 5,330,200 TOTAL 185.4 km 538,285,400 7177,100
Page 59
50
CITY OF LANGFORD | Asset Management & Long-Term Financial Plan SECTION 7: DETAILED ASSET INVENTORY 7.5. Water System The City of Langford’s water system is a hybrid model primarily managed by the Capital Regional District (CRD), which supplies high-quality drinking water from the Sooke Lake Reservoir through the Juan de Fuca Water Distribution System. While the CRD provides water services for the vast majority of the city, the Westhills development area operates on a unique private utility model managed by Sustainable Services Ltd. (SSL). This localized system is notable for its sustainable "purple pipe" infrastructure, which distributes reclaimed non-potable water for irrigation and toilet flushing to reduce the community’s overall demand on the potable water supply.
Page 60
51
CITY OF LANGFORD | Asset Management & Long-Term Financial Plan SECTION 7: DETAILED ASSET INVENTORY 7.6. Building and Structures The City of Langford’s buildings and structures represent a significant financial investment, with assets ranging from municipal oƯices and public safety facilities to extensive recreational complexes and engineering structures.
1: This is the approximate replacement cost for the proportion of a new RCMP facility owned by the City of Langford. The estimate utilizes existing square footage only, not additional square footage as proposed in the expansion project. 2: City of Langford share only
MUNICIPAL AND PUBLIC SAFETY BUILDINGS Police Building (698 Atkins): The primary facility was established in 1995-2000, with substantial interior renovations and floor expansions completed between 2019 and 2024. Fire Infrastructure: Includes Firehall #1 (redesigned and expanded in 2000/2001), Firehall #2 (replaced in 2005), and Firehall #3. Maintenance such as roof replacements and energy eƯiciency upgrades (furnaces, generators) has been ongoing.
Building Replacement Cost Annualized Cost RCMP Building 31.6M1 421,800 Starlight Stadium Rugby Building 2.5M1 32,800 Starlight Stadium Main Building & Bleachers 3.6M1 48,400 Al Charron Centre 6.5M1 86,200 Sportsplex 27.4M1 365,000 City Centre Park Dry Floor Arena 22.7M1 302,500 Firehall 1 11.0M1 146,600 Firehall 2 3.9M1 52,000 Firehall 3 0.9M1 12,100 Goldstream Medical Clinic 7.3M1 97,200 Jordie Lunn Clubhouse 4.3M 56,700 West Shore Parks and Recreation Facilities 81.1M2 1,082,000 West Shore Aquatic Centre 45.9M 612,000 TOTAL BUILDINGS 248.7M1 3,315,000
Page 61
52
CITY OF LANGFORD | Asset Management & Long-Term Financial Plan SECTION 7: DETAILED ASSET INVENTORY RECREATIONAL AND CULTURAL FACILITIES City Centre Park & Starlight Stadium: A major complex featuring a Dry Floor Arena, Sportsplex (10M+ for the 2019 expansion). These sites include specialized structures like video screens, press boxes, bleachers, and changerooms. Specialized Centers: The Al Cherron Centre (Rugby Building) and the new Jordie Lunn Clubhouse (2024) support regional sports. The city also maintains the Goldstream Station Library and leasehold expenses for the YMCA Library.
Page 62
53
CITY OF LANGFORD | Asset Management & Long-Term Financial Plan SECTION 7: DETAILED ASSET INVENTORY 7.7. Natural Assets Langford's natural and semi-natural assets include a vast urban forest, managed greenery, and a network of water and wetland systems. • Tree Inventory: The city maintains thousands of trees across various neighborhoods. Diverse species include Garry Oak, Douglas Fir, Arbutus, Western Red Cedar, Red Maple, Kwanzan Cherry, and Southern Magnolia. • Planters: Hundreds of planters are distributed throughout the city, featuring combinations of annuals, shrubs, palms, rhododendrons, roses, and hydrangeas. • Wetlands and Ponds: Natural stormwater management includes a large wetland and numerous detention ponds. Properly managing and funding these assets is vital for several reasons: • Replacement of Traditional Infrastructure: Natural assets like wetlands and detention ponds perform the same function as engineered pipes by managing runoƯ and preventing flooding. If these natural systems fail due to lack of maintenance, the City would face the high cost of building expensive grey infrastructure replacements. • Service Continuity and Health: Biological assets require active intervention to remain functional. For example, Langford utilizes aerators and lake level green boxes to monitor and maintain the health of its water bodies. Without funding for these activities, the environmental service level (e.g., water quality) would decline. • Climate Resilience: A diverse and healthy urban forest (including species like Serbian Spruce and Red Maple) provides canopy cover and temperature regulation. Maintaining this inventory ensures the community remains resilient to environmental changes. By including natural assets in the GIS database, the City recognizes them as long- term liabilities that require proactive capital investment for rehabilitation and protection, similar to the 10-year management plans used for the road network.
Page 63
54
CITY OF LANGFORD | Asset Management & Long-Term Financial Plan APPENDIX A - ASSUMPTIONS APPENDIX A – ASSUMPTIONS Building Replacement Costs Building Address Replacement Cost Methodology RCMP Building 698 Atkins Rd. A unit rate per square foot was developed using the project budget for the new RCMP building found in the “West Shore RCMP Facility Expansion” report found on the Jan 12, 2026 City of Langford Council agenda. This unit rate was multiplied by the existing square footage. This was then multiplied by the City of Langford’s approximate share of 60% Westhills Stadium Rugby Building 3022 Glen Lake Rd The square footage identified in City of Langford appraisals was multiplied by a published per square foot unit rate by a cost-estimating firm. Westhills Stadium Main Building & Bleachers 1089 Langford Pkwy. The square footage identified in City of Langford appraisals was multiplied by a published per square foot unit rate by a cost-estimating firm. Al Charron Centre 3019 Glen Lake Rd. 2024 Tangible Capital Asset register values were used. Sportsplex 1097 Langford Pkwy. The square footage identified in City of Langford appraisals was multiplied by a published per square foot unit rate by a cost-estimating firm. City Centre Park Dry Floor Arena 1089 Langford Pkwy. The square footage identified in City of Langford appraisals was multiplied by a published per square foot unit rate by a cost-estimating firm. Firehall 1 2625 Peatt Rd. The square footage identified in City of Langford appraisals was multiplied by a published per square foot unit rate by a cost-estimating firm. Firehall 2 3205 Happy Valley Rd The unit rate per square foot for a recently constructed Community Safety Building in the region was applied to an approximate building area, which was derived from measurements taken using the CRD web-based GIS viewer. Firehall 3 2872 Sooke Lake Rd. The unit rate per square foot for a recently constructed Community Safety Building in the region was applied to an approximate building area, which was derived from measurements taken using the CRD web-based GIS viewer. Goldstream Medical Clinic 2832 Bryn Maur Rd 2024 Tangible Capital Asset register values were used. 2990 Irwin Rd. Jordie Lunn Clubhouse 2024 Tangible Capital Asset register values were used. 1767 Island Highway West Shore Parks & Recreation Buildings 2024 appraised values multiplied by Langford’s ownership share was used.
Page 64
55
CITY OF LANGFORD | Asset Management & Long-Term Financial Plan APPENDIX A - ASSUMPTIONS Building Capital Maintenance Facility lifecycle costs typically include major capital maintenance and renewal of key building components, such as roofs, building envelopes (walls, windows, and doors), interior finishes, and building services (mechanical, electrical, and plumbing systems). These components are often renewed multiple times over the life of a building and can represent up to 70% of its replacement value. As a result, capital maintenance can be a significant contributor to long-term lifecycle costs. The lifecycle forecasts presented in this plan do not include future capital maintenance requirements for facilities and are therefore limited to full asset replacement costs. Curb and Gutter Replacement Curb and gutter assets were assumed to be replaced concurrently with adjacent road reconstruction projects. As curb and gutter infrastructure is typically integrated into the roadway structure and is often rehabilitated or replaced as part of major road renewal projects, replacement timing was aligned with the forecasted replacement schedules for the associated road segments. This approach avoids duplicating replacement costs and reflects current municipal asset management practices where roadway and curb infrastructure are renewed together. Debt Interest The debt interest rate assumption used to prepare debt servicing forecasts was 4.0%. The current indicative lending rate through the Municipal Financial Authority varies between 3.63% for a 5 year term to 5.05% for 30 years. Estimated Useful Lives Useful life assumptions were developed using the IPWEA Modified NAMS Practice Note 12 (PN12) guidance as a reference. The recommended useful life ranges informed the asset replacement modeling and were used to establish sensitivity analysis parameters. Sensitivity testing was undertaken to assess the potential impact of variations in asset useful lives on long-term renewal forecasts and funding requirements. Asset Useful Life Sanitary Sewer Main 75 Years Storm Main 75 Years Road Base – Local 160 Years Road Base – Collector 100 Years Road Base – Arterial 80 Years Curb and Gutter Adjacent Road EUL Sidewalk 75 Years Buildings 75 Years Streetlights 35 Years Vehicles & Equipment TCA Policy EULs
Page 65
56
CITY OF LANGFORD | Asset Management & Long-Term Financial Plan APPENDIX A - ASSUMPTIONS Existing Capital Funding The City's financial information identified approximately $16.4 million in annual funding dedicated to capital purposes. However, it was not possible to determine the proportion of this funding intended for asset replacement versus growth-related capital expansion. For the purposes of this analysis, $2.0 million annually was assumed to be allocated toward new infrastructure, with the remaining funding attributed to lifecycle renewal and replacement activities. This assumption was considered reasonable based on the City's short-term capital plans, which include growth-related projects such as infill sidewalks and other infrastructure expansion initiatives.
Investment Returns The investment rate assumption used to prepare debt servicing forecasts was 2.0%. This rate is below the current Municipal Finance Authority bond fund yields. Municipal Servicing Standards Assumption The long-term financial plan assumes that assets are replaced in accordance with the City of Langford's current Subdivision and Development Servicing Bylaw standards. Renewal and replacement costs reflect the reconstruction of assets to the applicable servicing standards in effect at the time of the analysis. Actual replacement requirements and costs may vary as design standards, regulations, service levels, and asset needs evolve over time. Square Footage of Roads Road surface area data was not provided for all road segments. Therefore, pavement area was estimated using roadway lengths and assumed lane counts based on road classification. These estimates were used to calculate replacement costs and forecast lifecycle renewal requirements Sewer Data Limitations Length: The sewer segment data provided through the City's GIS system did not reconcile with the aggregate sewer main totals supplied by Nexus Water Group. In addition, Nexus Water Group was unable to provide a detailed sewer inventory at the segment level. Replacement Cost: Because complete sewer segment-level data was not available, the consultant applied an average unit replacement cost per metre across the aggregate sewer main inventory. Spending Forecast: The City provided GIS data at the sewer segment level; however, the total lengths derived from this data did not reconcile with the aggregate sewer main lengths provided by Nexus Water Group. As a result, the consultant was unable to prepare detailed replacement spending forecasts for individual sewer segments. Instead, replacement expenditures were forecast using the distribution of assets identified in the City-provided
Page 66
57
CITY OF LANGFORD | Asset Management & Long-Term Financial Plan APPENDIX A - ASSUMPTIONS GIS data, scaled to align with the aggregate sewer main totals supplied by Nexus Water Group. Pump & Lift Stations: Pump and lift stations have not been included in the lifecycle forecasts presented in this Plan.
Page 67
58
CITY OF LANGFORD | Asset Management & Long-Term Financial Plan APPENDIX B – SOURCES OF INFORMATION APPENDIX B – SOURCES OF INFORMATION The analysis contained within this report was informed by municipal records, technical studies, financial documents, GIS data, and information provided by partner organizations. Municipal Plans, Studies, and Financial Documents City of Langford 2026-2030 Financial Plan City of Langford 2025-2029 Financial Plan City of Langford 2024-2028 Financial Plan City of Langford 2023-2027 Financial Plan Stantec Consulting Ltd. City of Langford 2023 Pavement Management Report: 2023 Pavement Condition Assessment & Pavement Management System Implementation (January 2024). West Shore Parks & Recreation Society. 2024 Consolidated Financial Statements and Consolidation Schedule. Suncorp Valuations. Appraisal Report of Specified Property of West Shore Parks & Recreation Society (January 2025). City of Langford. West Shore RCMP Building Validation Report (January 12, 2026).
City of Langford Data Sources Geographic Information System (GIS) asset inventory and mapping data. Tangible Capital Asset records. Annual audited financial statements. Annual operating and capital budgets. Council Strategic Plan (2023-2027). Capital project planning and reserve fund information. Subdivision and Development Servicing Bylaw. Asset inventories and supporting information provided by City departments.
Page 68
59
CITY OF LANGFORD | Asset Management & Long-Term Financial Plan APPENDIX B – SOURCES OF INFORMATION Partner Organizations and Utility Information West Shore Environmental Services (WSES). Nexus Water Group. West Shore Parks & Recreation Society. Greater Victoria Public Library. Capital Regional District (CRD).
Industry References and Guidance Documents Asset Management BC Framework for Sustainable Service Delivery. Asset Management BC guidance documents. Union of British Columbia Municipalities (UBCM) asset management resources. Asset Management BC, UBCM, and Province of British Columbia. Land Use Planning and Asset Management: A Sustainable Service Delivery Primer (2019). Institute of Public Works Engineering Australasia (IPWEA). Practice Note 12 (PN12): Asset Life and Valuation Guidelines. Municipal Finance Authority of British Columbia (MFA) guidance and investment materials. Province of British Columbia assessment, taxation, and local government financial statistics.
Page 69
60
CITY OF LANGFORD | Asset Management & Long-Term Financial Plan GLOSSARY GLOSSARY Asset Consumption: An asset management measure that estimates the proportion of an asset's useful life that has been consumed. It is commonly expressed as a percentage and provides a high-level indication of the age profile of an asset portfolio. Asset management: An integrated approach that involves all departments within an organization to effectively manage both existing and new assets Asset management program: The set of policies, people, practices and processes that make up a municipality’s formal approach to asset management. Asset management policy: The asset management policy is a document that formalizes corporate commitment to asset management. The policy broadly outlines the principles and guides the development and implementation of asset management across the organization in a systematic and coordinated way, consistent with the organization’s plans. Asset management plan: An asset management plan outlines how groups of assets are managed over their full lifecycles to deliver an agreed-upon standard of service. It supports implementation of asset management policies and helps in making informed decisions. Asset management readiness scale: A framework tool designed by the Federation of Canadian Municipalities to help local governments measure their progress in asset management across five key competency areas Asset management roadmap: A strategic plan that outlines the steps an organization needs to take to develop and implement effective asset management practices. It serves as a guide to help organizations systematically improve their asset management capabilities over time Asset management strategy: A high-level plan that outlines how an organization will manage its assets to achieve its strategic objectives. It includes the principles, policies, and goals that guide asset management activities. Average Annual Asset Consumption (AAAC): The average annual value of infrastructure assets that is consumed through aging and use. It is calculated by dividing an asset's replacement cost by its useful life and helps estimate future renewal funding needs. Condition assessment: A systematic process used to evaluate the current state of infrastructure assets. This involves inspecting, testing, and analyzing assets to determine their operational status, performance levels, and potential future risks.
Page 70
61
CITY OF LANGFORD | Asset Management & Long-Term Financial Plan GLOSSARY Engineered assets: Refer to the physical machines, equipment, and facilities that an organization uses to produce goods or provide services. These assets include infrastructure like buildings, roads, bridges, machinery, and industrial equipment. Lifecycle Funding Gap: The difference between forecasted infrastructure renewal and replacement requirements and the funding available to address those requirements over an asset’s lifecycle. Natural assets: Natural assets are ecosystem features that provide municipal services, such as aquifers, riparian areas, and wetlands. These assets can be managed similarly to engineered assets to support sustainable service delivery Municipal Finance Authority: A provincial agency that provides low-cost borrowing and investment services to British Columbia local governments and other public sector organizations through pooled financing and investment programs. Official Community Plan: A key document that outlines the long-term vision and objectives for a community’s development. It serves as a guide for local government decision-making on land use, housing, transportation, infrastructure, and environmental protection. Pavement Quality Index (PQI): A composite pavement condition rating that combines measures of pavement surface condition, ride quality, and structural adequacy into a single score. PQI is used to evaluate the overall condition of a roadway and support pavement maintenance, rehabilitation, and renewal planning. Higher PQI values indicate better pavement condition. Risk assessment: A systematic process used to identify, evaluate, and prioritize potential risks that could impact an organization’s assets. This involves analyzing the likelihood and consequences of various risk events, such as equipment failure, natural disasters, or cyber- attacks. Useful Life: The estimated period over which an asset is expected to provide its intended level of service before requiring replacement. Weighted Average Useful Life: The average useful life of an asset portfolio, weighted by the replacement value of each asset. It indicates the average length of time assets are expected to remain in service before requiring replacement.
Page 71
62
CITY OF LANGFORD | Asset Management & Long-Term Financial Plan LIST OF TABLES AND FIGURES
Table 1: Key Findings ........................................................................................................................................................ i Table 2: Asset Inventory Replacement Values .................................................................................................................. 6 Table 3: Asset Inventory $ Consumed Values ................................................................................................................... 7 Table 4: Asset Inventory % Consumed Values .................................................................................................................. 7 Table 5: Sustainable Funding by Asset Class .................................................................................................................... 9 Table 6: Current Annual Capital Funding ........................................................................................................................ 10 Table 7 Estimated Annual Funding Gap - Capital ............................................................................................................ 11 Table 8: Forecasted Spending 2027-2101 by Asset Class ................................................................................................ 12 Table 9: Primary Funding Sources by Infrastructure Type ................................................................................................ 13 Table 10: Funding Sustainability History 2022-2026........................................................................................................ 14 Table 11: Forecasted Sustainable Funding Progress 2026-2030 ...................................................................................... 16 Table 12: Sensitivity Analysis Parameter Modelling ......................................................................................................... 19 Table 13: Sensitivity Analysis Findings ............................................................................................................................ 19 Table 14: Lifecycle Reserve Investment Returns ............................................................................................................. 27 Table 15: 2026 Tax Rate Multiples .................................................................................................................................. 29 Table 16: Asset Condition Assessment Summary ........................................................................................................... 35 Table 17: Transportation System Detailed Inventory ....................................................................................................... 42 Table 18: Storm System Detailed Inventory .................................................................................................................... 47
Figure 1: Asset Inventory Replacement Values .................................................................................................................. i Figure 2: Langford Consumption on Typical Deterioration Curve ........................................................................................ i Figure 3: Forecasted Lifecycle Funding Gap .................................................................................................................... iii Figure 4: Historical Funding Gap Addressed 2022-2026 ................................................................................................... iii Figure 5: Asset Management BC Framework .................................................................................................................... 4 Figure 6: Asset Replacement Values by Asset Class ......................................................................................................... 6 Figure 7: Consumption by Major Asset Class ................................................................................................................... 8 Figure 8: Langford average consumption with typical deterioration curve.......................................................................... 8 Figure 9: Forecasted Infrastructure Replacement Spending 2027-2101 .......................................................................... 12 Figure 10: Forecasted Lifecycle Funding Gap 2027-2101 ................................................................................................ 13 Figure 11: Cumulative Funding Shortfall - Historical Fundings vs Sustainable ................................................................. 14 Figure 12: Long Term Funding Gap History ..................................................................................................................... 15 Figure 13: Sustainable Funding Progress 2022-2026 ....................................................................................................... 15 Figure 14: Forecasted Sustainable Funding Progress 2026-2030 ..................................................................................... 16 Figure 15: Forecasted Infr. Replacement Reserves ......................................................................................................... 23 Figure 16: Forecasted Infr. Replacement Spending ......................................................................................................... 23 Figure 17: Financial Comparison of Funding Strategies .................................................................................................. 23 Figure 18: Compounding Investment Return Example .................................................................................................... 26 Figure 19: Timing DiƯerence: New Development Tax Revenue and Lifecycle Costs .......................................................... 28 Figure 20: Estimated Position of City Assets on the Deterioration Curve .......................................................................... 34 Figure 21: Storm Sewer Infrastructure Replacement Spending 2027- 2101 ..................................................................... 48