DocumentsAppendixDec 5, 2023Pages 51–82
Appendix: 2024 West Shore Parks & Recreation Society (WSPRS) Budget Package to Council
WSPRS budget package and supporting staff report materials detailing the proposed 2024 operating and capital budgets, requisition calculations, program and asset information.
Key facts
- WSPRS requisition request: $6,049,086 (a $232,657 / 4.00% increase over 2023 noted in WSPRS materials)
- Breakdown: 2.33% ($135,657) operating increase; 1.67% ($97,000) additional annual capital reserve contribution
- Included supporting information: five-year consolidated financials, asset management commentary, program usage statistics, and capital project updates
- WSPRS internal report highlights asset replacement value ~ $104.04M and need to increase annual reserve contributions toward $1M for maintenance
Appendix: 2024 West Shore Parks & Recreation Society (WSPRS) Budget Package to Council
WSPR STAFF REPORT
TO: West Shore Parks & Recreation Society Members
FROM: Grant Brown, Administrator
DATE: November 3rd, 2023
SUBJECT: 2024 Budget and Requisition Request
RECOMMENDATION:
That the West Shore Parks & Recreation Society Members review and approve the West Shore Parks & Recreation Society 2024 budget and requisition request as presented.
BACKGROUND:
On October 12th, 2023, the West Shore Parks & Recreation Society Board of Directors moved THAT THE DRAFT 2024 WSPRS BUDGET BE PRESENTED TO COUNCIL MEMBERS FOR APPROVAL.
Included in this package you find the above noted financial information for the West Shore Parks & Recreation Society. The package has been divided into sections to aid in analysis and includes the following: Five Year Consolidated Financial Plan, the Budget Comparison, Capital Summary, Reserve Continuity, Converted Assessments, Impact to Taxation, Requisition Request, Operating Summary and the Fees and Charges updates for 2024.
DISCUSSION:
The West Shore Parks & Recreation Society is projecting a $445,487 surplus for the 2023 fiscal year. Operating surpluses contribute to the Society’s general capital reserve and the 2023 contribution ensures a positive reserve balance throughout the enclosed 5-year financial plan. The majority contributor to the positive 2023 financial performance is an increase in program offerings and drop-in session attendance. WSPRS realized a 35% increase in single admissions and a 64% increase in pass sales which resulted in a 73% increase in pass scans as compared to the previous 12-month period. 2023 also saw a 58% increase in the number of swimming lesson participants, a 4% increase in outdoor facility hours rented and a 10% increase in the number of rounds played on the golf course.
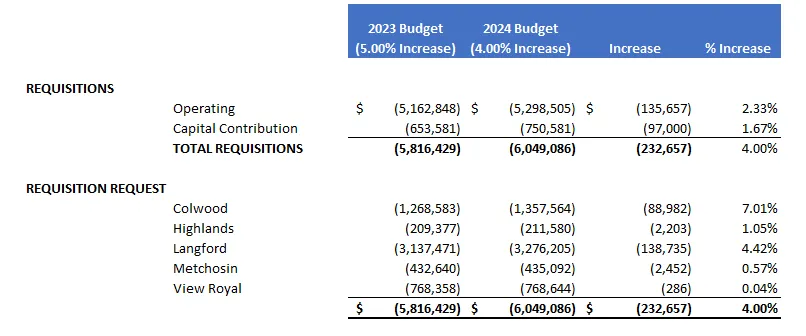
The 2024 West Shore Parks & Recreation Society’s requisition request is for $6,049,086 which is a $232,657 or 4.00% increase over the 2023 approved requisition.
The 4.00% requisition increase includes a 2.33% or $135,657 increase to the operating budget and a 1.67% or $97,000 for additional annual capital reserve contribution. The additional contribution progresses the Society closer to achieving its goal of obtaining sufficient funds for the maintenance and replacement of existing infrastructure which had a 2022 appraised value of $111,778,400.
A few considerations with preparing the budget for 2024:
- Collective agreement negotiations: The current collective agreement expires in 2023 and WSPRS is currently 4% behind the region which is set to increase by an additional 3% in 2024, effectively putting WSPRS 7% behind the region on January 1st, 2024, until a new agreement is established.
- Insurance premiums: 10% premium increase is expected due to a “hard” market where rates are increasing for large-value insured properties. A significant factor for WSPRS is a reduction in providers willing to quote on its insurance needs, resulting in a less competitive market.
- Annual utility rate increases: 5 – 10% expected utility rate increases.
The proposed 2024 – 2028 Financial Plan includes the following:
- Non-discretionary increase in expenses: $163,182:
- Utility increases: $97,277
- Insurance premium increases: $65,905
- In preparation for the upcoming collective agreement negotiations, the 2024 budget includes a wage increase contingency.
- The addition of a new Human Resources Specialist position that will provide additional administrative support at a value of $83,218. This position will coordinate and assist in the recruitment process which will allow supervisory and program staff to focus on delivering high quality programs and services, which will lead to better outcomes for both recruitment and program execution.
- Increased reserve contributions:
- A redirection of the Q Centre subsidy payments which completed at the end of 2023. As indicated in the 2023 – 2027 Financial Plan, these funds will contribute to the general capital reserve in 2024.
- A continued annual $60,000 increase to the capital reserve transfer as approved by the owners in 2021.
- A $20,000 fitness equipment reserve increase based on the value of the recent equipment replacement in 2023.
- A $10,000 school bus replacement reserve increase based on the value of the bus replacement in 2022.
- The establishment of a skatepark capital maintenance reserve which includes a $5,000 annual contribution for major repairs.
- The establishment of an electric car charging station reserve which includes a $2,000 annual contribution for the eventual replacement of the two stations.
- Fees and charges increase, effective September 2024.
- Average increases as follows:
- Admissions 3.53%
- Indoor facilities 4.43%
- Arenas 4.00%
- Outdoor facilities 4.95%
- Golf 4.59%
- Average increases as follows:
Increase and impact to each municipality
As per the West Shore Parks, Recreation and Community Services Agreement, which governs the members’ obligations as participants in the WSPRS, the requisition amounts attributed to each member is proportioned based on their converted assessment values as provided by each members’ financial officer on an annual basis.
FINANCIAL IMPLICATIONS:
The 2024 budget and requisition request of $6,049,086 is an increase of $232,657 or 4.00% over the approved 2023 budget requisition.
Grant Brown, Administrator
2024 BUDGET — 2024-2028 FIVE YEAR FINANCIAL PLAN
Summary Table: 2024-2028 Five Year Financial Plan
| 2024 | 2025 | 2026 | 2027 | 2028 | |
|---|---|---|---|---|---|
| REQUISITIONS | |||||
| Colwood | (1,357,564) $ | (1,410,509) $ | (1,462,698) $ | (1,513,893) $ | (1,566,879) $ |
| Highlands | (211,580) $ | (219,832) $ | (227,965) $ | (235,944) $ | (244,202) $ |
| Langford | (3,276,205) $ | (3,403,977) $ | (3,529,925) $ | (3,653,472) $ | (3,781,343) $ |
| Metchosin | (435,092) $ | (452,061) $ | (468,787) $ | (485,195) $ | (502,177) $ |
| View Royal | (768,644) $ | (798,621) $ | (828,170) $ | (857,156) $ | (887,157) $ |
| Total Requisition | (6,049,086) $ | (6,285,001) $ | (6,517,546) $ | (6,745,660) $ | (6,981,758) $ |
| REQUISITION % INCREASE | 4.00% | 3.90% | 3.70% | 3.50% | 3.50% |
| OPERATIONAL REVENUES | |||||
| Finance | (65,393) | (67,943) | (70,457) | (72,923) | (75,475) |
| Food & Beverage | (413,151) | (429,264) | (445,147) | (460,727) | (476,853) |
| Maintenance | (286,227) | (297,390) | (308,393) | (319,187) | (330,359) |
| Marketing | (34,624) | (35,974) | (37,305) | (38,611) | (39,962) |
| Parks | (121,879) | (126,632) | (131,317) | (135,913) | (140,670) |
| Programs | (6,878,317) | (7,146,572) | (7,410,995) | (7,670,380) | (7,938,843) |
| Reception | (54,979) | (57,123) | (59,237) | (61,310) | (63,456) |
| Total Operational Revenues | (7,854,570) | (8,160,898) | (8,462,851) | (8,759,051) | (9,065,618) |
| OPERATIONAL EXPENSES | |||||
| Administration | 893,002 | 927,829 | 962,159 | 995,834 | 1,030,689 |
| Finance | 996,212 | 1,035,064 | 1,073,361 | 1,110,929 | 1,149,811 |
| Food & Beverage | 259,752 | 269,882 | 279,868 | 289,663 | 299,801 |
| Human Resources | 378,326 | 393,081 | 407,625 | 421,892 | 436,658 |
| Maintenance | 3,765,826 | 3,912,694 | 4,057,463 | 4,199,475 | 4,346,456 |
| Marketing | 31,800 | 33,040 | 34,263 | 35,462 | 36,703 |
| Parks | 1,095,561 | 1,138,288 | 1,180,405 | 1,221,719 | 1,264,479 |
| Programs | 4,963,534 | 5,157,112 | 5,347,925 | 5,535,103 | 5,728,831 |
| Reception | 645,062 | 670,219 | 695,017 | 719,343 | 744,520 |
| Transfer to Fitness Equipment Reserve | 100,000 | 100,000 | 100,000 | 100,000 | 100,000 |
| Transfer to Electronic Sign Reserve | 10,000 | 10,000 | 10,000 | 10,000 | 10,000 |
| Transfer to Electric car charging stations | 2,000 | 2,000 | 2,000 | 2,000 | 2,000 |
| Transfer to IT Reserve | 15,000 | 15,000 | 15,000 | 15,000 | 15,000 |
| Transfer to Turf Replacement Reserve | 30,000 | 30,000 | 30,000 | 30,000 | 30,000 |
| Transfer to Velodrome turf replacement | - | 40,000 | 40,000 | 40,000 | 40,000 |
| Transfer to Bus Reserve | 30,000 | 40,000 | 40,000 | 40,000 | 40,000 |
| Transfer to General Capital | 687,581 | 671,690 | 705,311 | 738,292 | 772,427 |
| Total Operational Expenses | 13,903,656 | 14,445,899 | 14,980,397 | 15,504,711 | 16,047,376 |
| Annual (Surplus)/Deficit | 0 | 0 | 0 | 0 | 0 |
| CAPITAL FUNDING | |||||
| Equipment Replacement Reserve | - | - | (50,000) | (120,000) | (350,000) |
| General Capital Reserve | (1,419,000) | (1,074,000) | (939,500) | (927,000) | (491,500) |
| Library Capital Reserve | (120,000) | (70,000) | (50,000) | (20,000) | (40,000) |
| Government Grants and Contributions | (360,000) | (1,899,000) | (1,144,000) | (1,039,500) | (1,067,000) |
| TOTAL CAPITAL FUNDING | (1,899,000) | (1,899,000) | (2,183,500) | (2,106,500) | (1,948,500) |
| CAPITAL EXPENSES | |||||
| Equipment Replacement Expenses | - | - | 50,000 | 120,000 | 350,000 |
| Major site Maintenance Expenses | 1,419,000 | 1,074,000 | 939,500 | 927,000 | 491,500 |
| Library Capital Expenditures | 120,000 | 70,000 | 50,000 | 20,000 | 40,000 |
| New Initiative Expenses | 360,000 | 1,899,000 | 1,144,000 | 1,039,500 | 1,067,000 |
| Financial Plan Balance | 0 | 0 | 0 | 0 | 0 |
BUDGET COMPARISON (2022–2024)
Summary Table: 2022, 2023, 2024
| 2022 | 2023 | 2024 | |
|---|---|---|---|
| REQUISITIONS | |||
| Colwood | (1,191,599) $ | (1,268,583) $ | (1,357,564) $ |
| Highlands | (193,573) | (209,377) | (211,580) |
| Langford | (2,985,575) | (3,137,471) | (3,276,205) |
| Metchosin | (415,127) | (432,640) | (435,092) |
| View Royal | (753,507) | (768,358) | (768,644) |
| Total Requisition | (5,539,381) | (5,816,429) | (6,049,086) |
| REQUISITION % INCREASE | 5.14% | 5.00% | 4.00% |
| COVID RESTART GRANT | (209,513) | ||
| OPERATIONAL REVENUES | |||
| Finance | (94,384) | (73,156) | (65,393) |
| Food & Beverage | (288,389) | (425,468) | (413,151) |
| Maintenance | (170,999) | (211,443) | (286,227) |
| Marketing | (18,000) | (20,000) | (34,624) |
| Parks | (55,343) | (58,172) | (121,879) |
| Programs | (5,510,772) | (6,178,577) | (6,878,317) |
| Reception | (30,003) | (52,731) | (54,979) |
| Total Operational Revenues | (6,167,889) | (7,019,547) | (7,854,570) |
| OPERATIONAL EXPENSES | |||
| Administration | 466,524 | 590,381 | 893,002 |
| Finance | 844,976 | 918,990 | 996,212 |
| Food & Beverage | 275,792 | 283,694 | 259,752 |
| Human Resources | 183,720 | 258,106 | 378,326 |
| Maintenance | 3,472,113 | 3,598,796 | 3,765,826 |
| Marketing | 28,250 | 28,250 | 31,800 |
| Parks | 1,041,056 | 1,054,442 | 1,095,561 |
| Programs | 4,367,841 | 4,765,710 | 4,963,534 |
| Reception | 642,930 | 684,026 | 645,062 |
| Transfer to Fitness Equipment Reserve | 80,000 | 80,000 | 100,000 |
| Transfer to Electronic Sign Reserve | 10,000 | 10,000 | 10,000 |
| Transfer to Electric car charging stations | - | - | 2,000 |
| Transfer to IT Reserve | 15,000 | 15,000 | 15,000 |
| Transfer to Turf Replacement Reserve | 30,000 | 30,000 | 30,000 |
| Transfer to Velodrome turf replacement | - | - | - |
| Transfer to Bus Reserve | 20,000 | 20,000 | 30,000 |
| Transfer to General Capital | 438,581 | 498,581 | 687,581 |
| Total Operational Expenses | 11,916,783 | 12,835,976 | 13,903,656 |
| Annual Surplus/(Deficit) | 0 | 0 | 0 |
| CAPITAL FUNDING | |||
| Equipment Replacement Reserve | (20,000) | (300,000) | - |
| General Capital Reserve | (989,500) | (1,362,000) | (1,419,000) |
| Library Capital Reserve | (130,000) | (120,000) | (120,000) |
| Government Grants and Contributions | (1,279,900) | (929,900) | (360,000) |
| Total Capital Funding | (2,289,400) | (2,721,900) | (1,899,000) |
| CAPITAL EXPENSES | |||
| Equipment Replacement Expenses | 20,000 | 300,000 | - |
| Major site Maintenance Expenses | 989,500 | 1,362,000 | 1,419,000 |
| Library Capital Expenditures | 130,000 | 120,000 | - |
| New Initiative Expenses | 1,279,900 | 929,900 | 360,000 |
| Total Capital Expenses | 2,289,400 | 2,721,900 | 1,899,000 |
| Financial Plan Balance | 0 | 0 | 0 |
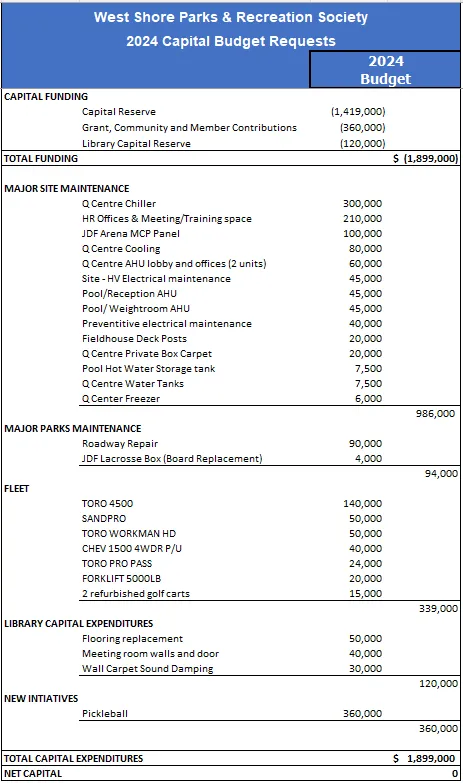
2024 CAPITAL SUMMARY
Capital Funding
| Source | 2024 |
|---|---|
| Capital Reserve | (1,419,000) |
| Grant, Community and Member Contributions | (360,000) |
| Library Capital Reserve | (120,000) |
| TOTAL FUNDING | (1,899,000) $ |
Major Site Maintenance (2024 requests)
- Q Centre Chiller — 300,000
- HR Offices & Meeting/Training space — 210,000
- JDF Arena MCP Panel — 100,000
- Q Centre Cooling — 80,000
- Q Centre AHU lobby and offices (2 units) — 60,000
- Site - HV Electrical maintenance — 45,000
- Pool/Reception AHU — 45,000
- Pool/ Weightroom AHU — 45,000
- Preventive electrical maintenance — 40,000
- Fieldhouse Deck Posts — 20,000
- Q Centre Private Box Carpet — 20,000
- Pool Hot Water Storage tank — 7,500
- Q Centre Water Tanks — 7,500
- Q Center Freezer — 6,000
Major Site Total: 986,000
Major Parks Maintenance
- Roadway Repair — 90,000
- JDF Lacrosse Box (Board Replacement) — 4,000
Parks Total: 94,000
Fleet
- TORO 4500 — 140,000
- SANDPRO — 50,000
- TORO WORKMAN HD — 50,000
- CHEV 1500 4WDR P/U — 40,000
- TORO PRO PASS — 24,000
- FORKLIFT 5000LB — 20,000
- 2 refurbished golf carts — 15,000
Fleet Total: 339,000
Library Capital Expenditures
- Flooring replacement — 50,000
- Meeting room walls and door — 40,000
- Wall Carpet Sound Damping — 30,000
Library Total: 120,000
New Initiatives
- Pickleball — 360,000
TOTAL CAPITAL EXPENDITURES: 1,899,000 $
NET CAPITAL: 0
RESERVE CONTINUITY (2023–2028)
Equipment Replacement Reserve & General Capital Reserve Continuity
| Item / Year | 2023 Opening | 2023 Contributions | 2023 Less: Expenses | 2023 Ending |
|---|---|---|---|---|
| Equipment Replacement Reserve Opening Balance | 384,170 $ | 384,170 $ | ||
| Contributions (2023) | 170,000 | 170,000 | ||
| Less: Expenses (2023) | (388,193) | (388,193) | ||
| Ending Balance (Equipment Replacement) | 165,977 $ |
| Item / Year | 2023 Opening | Contributions | Less: Expenses | 2023 Ending |
|---|---|---|---|---|
| General Capital Reserve Opening Balance | 2,122,888 $ | 2,122,888 $ | ||
| Contributions (2023) | 498,581 | 498,581 | ||
| Less: Expenses (2023) | (1,223,581) | (1,223,581) | ||
| Ending Balance (General Capital) | 1,397,888 $ |
Subsequent years projected continuity (summary):
| Year | Equipment Replacement Reserve Ending Balance | General Capital Reserve Ending Balance |
|---|---|---|
| 2024 | 352,977 | 1,111,956 |
| 2025 | 589,977 | 709,646 |
| 2026 | 776,977 | 475,457 |
| 2027 | 893,977 | 286,749 |
| 2028 | 780,977 | 567,676 |
(Contributions and expenses per year included in detailed continuity above.)
CONVERTED ASSESSMENT TOTALS (2024)
| Municipality | GENERAL | PURPOSE EXEMPT | TOTAL | % TOTAL | 2023 TOTAL | % CHANGE |
|---|---|---|---|---|---|---|
| City of Colwood | 803,893,443 $ | 74,927,789 $ | 878,821,232 $ | 22.44% | 729,073,113 $ | 20.54% |
| District of Highlands | 136,673,913 | 292,740 | 136,966,653 | 3.50% | 120,332,036 | 13.82% |
| City of Langford | 2,110,251,224 | 10,605,156 | 2,120,856,380 | 54.16% | 1,803,150,802 | 17.62% |
| District of Metchosin | 231,996,943 | 49,660,747 | 281,657,690 | 7.19% | 248,644,695 | 13.28% |
| Town of View Royal | 496,496,315 | 1,086,580 | 497,582,895 | 12.71% | 441,586,929 | 12.68% |
| Total | 3,779,311,838 $ | 136,573,012 $ | 3,915,884,850 $ | 100.00% | 3,342,787,575 $ | 17.14% |
IMPACT TO TAXATION
Total Property Tax / 2024 Requisition 4.00% — 2024 INCREASE
| MUNICIPALITY | TOTAL PROPERTY TAX 2023 | 2024 REQUISITION INCREASE $ | 2024 INCREASE % | POPULATION | PER CAPITA |
|---|---|---|---|---|---|
| Colwood | 19,358,400 $ | 88,982 $ | 0.46% | 18,961 | 4.69 $ |
| Highlands | 2,505,100 $ | 2,203 $ | 0.09% | 2,482 | 0.89 $ |
| Langford | 44,824,685 $ | 138,735 $ | 0.31% | 46,584 | 2.98 $ |
| Metchosin | 2,509,547 $ | 2,452 $ | 0.10% | 5,067 | 0.48 $ |
| View Royal | 11,318,193 $ | 286 $ | 0.00% | 11,575 | 0.02 $ |
Requisition Components (2023 Budget vs 2024 Budget)
| Component | 2023 Budget (5.00% Increase) | 2024 Budget (4.00% Increase) | Increase $ | % Increase |
|---|---|---|---|---|
| Operating | (5,162,848) $ | (5,298,505) $ | (135,657) $ | 2.33% |
| Capital Contribution | (653,581) | (750,581) | (97,000) | 1.67% |
| Total Requisition | (5,816,429) | (6,049,086) | (232,657) | 4.00% |
Breakdown by Municipality (2023 -> 2024)
| Municipality | 2023 | 2024 | Increase $ | % Increase |
|---|---|---|---|---|
| Colwood | (1,268,583) | (1,357,564) | (88,982) | 7.01% |
| Highlands | (209,377) | (211,580) | (2,203) | 1.05% |
| Langford | (3,137,471) | (3,276,205) | (138,735) | 4.42% |
| Metchosin | (432,640) | (435,092) | (2,452) | 0.57% |
| View Royal | (768,358) | (768,644) | (286) | 0.04% |
| Total | (5,816,429) $ | (6,049,086) $ | (232,657) $ | 4.00% |
REQUISITION REQUEST AND PER CAPITA COST
| MUNICIPALITY | 2023 Budget (5.00% Increase) | Per Capita 2023 | 2024 Budget (4.00% Increase) | Per Capita 2024 | Per Capita Increase (decrease) |
|---|---|---|---|---|---|
| Colwood (pop 18,961) | 1,268,583 $ | 66.90 $ | 1,357,564 $ | 71.60 $ | 4.69 $ |
| Highlands (pop 2,482) | 209,377 | 84.36 $ | 211,580 | 85.25 $ | 0.89 $ |
| Langford (pop 46,584) | 3,137,471 | 67.35 $ | 3,276,205 | 70.33 $ | 2.98 $ |
| Metchosin (pop 5,067) | 432,640 | 85.38 $ | 435,092 | 85.87 $ | 0.48 $ |
| View Royal (pop 11,575) | 768,358 | 66.38 $ | 768,644 | 66.41 $ | 0.02 $ |
*From 2021 Census of Population, www12.statcan.gc.ca
OPERATING INCOME AND SUMMARY
Revenue and Expense Summary by Category
(Current Month; Year to Date (Aug 31); Budget; projection December 31, 2023)
Note: Table below reproduces the detailed Revenue and Expense Summary lines present in the package. Values are shown as presented (negative numbers indicate revenue).
Programs — Administration
| Line | Current Month 2023 | Current Month 2022 | $ Change | % Change | YTD 2023 | YTD 2022 | $ Change | % Change | Dec 31, 2023 projection | 2022 | 2023 | 2024 Budget | |---|---:|---:|---:|---:|---:|---:|---:|---:|---:|---:|---::|---:| | Expenses | 18,300 | 22,008 | (3,708) | -16.85% | 176,642 | 166,608 | 10,034 | 6.02% | 269,344 | 246,714 | 268,092 | 272,327 |
JDF Arena
| Line | Current Month 2023 | Current Month 2022 | $ Change | % Change | YTD 2023 | YTD 2022 | $ Change | % Change | Dec 31, 2023 projection | 2022 | 2023 | 2024 Budget |
|---|---|---|---|---|---|---|---|---|---|---|---|---|
| Revenue | -93,565 | -82,005 | -11,561 | 14.10% | -411,949 | -367,159 | -44,789 | 12.20% | -657,953 | -571,900 | -605,607 | -656,587 |
| Expenses | 12,059 | 29,086 | -17,026 | -58.54% | 186,217 | 202,500 | -16,284 | -8.04% | 312,162 | 256,714 | 310,825 | 243,962 |
| Net | -81,506 | -52,919 | -28,586 | 54.02% | -225,732 | -164,659 | -61,074 | 37.09% | -345,791 | -315,186 | -294,782 | -412,625 |
Q Centre
| Line | Current Month 2023 | Current Month 2022 | $ Change | % Change | YTD 2023 | YTD 2022 | $ Change | % Change | Dec 31, 2023 projection | 2022 | 2023 | 2024 Budget |
|---|---|---|---|---|---|---|---|---|---|---|---|---|
| Revenue | -15,954 | -15,093 | -861 | 5.71% | -345,658 | -311,626 | -34,033 | 10.92% | -570,910 | -544,800 | -564,477 | -595,151 |
| Expenses | 37,823 | 34,572 | 3,251 | 9.40% | 314,675 | 278,026 | 36,649 | 13.18% | 510,160 | 452,804 | 506,498 | 393,165 |
| Net | 21,869 | 19,479 | 2,390 | 12.27% | -30,983 | -33,600 | 2,616 | -7.79% | -60,750 | -91,996 | -57,979 | -201,986 |
Indoor Sports Complex
| Line | Current Month 2023 | Current Month 2022 | $ Change | % Change | YTD 2023 | YTD 2022 | $ Change | % Change | Dec 31, 2023 projection | 2022 | 2023 | 2024 Budget |
|---|---|---|---|---|---|---|---|---|---|---|---|---|
| Revenue | -1,205 | -535 | -670 | 125.14% | -50,214 | -37,830 | -12,384 | 32.74% | -73,210 | -147,734 | -67,016 | -73,460 |
| Expenses | 2,500 | 2,500 | 0.00% | 20,000 | 20,000 | 0.00% | 32,500 | 35,000 | 35,000 | 35,000 | ||
| Net | 1,295 | 1,965 | -670 | -34.07% | -30,214 | -17,830 | -12,384 | 69.46% | -40,710 | -112,734 | -32,016 | -38,460 |
Facility Bookings
| Line | Current Month 2023 | Current Month 2022 | $ Change | % Change | YTD 2023 | YTD 2022 | $ Change | % Change | Dec 31, 2023 projection | 2022 | 2023 | 2024 Budget |
|---|---|---|---|---|---|---|---|---|---|---|---|---|
| Revenue | -32,154 | -15,845 | -16,309 | 102.93% | -222,029 | -175,318 | -51,846 | 35.32% | -286,579 | -167,000 | -209,711 | -291,177 |
| Expenses | 3,393 | 1,350 | 2,043 | 151.33% | 31,311 | 24,762 | 6,550 | 26.45% | 10,243 | 45,730 | 50,080 | 110,158 |
| Net | -28,761 | -14,495 | -14,266 | 98.42% | -190,718 | -150,556 | -45,296 | 37.12% | -276,336 | -121,270 | -159,631 | -181,019 |
Fitness, Weights & Rehab
| Line | Current Month 2023 | Current Month 2022 | $ Change | % Change | YTD 2023 | YTD 2022 | $ Change | % Change | Dec 31, 2023 projection | 2022 | 2023 | 2024 Budget |
|---|---|---|---|---|---|---|---|---|---|---|---|---|
| Revenue | -56,175 | -40,299 | -15,875 | 39.39% | -507,346 | -286,401 | -220,945 | 77.15% | -746,291 | -606,597 | -685,271 | -770,843 |
| Expenses | 41,302 | 33,598 | 7,704 | 22.93% | 328,282 | 294,474 | 31,568 | 10.93% | 497,531 | 494,715 | 468,324 | 509,728 |
| Net | -14,873 | -6,701 | -8,171 | 121.96% | -179,064 | 8,073 | -189,377 | -7980.28% | -248,759 | -111,882 | -216,947 | -261,115 |
Golf
| Line | Current Month 2023 | Current Month 2022 | $ Change | % Change | YTD 2023 | YTD 2022 | $ Change | % Change | Dec 31, 2023 projection | 2022 | 2023 | 2024 Budget |
|---|---|---|---|---|---|---|---|---|---|---|---|---|
| Revenue | -92,017 | -86,321 | -5,695 | 6.60% | -478,654 | -393,493 | -85,161 | 21.64% | -575,329 | -498,600 | -471,411 | -488,078 |
| Expenses | 16,397 | 15,708 | 688 | 4.38% | 104,503 | 95,736 | 8,766 | 9.16% | 143,292 | 127,494 | 128,643 | 141,274 |
| Net | -75,620 | -70,613 | -5,007 | 7.09% | -374,151 | -297,757 | -76,395 | 25.66% | -432,037 | -371,106 | -342,768 | -346,804 |
Pool
| Line | Current Month 2023 | Current Month 2022 | $ Change | % Change | YTD 2023 | YTD 2022 | $ Change | % Change | Dec 31, 2023 projection | 2022 | 2023 | 2024 Budget |
|---|---|---|---|---|---|---|---|---|---|---|---|---|
| Revenue | -111,263 | -104,333 | -6,930 | 6.64% | -816,019 | -640,891 | -175,129 | 27.33% | -1,354,772 | -972,773 | -1,128,959 | -1,437,901 |
| Expenses | 90,056 | 81,248 | 8,808 | 10.84% | 583,589 | 580,056 | 3,536 | 0.61% | 959,052 | 821,948 | 866,572 | 972,281 |
| Net | -21,207 | -23,085 | 1,878 | -8.14% | -232,430 | -60,835 | -171,592 | 282.05% | -395,720 | -150,825 | -262,387 | -465,620 |
Sports
| Line | Current Month 2023 | Current Month 2022 | $ Change | % Change | YTD 2023 | YTD 2022 | $ Change | % Change | Dec 31, 2023 projection | 2022 | 2023 | 2024 Budget |
|---|---|---|---|---|---|---|---|---|---|---|---|---|
| Revenue | -55,864 | -48,552 | -7,313 | 15.06% | -213,731 | -155,724 | -58,006 | 37.25% | -265,185 | -121,124 | -203,994 | -278,445 |
| Expenses | 62,036 | 9,981 | 52,057 | 521.61% | 149,223 | 60,412 | 88,812 | 147.01% | 214,428 | 64,915 | 116,780 | 222,503 |
| Net | 6,172 | -38,571 | 44,743 | -116.00% | -64,508 | -95,312 | 30,807 | -32.32% | -50,757 | -56,209 | -87,214 | -55,942 |
(Additional program and departmental lines and totals follow below as in the package.)
Community Recreation, Arts & Culture, Licensed Care, Pre-school to Youth, Community Development, Programs Summary
(As presented in the package — reproducing key totals.)
| Category | Programs - Revenue (YTD 2023) | Programs - Expenses (YTD 2023) | Programs - Net Operations (YTD 2023) | Dec 31, 2023 projection - Revenue | 2024 Budget - Net |
|---|---|---|---|---|---|
| Programs - Revenue | -4,632,849 | -6,867,644 | -6,878,319 | ||
| Programs - Expenses | 3,306,329 | 5,116,538 | 5,123,531 | ||
| Programs - Net Operations | -1,326,520 | -1,751,106 | -1,754,788 |
Parks & Maintenance — Selected Lines
| Line | Current Month 2023 | YTD 2023 | Dec 31, 2023 projection | 2024 Budget |
|---|---|---|---|---|
| Fleet Vehicle Expenses (Current Month) | 4,225 | 38,960 | 33,472 | 74,203 |
| JDF Arena Expenses (YTD 2023) | 407,761 | 664,075 | 717,965 | |
| Pool Expenses (YTD 2023) | 464,613 | 682,807 | 727,302 | |
| Parks Revenue (YTD 2023) | -109,408 | -133,076 | -121,879 | |
| Parks Expenses (YTD 2023) | 628,382 | 914,798 | 898,357 | |
| Parks & Maintenance - Net Operations (YTD 2023) | 2,699,429 | 4,230,776 | 4,453,285 |
Administration, Finance, Reception, Marketing, Human Resources, Food & Beverage — Selected Lines
| Category | Total Revenues (YTD 2023) | Total Expenses (YTD 2023) | Net (YTD 2023) | Dec 31, 2023 projection | 2024 Budget |
|---|---|---|---|---|---|
| Administration Revenue | -266,498 | 1,844,873 | 1,578,375 | 3,029,694 | 3,503,986 |
| Finance Revenue (YTD 2023) | -217,885 | 981,806 | 763,921 | 1,455,714 | 1,645,399 |
| Reception Revenue (YTD 2023) | -34,086 | 396,580 | 362,494 | 599,658 | 590,083 |
| Marketing Revenue (YTD 2023) | -33,044 | 12,747 | -1,780 | -2,999 | -2,824 |
| Human Resources Expenses (YTD 2023) | 169,397 | 280,322 | 378,326 | ||
| Food and Beverage Revenue (YTD 2023) | -267,361 | 164,902 | -102,459 | -138,422 | -153,400 |
Net Operations & Totals
| Item | YTD 2023 | YTD 2022 | $ Change | % Change | Dec 31, 2023 projection | 2022 | 2023 | 2024 Budget |
|---|---|---|---|---|---|---|---|---|
| Net Operations | 329,468 | 208,324 | 121,147 | 58.15% | 2,848,825 | 3,459,559 | 5,816,429 | 6,049,083 |
| Total Revenues | (829,597) | (782,168) | (47,429) | 6.06% | (5,424,998) | (4,266,528) | (7,019,539) | (7,854,572) |
| Total Expenses | 1,159,065 | 990,492 | 168,576 | 17.02% | 8,273,823 | 7,726,087 | 12,835,968 | 13,903,655 |
| Net | 329,468 | 208,324 | 121,147 | 58.15% | 2,848,825 | 3,459,559 | 5,816,429 | 6,049,083 |
Requisitions (Detail Lines)
| Line | YTD 2023 | YTD 2022 | $ Change | % Change | Dec 31, 2023 projection | 2022 | 2023 | 2024 |
|---|---|---|---|---|---|---|---|---|
| Colwood (10-18-100-0180) | -951,437 | -893,699 | -57,738 | 6.46% | -1,268,583 | -1,191,599 | -1,268,583 | -1,357,564 |
| Highlands (10-18-100-0181) | -157,033 | -145,180 | -11,853 | 8.16% | -209,377 | -193,573 | -209,377 | -211,580 |
| Langford (10-18-100-0182) | -2,353,103 | -2,239,181 | -113,922 | 5.09% | -3,137,471 | -2,985,575 | -3,137,471 | -3,276,205 |
| Metchosin (10-18-100-0183) | -324,480 | -311,345 | -13,135 | 4.22% | -432,640 | -415,127 | -432,640 | -435,092 |
| View Royal (10-18-100-0184) | -576,269 | -565,130 | -11,139 | 1.97% | -768,358 | -753,507 | -768,358 | -768,644 |
| Grant Contributions - Colwood (10-18-100-0186) | 0 | 0 | 0 | 0 | -44,527 | |||
| Grant Contributions - Highlands (10-18-100-0187) | 0 | 0 | 0 | 0 | -7,039 | |||
| Grant Contributions - Langford (10-18-100-0188) | 0 | 0 | 0 | 0 | -112,429 | |||
| Grant contributions - Metchosin (10-18-100-0189) | 0 | 0 | 0 | 0 | -15,135 | |||
| Grant contributions - View Royal (10-18-100-0190) | 0 | 0 | 0 | 0 | -30,383 | |||
| Total Requisitions and Contributions | (4,362,322) | (4,154,535) | -207,786 | 5.00% | (5,816,429) | (5,748,894) | (5,816,429) | (6,049,085) |
Capital Projects — Selected Lines (Detail)
| Project | Current Month 2023 | YTD 2023 | $ Change | % Change | Dec 31, 2023 projection | 2022 | 2023 | 2024 |
|---|---|---|---|---|---|---|---|---|
| Major Site Repairs & Maintenance 11-28-120-7120 | 126,574 | 26,828 | 99,746 | 371.80% | 1,035,000 | 27,000 | 1,145,000 | 986,000 |
| Parks Major Maintenance 12-28-150-7120 | 2,146 | -2,146 | -100.00% | 5,117 | 35,576 | -30,459 | 103,000 | 94,000 |
| Fitness Equipment Replacement 35-28-350-7120 | 326,774 | 326,774 | 0.00% | 326,774 | 326,774 | 0.00% | 326,774 | 20,000 |
| Vehicle Replacement Fund - Purch 12-28-130-7180 | 129,429 | 129,429 | 0.00% | 129,411 | 122,052 | 7,360 | 147,000 | 304,000 |
| Skate Park 10-28-120-7170 | 752 | 752 | 0.00% | 961,544 | 28,774 | 932,770 | 961,544 | 1,279,900 |
| Pickleball 10-28-120-7174 | 0 | 0 | 0 | 0 | 360,000 | |||
| Pool Diving Boards - Capital 11-28-120-7124 | 0 | 0 | 0 | 65,000 | ||||
| Q Centre Heat Exchanger 11-28-120-7128 | 0 | 0 | 0 | 7,500 | ||||
| Total Capital | 456,955 | 2,146 | 454,809 | 21196.79% | 1,549,420 | 352,633 | 1,196,788 | 2,573,318 |
Fund Transfers (selected)
| Line | Current Month 2023 | YTD 2023 | Dec 31, 2023 projection | 2022 | 2023 | 2024 |
|---|---|---|---|---|---|---|
| Maintenance - Transfer from Res 11-20-120-0201 | 0.00% | 0.00% | -1,499,674 | -989,500 | -1,362,000 | -1,419,000 |
| Government Grants Major R&M 11-15-120-0309 | 0.00% | -746,870 | 37,617 | -784,487 | -2,573,318 | -2,289,400 |
| Fitness Equipment - Transfer from 35-20-350-0201 | 0.00% | 0.00% | -326,774 | -20,000 | -300,000 | |
| Total Fund Transfers | 0.00% | -746,870 | 37,617 | -784,487 | -2,573,318 | -2,289,400 |
Net Capital (summary): 0 (for Dec 31 projection)
Deficit / (Surplus) Before Capital — Dec 31, 2023 projection: -445,487 (surplus)
Deficit / (Surplus) (total including capital): -445,487 (surplus) projected for 2023.
CAPITAL DEVELOPMENT (Selected)
- Library Capital Building (95-25-125-0205): -80,000 (revenue line referenced)
- SI Ravens Colwood Grant (95-25-200-0306): -2,055
- Skate Park (95-25-810-0304): -59,307
Total Capital Development Revenue lines YTD shown as -61,362 (YTD 2023).
Library Capital Building expense lines anticipated: 80,000 / 130,000 / 120,000 (various years as shown).
Deficit/(Surplus) lines confirm projected 2023 surplus of -445,487.
FEES AND CHARGES 2024–2025
Fees Effective: September 1, 2024 to August 31, 2025
Includes applicable taxes as of September 2022
ADMISSION FEES (swim, skate, weightroom, fitness classes)
| Category / Pass | 01-Sep-24 | % Increase | 2023 | 01-Jan-23 | 2022 | 2021 | 2020 | 2019 | 2018 |
|---|---|---|---|---|---|---|---|---|---|
| Adult Single Admission (19 - 59) | $7.50 | 3.45% | 7.25 | $7.15 | $6.95 | $6.85 | $6.80 | $6.75 | $6.65 |
| Adult 10x (general, fitness, pickleball, duffer) | $67.50 | 3.37% | 65.30 | $64.40 | $62.50 | $58.68 | $58.28 | $57.87 | $56.97 |
| Adult 25x (general, fitness, pickleball, duffer) | $150.00 | 3.45% | 145.00 | $143.00 | $139.00 | $130.40 | $129.50 | $128.60 | $126.60 |
| Adult 1 month | $75.00 | 3.45% | 72.50 | $72.00 | $71.60 | $67.00 | $63.00 | $62.00 | $60.00 |
| Adult 3 month | $187.50 | 3.45% | 181.25 | $178.75 | $164.67 | $154.00 | $146.00 | $144.00 | $140.00 |
| Adult 12 month | $517.00 | 3.61% | 499.00 | $492.00 | $451.50 | $425.00 | $405.00 | $395.00 | $385.00 |
| Adult Groups (11+) - rate per person | $6.75 | 3.85% | 6.50 | $6.40 | $6.25 | $5.87 | $5.83 | $5.79 | $5.70 |
| Senior Single Admission (60 plus) | $5.70 | 4.54% | 5.45 | $5.35 | $5.25 | $5.15 | $5.00 | $4.90 | $4.75 |
| Senior 10x | $50.60 | 3.26% | 49.00 | $48.30 | $47.30 | $44.10 | $42.84 | $42.03 | $40.68 |
| Senior 25x | $112.50 | 3.45% | 108.75 | $107.25 | $105.00 | $98.00 | $95.20 | $93.40 | $90.40 |
| Senior Groups (11+) - per person | $5.06 | 3.26% | 4.90 | $4.80 | $4.70 | $4.41 | $4.29 | $4.20 | $4.07 |
| Youth Single Admission (13 - 18) | $5.15 | 1.08% | 5.10 | $5.00 | $4.75 | $4.75 | $4.75 | $4.75 | $4.75 |
| Youth 10x | $46.20 | 1.11% | 45.70 | $45.00 | $42.70 | $40.68 | $40.68 | $40.68 | $40.68 |
| Youth 25x | $103.00 | 1.48% | 101.50 | $100.00 | $95.00 | $90.40 | $90.40 | $90.40 | $90.40 |
| Youth Groups (11+) - per person | $4.62 | 0.43% | 4.60 | $4.50 | $4.30 | $4.27 | $4.07 | $4.07 | $4.07 |
| Child Single Admission (6 - 12) | $4.25 | 6.19% | 4.00 | $3.95 | $3.65 | $3.55 | $3.50 | $3.30 | $3.25 |
| Child 10x | $38.00 | 5.84% | 35.90 | $35.40 | $34.50 | $30.42 | $29.97 | $28.26 | $27.86 |
| Child 25x | $85.00 | 6.58% | 79.75 | $78.50 | $73.00 | $67.60 | $66.60 | $62.80 | $61.90 |
| Child Groups (11+) - per person | $3.80 | 5.54% | 3.60 | $3.50 | $3.40 | $3.19 | $3.00 | $2.83 | $2.79 |
| Family Single Admission (Max. 5) | $15.00 | 3.45% | 14.50 | $14.30 | $13.90 | $13.69 | $13.60 | $13.50 | $13.25 |
| Family 10x (general) | $135.00 | 3.45% | 130.50 | $128.70 | $125.10 | $117.36 | $116.55 | $115.74 | $113.58 |
| Family 3 month | $375.00 | 3.45% | 362.50 | $357.50 | $329.34 | $292.00 | $292.00 | $288.00 | $280.00 |
| Family 12 month | $1,033.00 | 3.51% | 998.00 | $985.00 | $903.00 | $850.00 | $810.00 | $790.00 | $770.00 |
INDOOR FACILITIES RENTAL FEES (Rooms, Pools, Fields, etc.)
Selected rates effective 01-Sep-24 (per hour unless noted):
| Item | 01-Sep-24 | % Increase | 2023 |
|---|---|---|---|
| Adult (room rates etc.) | 43.00 $ | 5.00% | 40.95 $ |
| Youth (room rates) | 24.26 $ | 5.00% | 23.10 $ |
| Commercial/Party Room Rental (per/hr with 2hr min) | 57.33 $ | 5.00% | 54.60 $ |
| Adult / Community (rooms) | 19.60 $ | 5.11% | 18.65 $ |
| Youth / Community | 14.70 $ | 5.00% | 14.00 $ |
| Adult / Meetings or User Group | 58.45 $ | 5.04% | 55.65 $ |
| Youth / Meetings or User Group | 39.15 $ | 4.97% | 37.30 $ |
| Commercial Rental (per/hr with 2hr min) | 72.75 $ | 4.97% | 69.30 $ |
| Commercial - Per Lane | 40.40 $ | 4.00% | 38.85 $ |
| Adult - Per Lane | 34.95 $ | 4.03% | 33.60 $ |
| Youth - Per Lane | 21.85 $ | 4.05% | 21.00 $ |
| Group Booking Fee | 76.45 $ | 4.01% | 73.50 $ |
| Lifeguard/Instructor Fee (additional staff) | 38.20 $ | 3.95% | 36.75 $ |
| Turf Prime Time (4pm-10pm Mon-Fri, 9am-10pm Sat-Sun) | 87.35 $ | 3.99% | 84.00 $ |
| Turf Commercial Prime | 111.40 $ | 4.02% | 107.10 $ |
| Turf Non-Prime | 57.90 $ | 4.04% | 55.65 $ |
| Turf Commercial Non-Prime | 87.35 $ | 3.99% | 84.00 $ |
| Turf Summer (May 1 - Aug 31 excl events) | 52.40 $ | 3.96% | 50.40 $ |
| Half Sport Floor Prime Time | 39.30 $ | 3.97% | 37.80 $ |
| Half Sport Floor Commercial Prime | 81.90 $ | 4.00% | 78.75 $ |
| Half Sports Floor Non-Prime | 27.85 $ | 3.92% | 26.80 $ |
| Half Sports Floor Commercial Non-Prime | 76.45 $ | 4.01% | 73.50 $ |
| Indoor Sports Complex Full Day (24 hrs) - Community Group | 1,310.40 $ | 4.00% | 1,260.00 $ |
| Indoor Sports Complex Full Day (24 hrs) - Commercial | 2,402.40 $ | 4.00% | 2,310.00 $ |
(Room descriptions: Large Rooms include Kinsmen Fieldhouse, Langford/Highlands combined, 55+ Centre Auditorium & Room 101. Small Rooms include Westshore Room, Upper and Lower Clubhouse, JDF 55+Activity Centre, Langford, and Highlands.)
ARENA FACILITIES RENTAL FEES (JDF Arena / The Q Centre)
Rates per hour unless otherwise noted — effective 01-Sep-24
| Item | 01-Sep-24 | % Increase | 2023 |
|---|---|---|---|
| Ice - Adult Prime Time* | 278.45 $ | 4.00% | 267.75 $ |
| Ice - Adult Non-Prime** | 185.65 $ | 4.01% | 178.50 $ |
| Ice - Youth Prime Time* | 157.25 $ | 4.00% | 151.20 $ |
| Ice - Youth Non-Prime** | 127.75 $ | 3.99% | 122.85 $ |
| Ice - Commercial Prime Time | 305.75 $ | 4.00% | 294.00 $ |
| Ice - Youth Commercial | 174.70 $ | 3.99% | 168.00 $ |
| Skate Rentals (tax incl) | 4.10 $ | 4.00% | 3.94 $ |
| Arena Dry Floor - Adult | 100.45 $ | 3.99% | 96.60 $ |
| Arena Dry Floor - Youth | 67.70 $ | 4.00% | 65.10 $ |
| JdF Arena Full Day (24 hrs) - Community Group | 1,310.40 $ | 4.00% | 1,260.00 $ |
| JdF Arena Full Day (24 hrs) - Commercial | 2,402.40 $ | 4.00% | 2,310.00 $ |
| The Q Centre Full Day (24 hrs) - Community Group | 2,402.40 $ | 4.00% | 2,310.00 $ |
*Prime: M-F 6:00 am - 8:00 am, 4:00 pm-11:30 pm / Sat & Sun 6:00 am - 11:30 pm
**Non-Prime: M-F 8:00 am - 4:00 pm & 11:30 pm - Midnight / Sat & Sun 11:30 pm - Midnight
Move/In Out days for full day rentals will be 50% of the base rate.
OUTDOOR FACILITIES RENTAL FEES (Selected)
| Item | 01-Sep-24 | % Increase | 2023 |
|---|---|---|---|
| Youth (fields, per hour) | 10.75 $ | 4.90% | 10.25 $ |
| Adult (fields, per hour) | 21.50 $ | 4.90% | 20.50 $ |
| Commercial - Youth | 21.50 $ | 4.90% | 20.50 $ |
| Commercial - Adult | 43.05 $ | 5.00% | 41.00 $ |
| Lights - Field 1,2 & 3 - Youth & Adult * | 40.75 $ | 5.03% | 38.80 $ |
| Youth - Artificial Turf Field Youth Prime-Time** | 44.10 $ | 5.00% | 42.00 $ |
| Youth - Artificial Turf Field Youth Non-Prime*** | 22.05 $ | 5.00% | 21.00 $ |
| Adult - Artificial Turf Field | 71.65 $ | 4.99% | 68.25 $ |
| Commercial - Adult - Artificial Turf | 107.50 $ | 4.99% | 102.40 $ |
| Lights - Artificial Turf Field | 29.80 $ | 4.94% | 28.40 $ |
| Lights - Lacrosse Box | 11.55 $ | 5.01% | 11.00 $ |
| Track rental | 25.40 $ | 4.96% | 24.20 $ |
| Lights - Velodrome | 29.80 $ | 4.94% | 28.40 $ |
| Entire Picnic Shelter | 36.95 $ | 5.00% | 35.20 $ |
*Lights can be booked in 1/2 hour blocks at 50% of rate.
**Prime: All day time hours excluding Non-Prime time hours.
***Non-Prime: School Days 8:00 am - 3:30 pm (based on SD #62 calendar)
GOLF COURSE GREEN FEES AND RENTALS
(Selected seasonal and rental rates — effective dates noted)
| Item | Effective Date | 2024 Rate | % Increase | 2023 |
|---|---|---|---|---|
| Child/Youth (Summer Apr 1 2024 rate shown) | 01-Apr-24 | 11.45 $ | 4.09% | 11.00 $ |
| Adult (Summer) | 01-Apr-24 | 18.20 $ | 4.00% | 17.50 $ |
| Family (Summer) ** | 01-Apr-24 | 48.35 $ | 3.99% | 46.50 $ |
| Summer 10X Pass - Adult | 01-Apr-24 | 182.00 $ | 4.00% | 175.00 $ |
| Summer 10X Pass - Child/Youth | 01-Apr-24 | 114.40 $ | 4.00% | 110.00 $ |
| Child/Youth (Winter Oct 1 2024 rate shown) | 01-Oct-24 | 9.35 $ | 3.89% | 9.00 $ |
| Adult (Winter) | 01-Oct-24 | 12.50 $ | 4.17% | 12.00 $ |
| Family (Winter) ** | 01-Oct-24 | 34.30 $ | 3.95% | 33.00 $ |
| Winter 10X Pass - Adult | 01-Oct-24 | 125.00 $ | 4.16% | 120.00 $ |
| Winter 10X Pass - Child/Youth | 01-Oct-24 | 93.50 $ | 3.89% | 90.00 $ |
| Extra Rounds | 01-Apr-24 | 8.50 $ | 6.24% | 8.00 $ |
| Club Rentals | 01-Apr-24 | 8.50 $ | 6.24% | 8.00 $ |
| Cart Rentals | 01-Apr-24 | 5.50 $ | 4.76% | 5.25 $ |
Winter season: October 1, 2024 - March 31, 2025.
Summer season: April 1, 2024 - September 30, 2024.
**Family rate includes four (4) people with 2 adults maximum.
Additional items and full fee schedules included are as per the package (Tables continue to list historical rates back to 2018).
[End of extracted content from pages 51–82 of the Appendix: 2024 West Shore Parks & Recreation Society (WSPRS) Budget Package to Council]