DocumentsPresentationAug 21, 2023Pages 2–36
Transportation Governance Engagement Workbook (presentation)
CRD slide presentation outlining the rationale, regional transportation goals, governance options (three-level framework), engagement scope and timeline for transportation governance engagement in the Capital Regional District.
Key facts
- Regional transportation goals: ease congestion; support higher rates of walking, cycling and transit use; reduce emissions
- CRD boundary: 237,000 ha; 70 islands; 13 member municipalities; population est. 439,950 (2022)
- Governance framework: Level 1 (New CRD Service), Level 2 (Expand CRD Authority), Level 3 (New authority)
- Engagement timeline: Summer 2023 engagement; report back Fall 2023; longer-term steps through 2026+
Transportation Governance Engagement Workbook

Agenda
- Project rationale
- Transportation in the region
- Workbook input
- Next steps
- Discussion

Project rationale

Background — Why are we here?
- Transportation is a priority.
- Change is needed to achieve the ambitious goals set by the CRD.
- We need to hear from you about how much change you want to see.
Regional Transportation Goals
- Ease congestion
- Support higher rates of walking, cycling and transit use
- Reduce emissions

Background — What does the CRD currently offer?
- Policy, planning and data
- Regional trails
- Coordination
- Governance

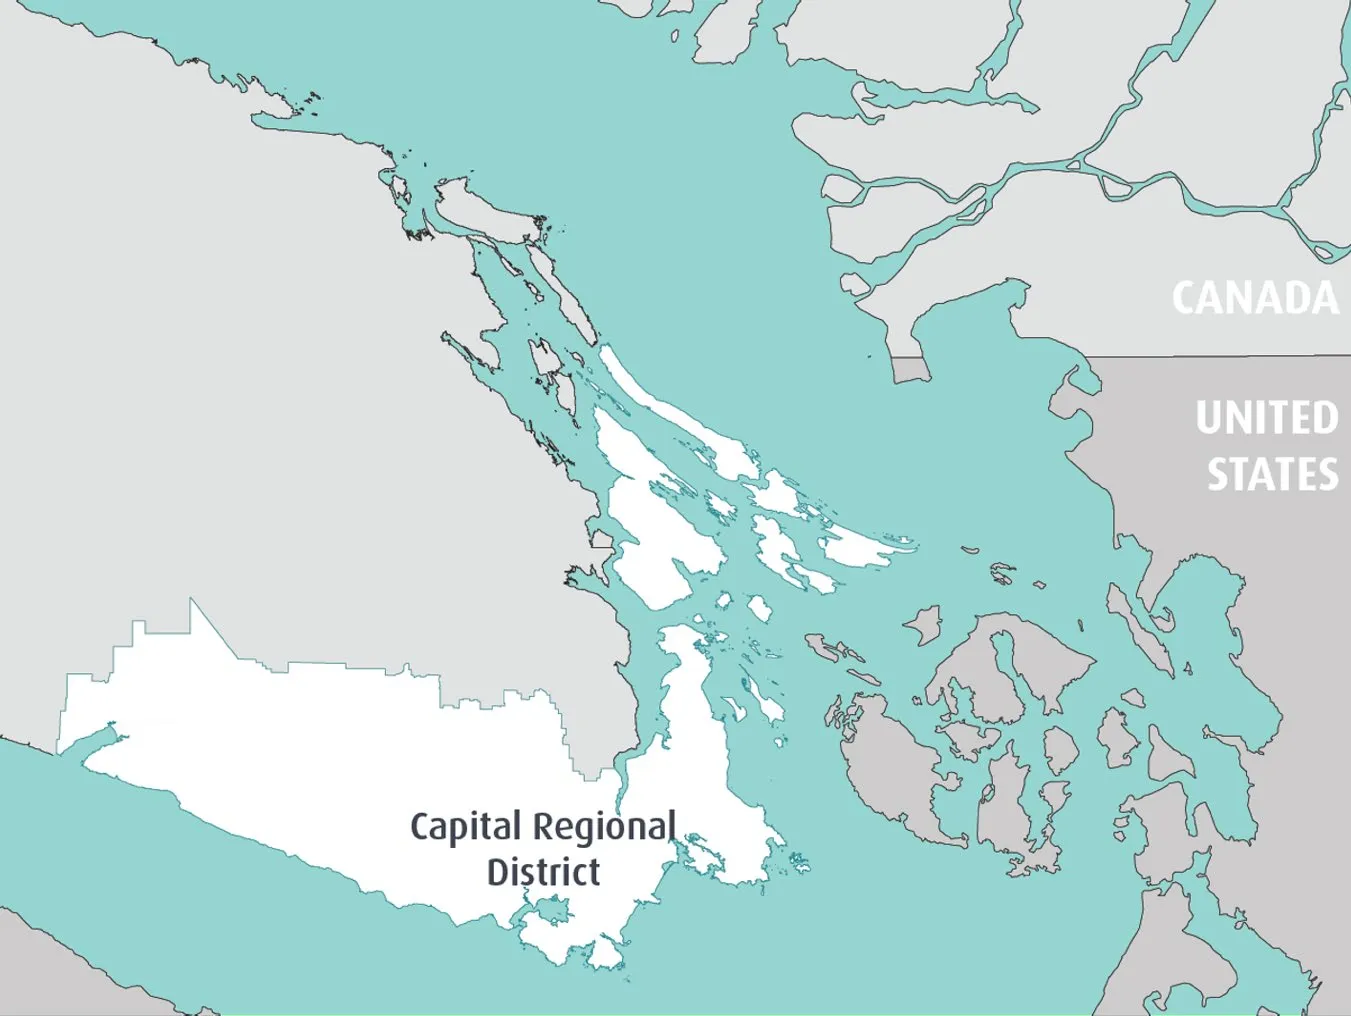
Boundary
- 237,000 ha.
- 70 Islands
- 13 Member Municipalities
- 3 Electoral Areas
- Population est. 439,950 (2022)
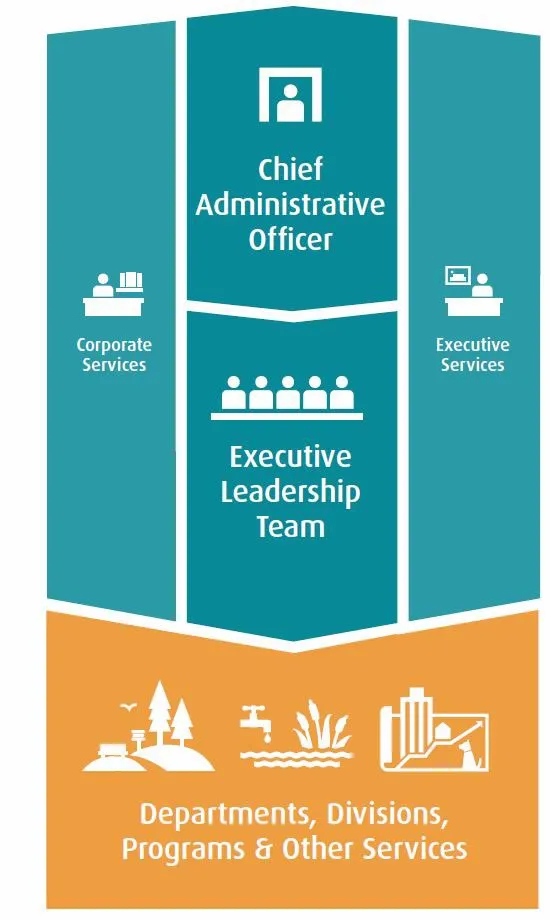
About the CRD – Jurisdictional Overview
Responsibilities (by level)
| Municipalities | Regional | Province | Sub-regional | Electoral Area |
|---|---|---|---|---|
| • Police services • Local roads • Local planning and development • Animal control • Trees • Building regulation • Public spaces • Other services specific to the municipality | • Regional emergency program • Solid waste & recycling • Housing • Parks & trails • Climate action • Regional planning | • Provincial parks • Highways & ferries • Healthcare & hospitals • Homelessness • Groundwater | • Fire dispatch • Water supply & wastewater • Recreation, arts & culture • Animal Care | • Fire protection • Building inspection • Grants-in-aid • Water & wastewater • Other bespoke local services |
| • | • Provincial parks • Highways & ferries • Healthcare & hospitals • Homelessness • Groundwater • BC Building Code • Education • Drivers’ licenses • Gaming • Landlord-tenant relations • Property assessments • Liquor laws | • | • | • |
Transportation in the region

Transportation governance in the capital region
CRD Transportation Committee / Board – same decision-makers as municipalities and VRTC
Advisory: Working Group and Traffic Safety Commission
Focus on data and planning alignment
13 local government councils
Representation at CRD and VRTC
Compete for limited funding
Focus on policy and service delivery
VRTC – same decision-makers as municipalities and regional Board
Compete for limited funding
Impacted by others’ decisions
Controls funding and legislation
Shifting priorities to climate action and complete communities
Responds to focused advocacy
Service / Planning roles by agency
| Service / Function | CRD | Municipalities | BC Transit / VRTC | MOTI |
|---|---|---|---|---|
| Governance features | CRD Transportation Committee / Board – same decision-makers as municipalities and VRTC; Advisory: Working Group and Traffic Safety Commission; Focus on data and planning alignment | 13 local government councils; Representation at CRD and VRTC; Compete for limited funding; Focus on policy and service delivery | VRTC – same decision-makers as municipalities and regional Board; Compete for limited funding; Impacted by others’ decisions | Controls funding and legislation; Shifting priorities to climate action and complete communities; Responds to focused advocacy |
| Regional and Multi-Use Trails | Primary | Direct service delivery impact | Consulted agency | Leases ROW |
| Regional and Local Roads | Planning / policy impact | Primary | Direct service delivery impact | Legislation / funding |
| Land Use – Corridors & Nodes | Planning / policy impact | Primary | Direct service delivery impact | Legislation |
| Regional Transit Network | Planning / policy impact | Direct service delivery impact | Primary | Legislation / funding |
| Provincial Highways | Planning / policy impact | Direct service delivery impact | Direct service delivery impact | Primary |
Regional Transportation Plan
Outcomes
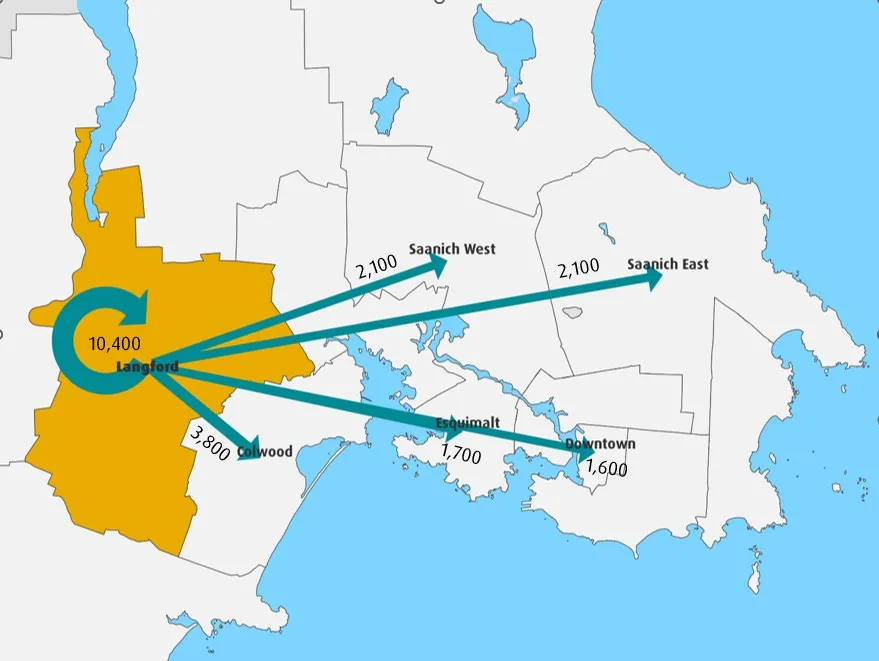
- Regional Multi-modal Network (RMN)
- Outcome statements
Actions
- Plans / policy
- Infrastructure, service delivery & programming
- Land use
- Behaviour change
Regional Transportation Priorities
- Advocate
- Act
- Pivot
Improve service delivery — Deliver services, coordinate and aim for consistency
Plan for long-term needs:
- Transit (RapidBus)
- Transit (general)
- Transit (non-bus mass transit)
- Highway safety & multi-modal improvements
- SSI / SGI connectivity
- Active transportation
- TDM
- Safety policy
- Strengthen land use
- Parking & access upgrades
- Governance
- Rail link & Westshore passenger ferry
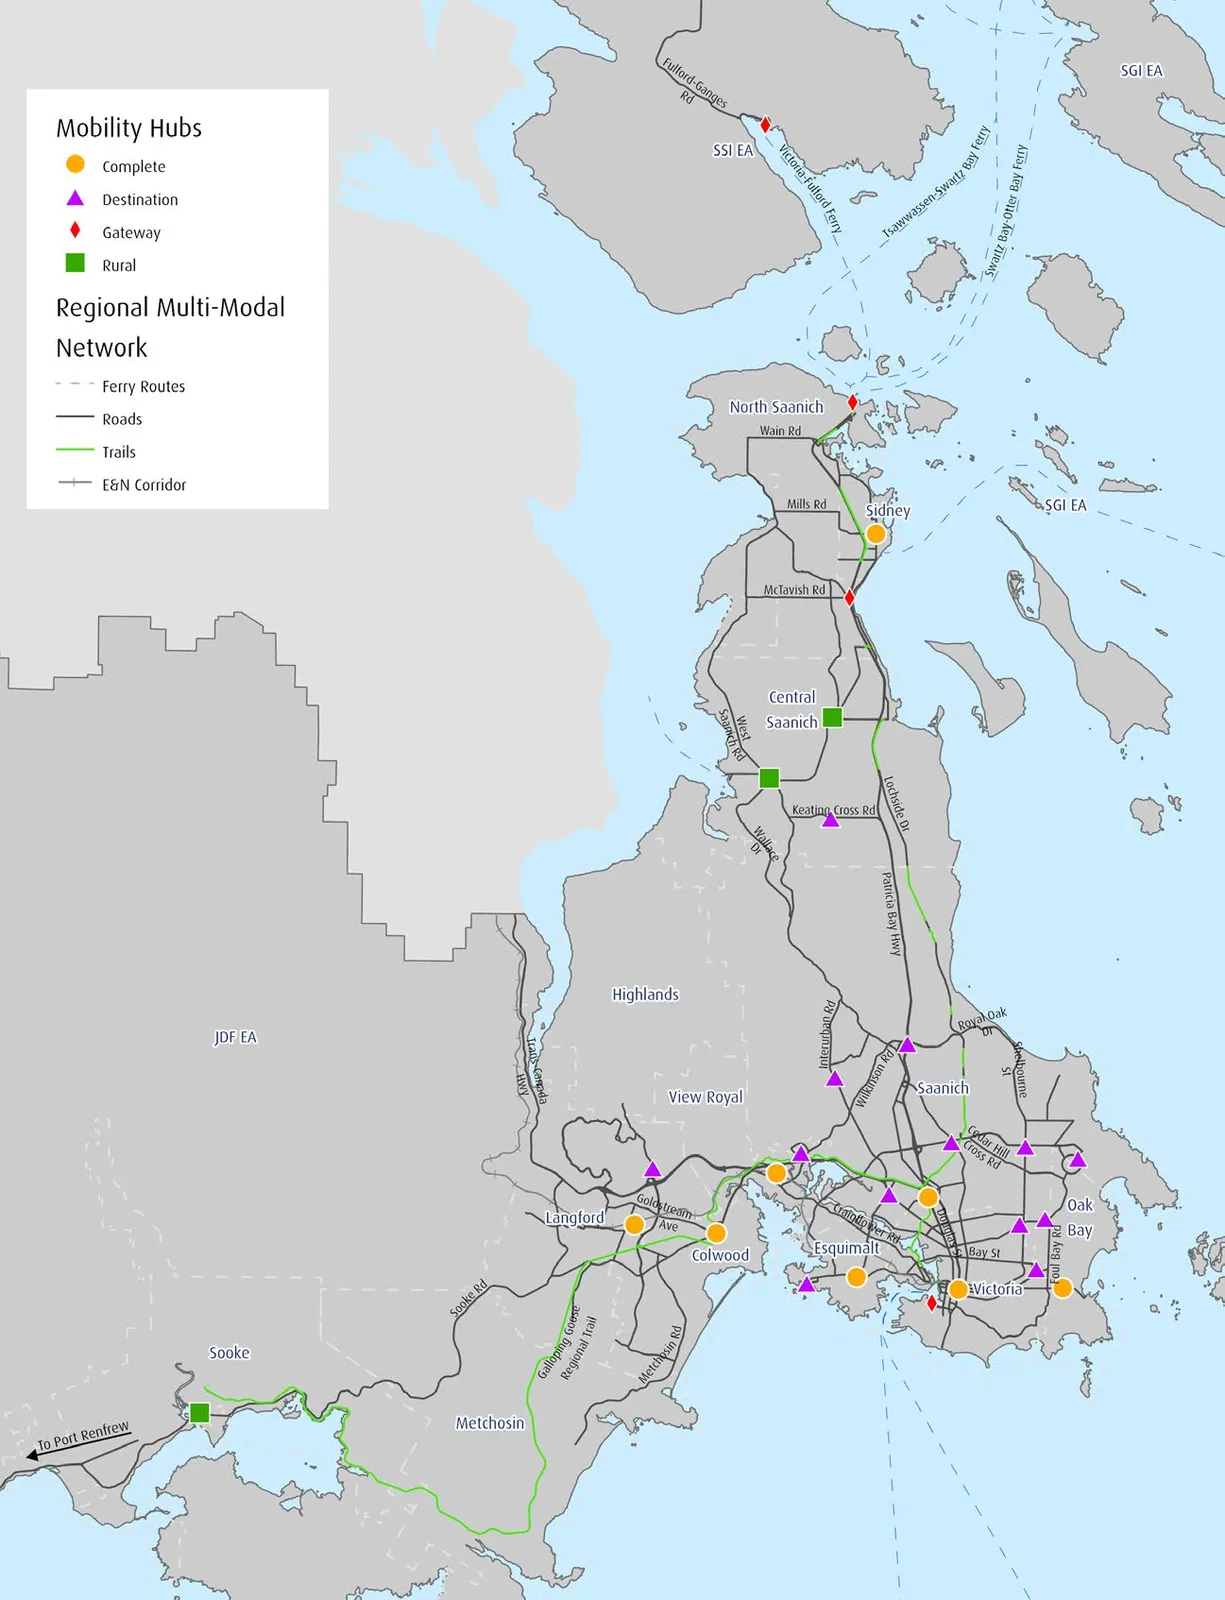
Sub-Regional Trip Patterns
Internal and External
2022 Origin Destination Household Travel Survey

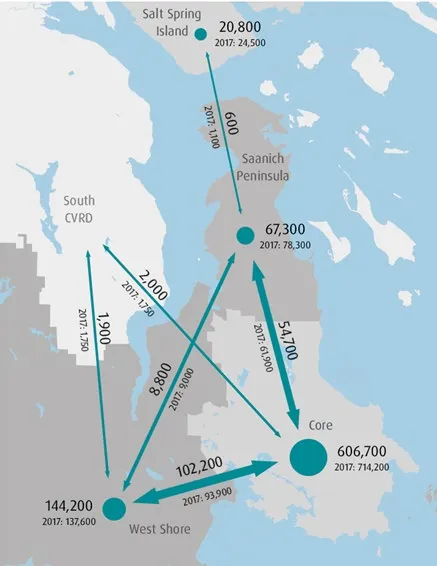
Top Five Destinations of AM Peak Trips from Langford
2022 Origin Destination Household Travel Survey
Delivering on resident expectations
- Live and work across local government boundaries
- Move easily across the region
- Expect quality service regardless of who delivers the service

Workbook Input
How far do we want to go?
Level 1: New CRD Service
CRD brings its transportation functions into one department to enable service-level changesLevel 2: Expand CRD Authority
CRD gets new funding and service authorities to change travel behaviour and build out the multi-modal networkLevel 3: New authority
One organization makes decisions about service levels and investment in the network
Scope of change the CRD could deliver, based on authorities permitted by legislation.
Scope of change that requires new legislative authorities.
What will it take?
A full transportation authority makes funding and service-level decisions related to multiple transportation modes.
Agreement needed on:
- Modes
- Service levels
- Funding model
- Reporting relationship

Engagement Scope
In Scope
- Test support for matters where greater regional focus is needed to advance transportation priorities
- Identify decision-making preferences related funding, planning, policy and service delivery
- Explore opportunities and constraints related to governance change
Out of Scope
- Updating the Regional Transportation Plan
- Making changes to the regional multi-modal network
- Identifying transportation issues and priorities
- Amending authorities set out in legislation

Who is being engaged?
- 13 municipalities
- Three electoral areas
- Agency partners (e.g., BC Transit, Victoria Regional Transit Commission, BC Ferries, Airport Authority, Island Corridor Foundation, Province)
- First Nations are invited to participate

Engagement Workbook
- Introduction and background
- Questionnaire
- Glossary
Questionnaire
In filling out the questionnaire, you will:
- Select between local and regional trade-offs
- Select your level of agreement with key statements about a change in governance
- Identify benefits, concerns and priorities
- Provide examples, comments and suggestions

Examples — Considering trade-offs
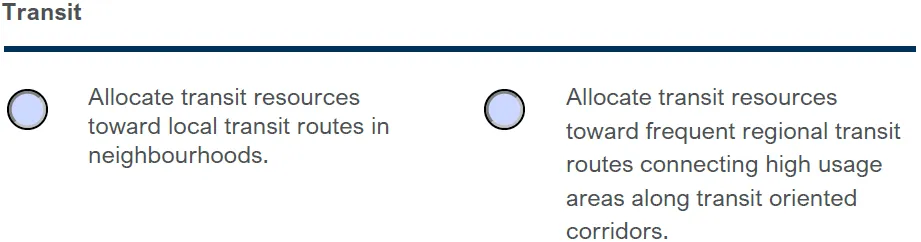
Question 1. A – I
Transit
- Allocate transit resources toward local transit routes in neighbourhoods.
- Allocate transit resources toward frequent regional transit routes connecting high usage areas along transit oriented corridors.
Understanding expectations
Question 2. A – D
Agree — Neither agree nor disagree — Disagree
A new governance structure should strike a balance between regional and local priorities.

Examples — Identifying opportunities (select)
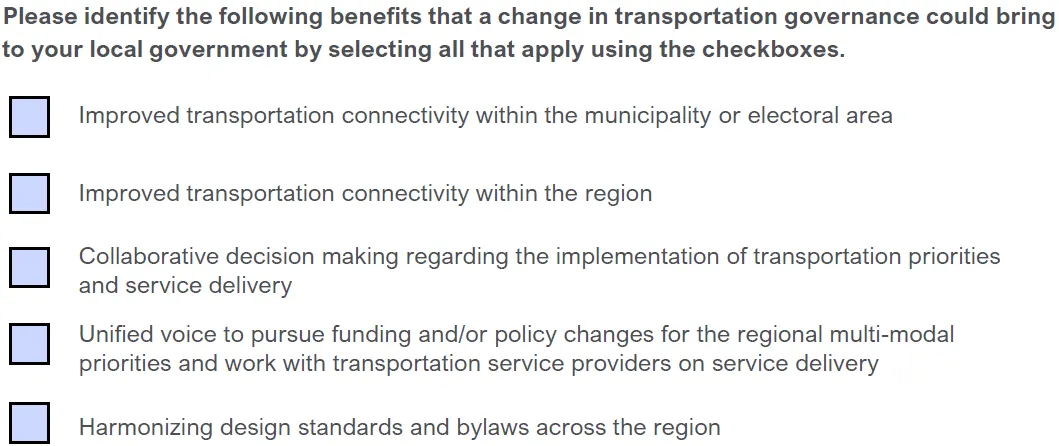
Questions 3-4 (select)
Please identify the following benefits that a change in transportation governance could bring to your local government by selecting all that apply using the checkboxes.
- Improved transportation connectivity within the municipality or electoral area
- Improved transportation connectivity within the region
- Collaborative decision making regarding the implementation of transportation priorities and service delivery
- Unified voice to pursue funding and/or policy changes for the regional multi-modal priorities and work with transportation service providers on service delivery
- Harmonizing design standards and bylaws across the region

Examples — Identifying opportunities (rank)
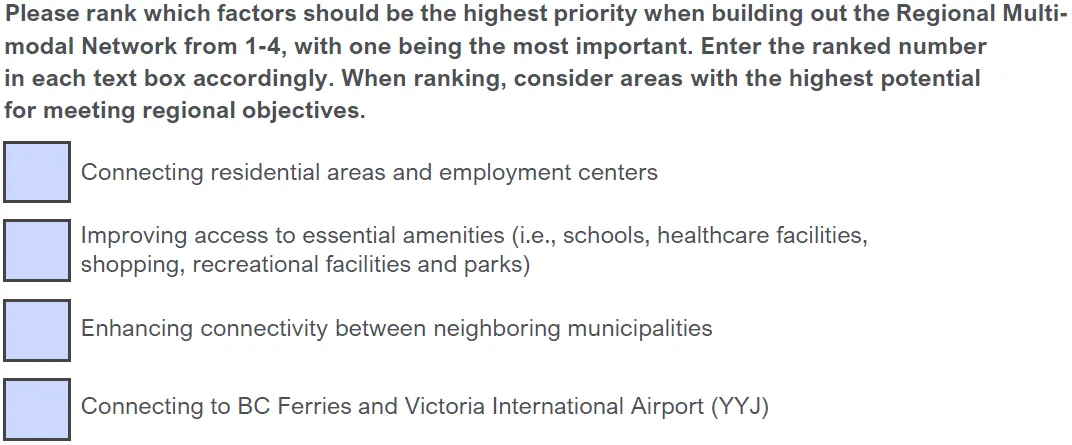
Questions 5-6 (rank)
Please rank which factors should be the highest priority when building out the Regional Multi-modal Network from 1-4, with one being the most important. Enter the ranked number in each text box accordingly. When ranking, consider areas with the highest potential for meeting regional objectives.
- Connecting residential areas and employment centers
- Improving access to essential amenities (i.e., schools, healthcare facilities, shopping, recreational facilities and parks)
- Enhancing connectivity between neighboring municipalities
- Connecting to BC Ferries and Victoria International Airport (YYJ)
Examples — Open-ended
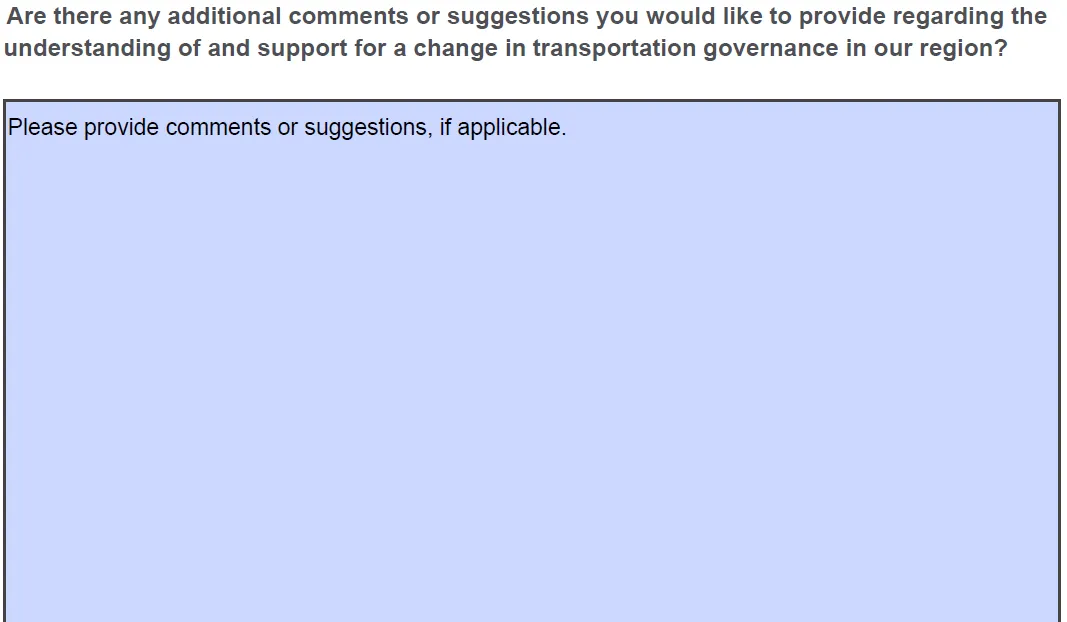
Question 7
Are there any additional comments or suggestions you would like to provide regarding the understanding of and support for a change in transportation governance in our region?
Please provide comments or suggestions, if applicable.
Next steps
Engagement timeline
Spring 2023
Present jurisdictional scan and governance concepts.
Seek direction to engage on scope and scale of change.Summer 2023
Broadly engage local governments, BC Transit, Ministry of Transportation and Infrastructure (MOTI), BC Ferries and the airport authority and analyze level of consensus of possible change.Fall 2023
Report back on level of consensus.
Decide on governance change achievable over this Board term.
Long-term timeline
- Engagement & Analysis — Summer 2023
- Reporting — Fall 2023
- Analysis and Options Development — Fall 2023
- Service establishment — 2024
Undertake service approval and enact a service establishment bylaw - Business case for an authority — 2025-2026
Pending support, begin a business case for a new authority - Implementation & delivery — 2025-ongoing
Implement required internal changes to increase service levels, prove feasibility - Delivery — 2026-on
Advocate for legislative change and implement new authority
- The long-term timeline is subject to level of consensus and approvals outside of regional district and local government control.
What is success?
By the end of the Board term, the region has taken a concrete first step toward changing authorities.
Background — What have others done?
Components to an authority:
- Multi-modal
- Able to make decisions
- Stable funding
Translink, Auckland Transport and Halifax Regional Municipality all operate different transportation authorities.

Comparing different authorities
Governance features overview
CRD:
- No mechanism to collectively address impact of decisions
- Compete for funding
- Focus on planning alignment
TransLink:
- Funding incentivizes collective decisions on regional network
- Limited funding source
- Complex decision-making
Auckland Transport:
- Single local government
- Local and Federal government control of funding
- Does not set mobility outcomes; deliver on local government goals
Halifax Regional Municipality (HRM):
- Single local government
- Significant control over mobility outcomes
- Product of amalgamation
Roles by function (summary)
| Function | CRD | TransLink (Metro Vancouver) | Auckland Transport | Halifax Regional Municipality (HRM) |
|---|---|---|---|---|
| Regional and Multi-Use Trails | CRD | TransLink | Auckland Transport | HRM |
| Regional and Local Roads | Local Governments | TransLink / Local Governments | Auckland Transport | HRM |
| Regional Transit Network | BC Transit | TransLink / Local Governments | Auckland Transport | HRM |
| Land Use – Corridors & Nodes | Local Governments | Local Government / Metro Vancouver | Local Government | HRM |
| Provincial Highways | Province | Province | Federal Government | Province |
What can we learn?
- Need strong business case for change
- Takes time to become fully operational – deliver in increments
- Build from a solid base – get the tools needed to control mobility
Discussion
Document Images
(4)