DocumentsStaff ReportJan 24, 2022Pages 159–192
Report — West Shore Parks and Recreation Society 2022 Budget
Staff report and attachments summarizing the West Shore Parks and Recreation Society proposed budget for 2022, for Council consideration and comment.
Key facts
- Agenda item: 9.1 (starts p.159)
- Subject: West Shore Parks and Recreation Society 2022 budget documentation
- Includes multi-page budget materials and financial implications for member municipalities
Staff Report to Council (City of Langford)
DATE: Monday, January 24, 2022
DEPARTMENT: Finance
SUBJECT: West Shore Parks and Recreation Society 2022 Budget
COMMENTARY:
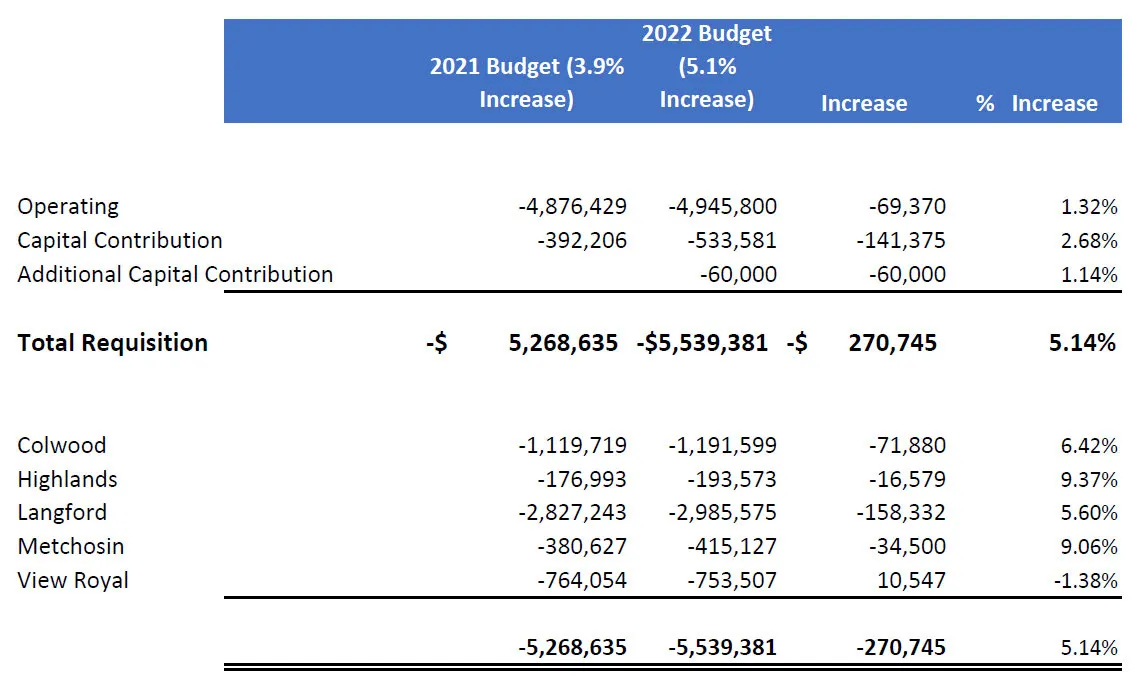
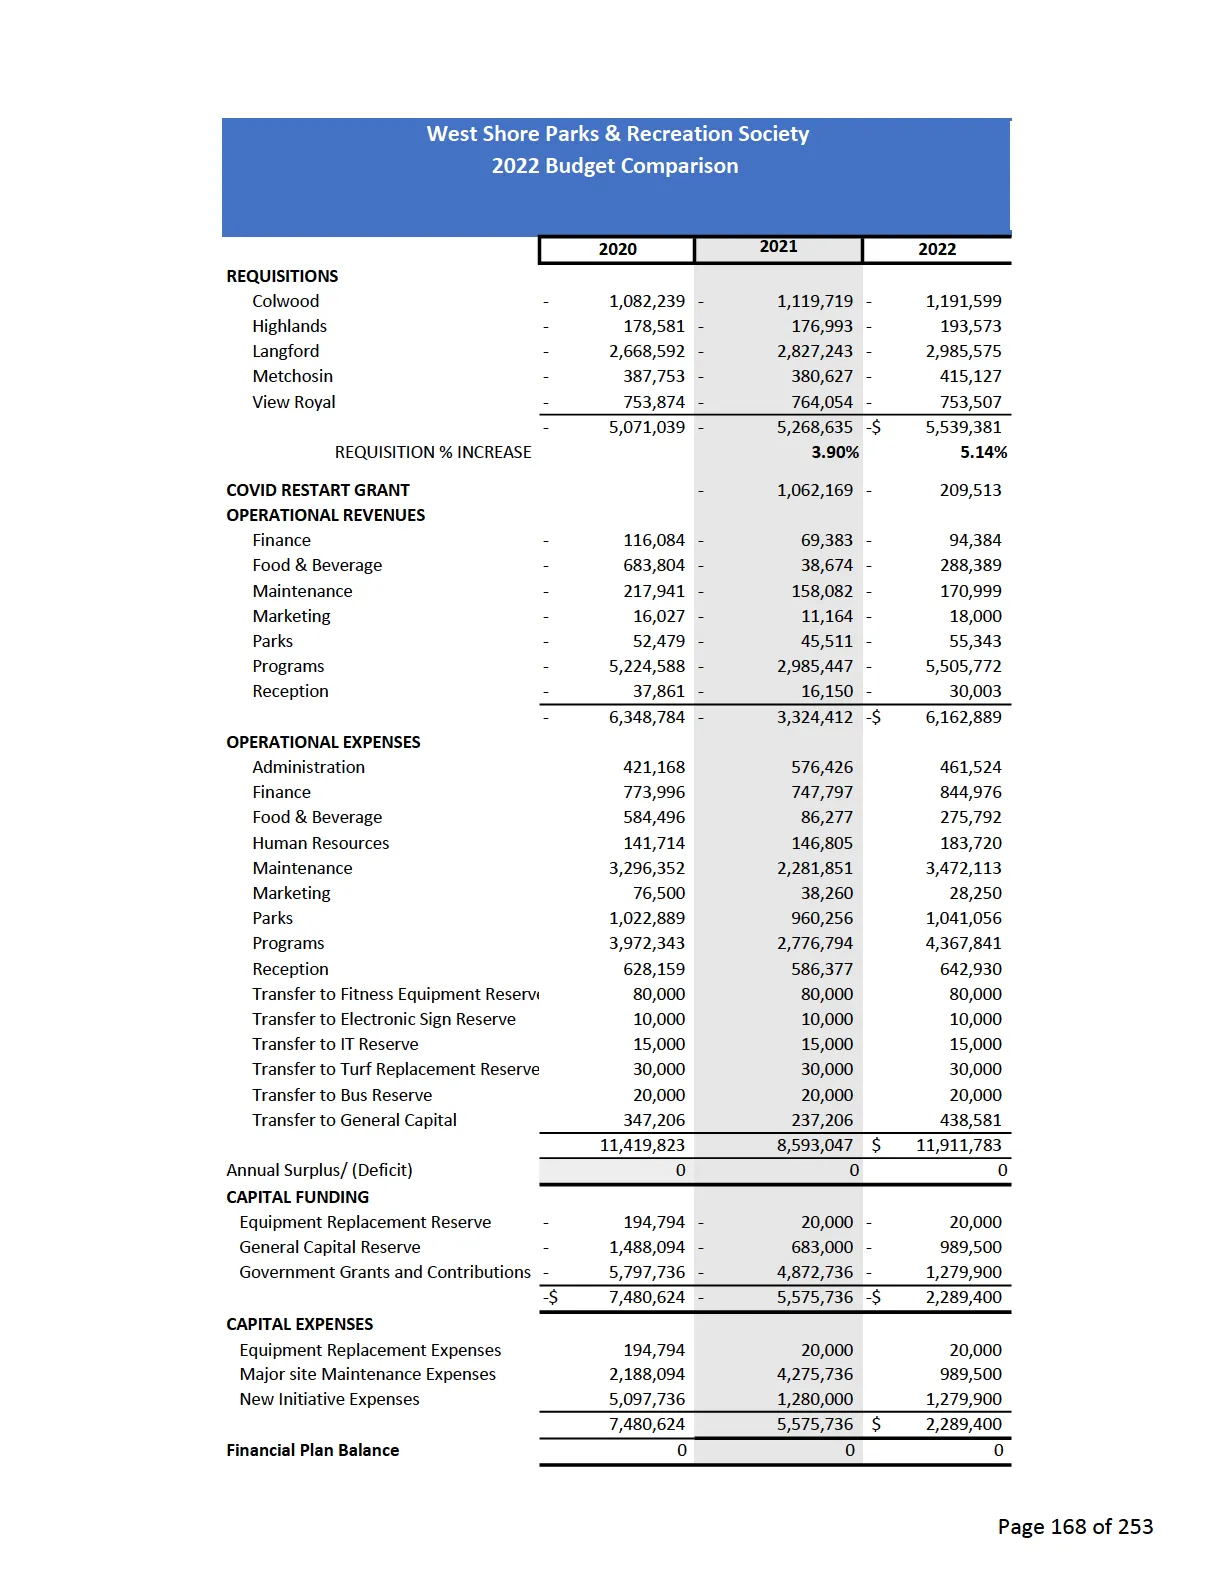
Attached is the 2022 budget that is proposed and submitted for approval by the West Shore Parks & Recreation Society (WSPRS) Board of Directors. The total municipal requisitions for WSPRS in the attached budget are $5,539,381, of which Langford’s portion is $2,985,575. This represents an increase of $158,332 increase over 2021.
FINANCIAL IMPLICATIONS:
An increase of $158,651 represents approximately a 0.50% increase to the municipal budget. Due to Langford’s assessment growth the increase can be funded through tax revenue from new assessment.
LEGAL IMPLICATIONS:
Under the terms of the Operating Maintenance and Management Agreement between the owners and WSPRS, the annual budget must be approved unanimously. Failure to approve would mean that the previous year’s budget would carry into the current year.
OPTIONS:
Option 1
THAT Council approve the 2022 West Shore Parks and Recreation Society budget;
OR Option 2
West Shore Parks & Recreation Society (WSPR) STAFF REPORT
TO: West Shore Parks & Recreation Society Members
FROM: Grant Brown, Administrator
DATE: December 1st, 2021
SUBJECT: 2022 Budget and Requisition Request
RECOMMENDATION:
That the West Shore Parks & Recreation Society Members review and approve the West Shore Parks & Recreation Society 2022 budget and requisition request as presented.
BACKGROUND:
On November 18th, 2021, the West Shore Parks & Recreation Society Board of Directors moved
THAT THE DRAFT 2022 WSPR BUDGET AND THE DRAFT 2022-2023 FEES AND CHARGES BE APPROVED AND PRESENTED TO COUNCIL MEMBERS.
Included in this package you will find the above noted financial information for the West Shore Parks & Recreation Society. The package has been divided into sections to aid in analysis and includes the following: Five-Year Consolidated Financial Plan, Budget Comparisons, Capital Summary, Reserve Continuity, Requisition Request and Per Capita Costs, Assessment Totals, Impact to Taxation, Operating Summary and Fees and Charges.
The Five-Year Financial Plan layout has been redesigned to provide the same look and feel as the Financial Plan Bylaw completed by each of the municipalities.
DISCUSSION:
The 2022 West Shore Parks & Recreation Society’s requisition request is for $5,539,381 which is a $270,745 or 5.14% increase over the 2021 approved requisition. The proposed budget includes a request to defer $209,513 of unspent COVID Restart funds from 2021 to 2022 to help offset costs to restart services while we recover from the impact of the COVID pandemic. Not including the deferral of these funds will result in a requisition increase of 9.14%, or an additional 4.00%.
The first review of the 2022 Budget in October included a 4.00% increase for 2022, and at the direction of the Municipal Owners we have added an additional contribution to capital for $60,000. The additional contribution progresses WSPRS towards its goal of obtaining sufficient funding for the maintenance and replacement of existing infrastructure. The transfer to general capital was $347,206 in 2020 and decreased to $237,206 in 2021. For 2022, we’re proposing to increase the transfer to $378,581 which matches the approved 5-Year Financial Plan from 2021.
One of the challenges with preparing the budget for 2022 has been adding back the pool operating costs. In 2021, $690,000 of restart funds were received to offset the cost of operating the pool. Utilizing the unspent COVID restart funds in 2022 helps soften the impact of adding the pool into the budget.
The 2022 budget includes the following:
- Non-discretionary increase in expenses $195,700:
- Collectively bargained wage increases $112,000
- Various utility increases $40,000
- Insurance premium increases $35,000
- Various service increases $8,700
- Major Repair & Maintenance projects include:
- Vehicle Replacement $197,000
- Lower Park High Power Switch $70,000
- Pool Main Filter $90,000
- Q Centre Floor LED Lighting $60,000
- Lacrosse Box Score Clock $14,000
- Fitness/Changeroom Roof $200,000
- Reserve fund transfers totalling $1,009,500
- Fitness Equipment Reserve $20,000 (contribute $80,000 annually)
- Equipment & Maintenance Reserve $989,500
- Skate Park (if funding secured)
- Project Cost $1,279,900
- Canada Community Revitalization Fund of Western Canada Grant $627,151 (application submitted August 2021)
- Remaining funds to be a combination of donations, fundraising and a financial plan amendment request as per the Operating, Maintenance and Management Agreement, which was discussed at the Owners Meeting on October 26th, 2021.
Total operating changes: net expense increased $270,745.
Total capital changes: net expense maintained.
FINANCIAL IMPLICATIONS:
The 2022 budget and requisition request of $5,539,381 is an increase of $270,745 or 5.14% over the approved 2021 budget requisition.
Grant Brown, Administrator
Council Motion (Langford)
THAT Council reject the 2021 West Shore Parks and Recreation Society budget and advise WSPRS of the reasons for rejection.
SUBMITTED BY: Michael Dillabaugh, CPA, CA, Director of Finance
Concurrence: Donna Petrie, Manager of Business Development and Events
Concurrence: Matthew Baldwin, MCIP, RPP, Director of Planning and Subdivision
Concurrence: Michelle Mahovlich, P.Eng, P.Geo, Director of Engineering and Public Works
Concurrence: Marie Watmough, Acting Director of Corporate Services
Concurrence: Darren Kiedyk, Chief Administrative Officer
2022 Budget — Requisition Request (summary)
Requisition Request by Municipality (2021 → 2022)
| Municipality | 2021 Budget | 2022 Budget (5.14% Increase) | Increase | % Increase |
|---|---|---|---|---|
| Colwood | -1,119,719 | -1,191,599 | -71,880 | 6.42% |
| Highlands | -176,993 | -193,573 | -16,579 | 9.37% |
| Langford | -2,827,243 | -2,985,575 | -158,332 | 5.60% |
| Metchosin | -380,627 | -415,127 | -34,500 | 9.06% |
| View Royal | -764,054 | -753,507 | 10,547 | -1.38% |
| Total | -$ 5,268,635 | -$ 5,539,381 | -$ 270,745 | 5.14% |
Per Capita (2021 → 2022)
| Municipality | Population* | 2021 Budget | 2021 Per Capita | 2022 Budget | 2022 Per Capita | Capita Increase (decrease) |
|---|---|---|---|---|---|---|
| Colwood | 18,403 | $ 1,119,719 | 60.84 | $ 1,191,599 | $ 64.75 | $ 3.91 |
| Highlands | 2,452 | $ 176,993 | 72.18 | $ 193,573 | $ 78.94 | $ 6.76 |
| Langford | 39,352 | $ 2,827,243 | 71.84 | $ 2,985,575 | $ 75.87 | $ 4.02 |
| Metchosin | 5,127 | $ 380,627 | 74.24 | $ 415,127 | $ 80.97 | $ 6.73 |
| View Royal | 11,460 | $ 764,054 | 66.67 | $ 753,507 | $ 65.75 | -$ 0.92 |
*From Capital Regional District 2019-2038 Population, Dwelling Units and Employment Projection Report
Converted Assessments (2021 / 2020 comparison)
| Municipality | General | Exempt | Total | % Total (2021) | 2020 Total | % Total (2020) | % Change |
|---|---|---|---|---|---|---|---|
| City of Colwood | $ 517,095,605 | $ 56,215,695 | $ 573,311,300 | 21.51% | $ 528,656,626 | 21.25% | 8.45% |
| District of Highlands | 92,852,540 | 280,595 | 93,133,135 | 3.49% | 83,564,366 | 3.36% | 11.45% |
| City of Langford | 1,428,716,935 | 7,725,809 | 1,436,442,744 | 53.90% | 1,334,835,655 | 53.66% | 7.61% |
| District of Metchosin | 156,115,456 | 43,613,817 | 199,729,273 | 7.49% | 179,706,813 | 7.22% | 11.14% |
| Town of View Royal | 361,744,368 | 788,528 | 362,532,896 | 13.60% | 360,735,206 | 14.50% | 0.50% |
| Total | $ 2,556,524,904 | $ 108,624,444 | $ 2,665,149,348 | 100.00% | $ 2,487,498,666 | 100.00% | 7.14% |
Total Property Tax — Impact by Municipality
| Municipality | 2021 Total Property Tax | 2022 INCREASE | 2022 INCREASE % | Population | Per Capita (2022) |
|---|---|---|---|---|---|
| Colwood | $15,147,000 | 71,880 | 0.47% | 18,403 | $3.91 |
| Highlands | $2,158,130 | 16,579 | 0.77% | 2,452 | $6.76 |
| Langford | $35,291,050 | 158,332 | 0.45% | 39,352 | $4.02 |
| Metchosin | $2,122,766 | 34,500 | 1.63% | 5,127 | $6.73 |
| View Royal | $9,549,553 | -10,547 | -0.11% | 11,460 | -$0.92 |
Budget Comparison (Operating / Capital summary)
| Category | 2021 Budget (3.9% Increase) | 2022 Budget (5.1% Increase) | Increase | % Increase |
|---|---|---|---|---|
| Operating | -4,876,429 | -4,945,800 | -69,370 | 1.32% |
| Capital Contribution | -392,206 | -533,581 | -141,375 | 2.68% |
| Additional Capital Contribution | -60,000 | -60,000 | 1.14% | |
| Total Requisition | -$ 5,268,635 | -$5,539,381 | -$ 270,745 | 5.14% |
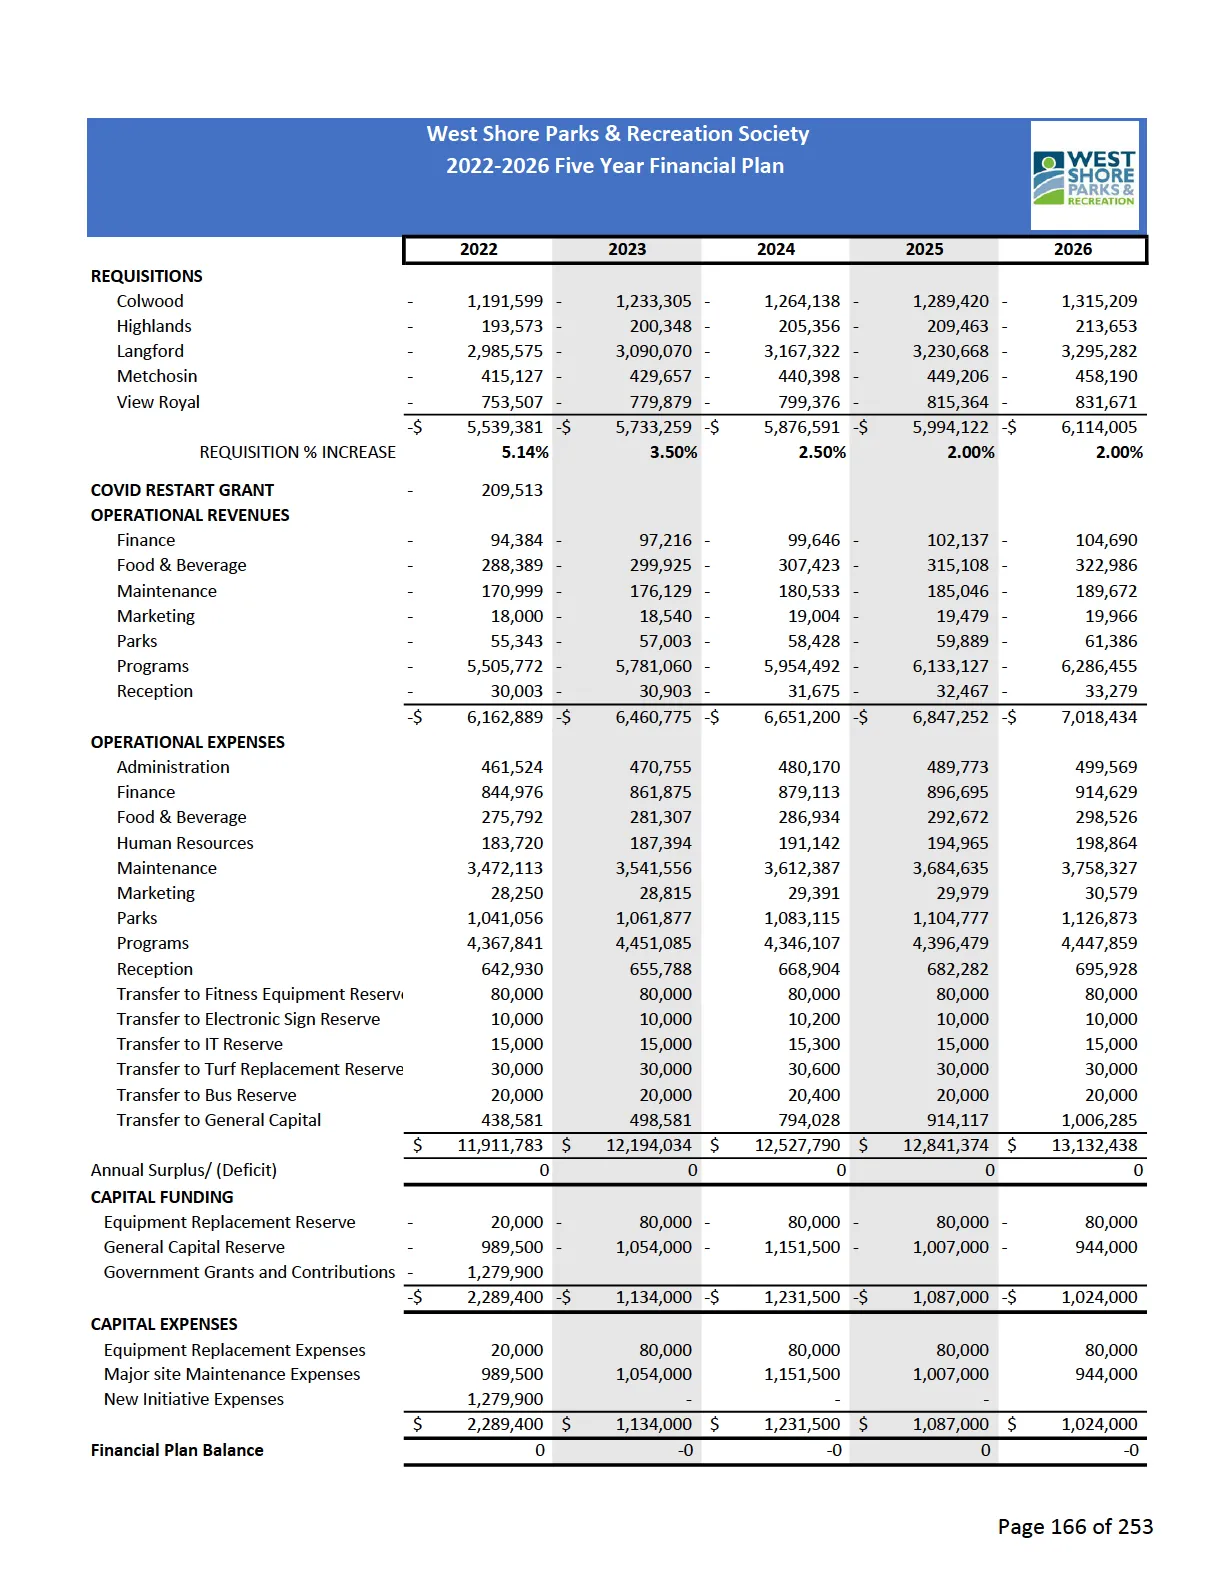
2022-2026 Five Year Financial Plan — Requisitions
| Year | Colwood | Highlands | Langford | Metchosin | View Royal | Total Requisition | REQUISITION % INCREASE |
|---|---|---|---|---|---|---|---|
| 2022 | 1,191,599 | 193,573 | 2,985,575 | 415,127 | 753,507 | $ 5,539,381 | 5.14% |
| 2023 | 1,233,305 | 200,348 | 3,090,070 | 429,657 | 779,879 | $ 5,733,225 | 3.50% |
| 2024 | 1,264,138 | 205,356 | 3,167,322 | 440,398 | 799,376 | $ 5,876,591 | 2.50% |
| 2025 | 1,289,420 | 209,463 | 3,230,668 | 449,206 | 815,364 | $ 5,994,122 | 2.00% |
| 2026 | 1,315,209 | 213,653 | 3,295,282 | 458,190 | 831,671 | $ 6,114,085 | 2.00% |
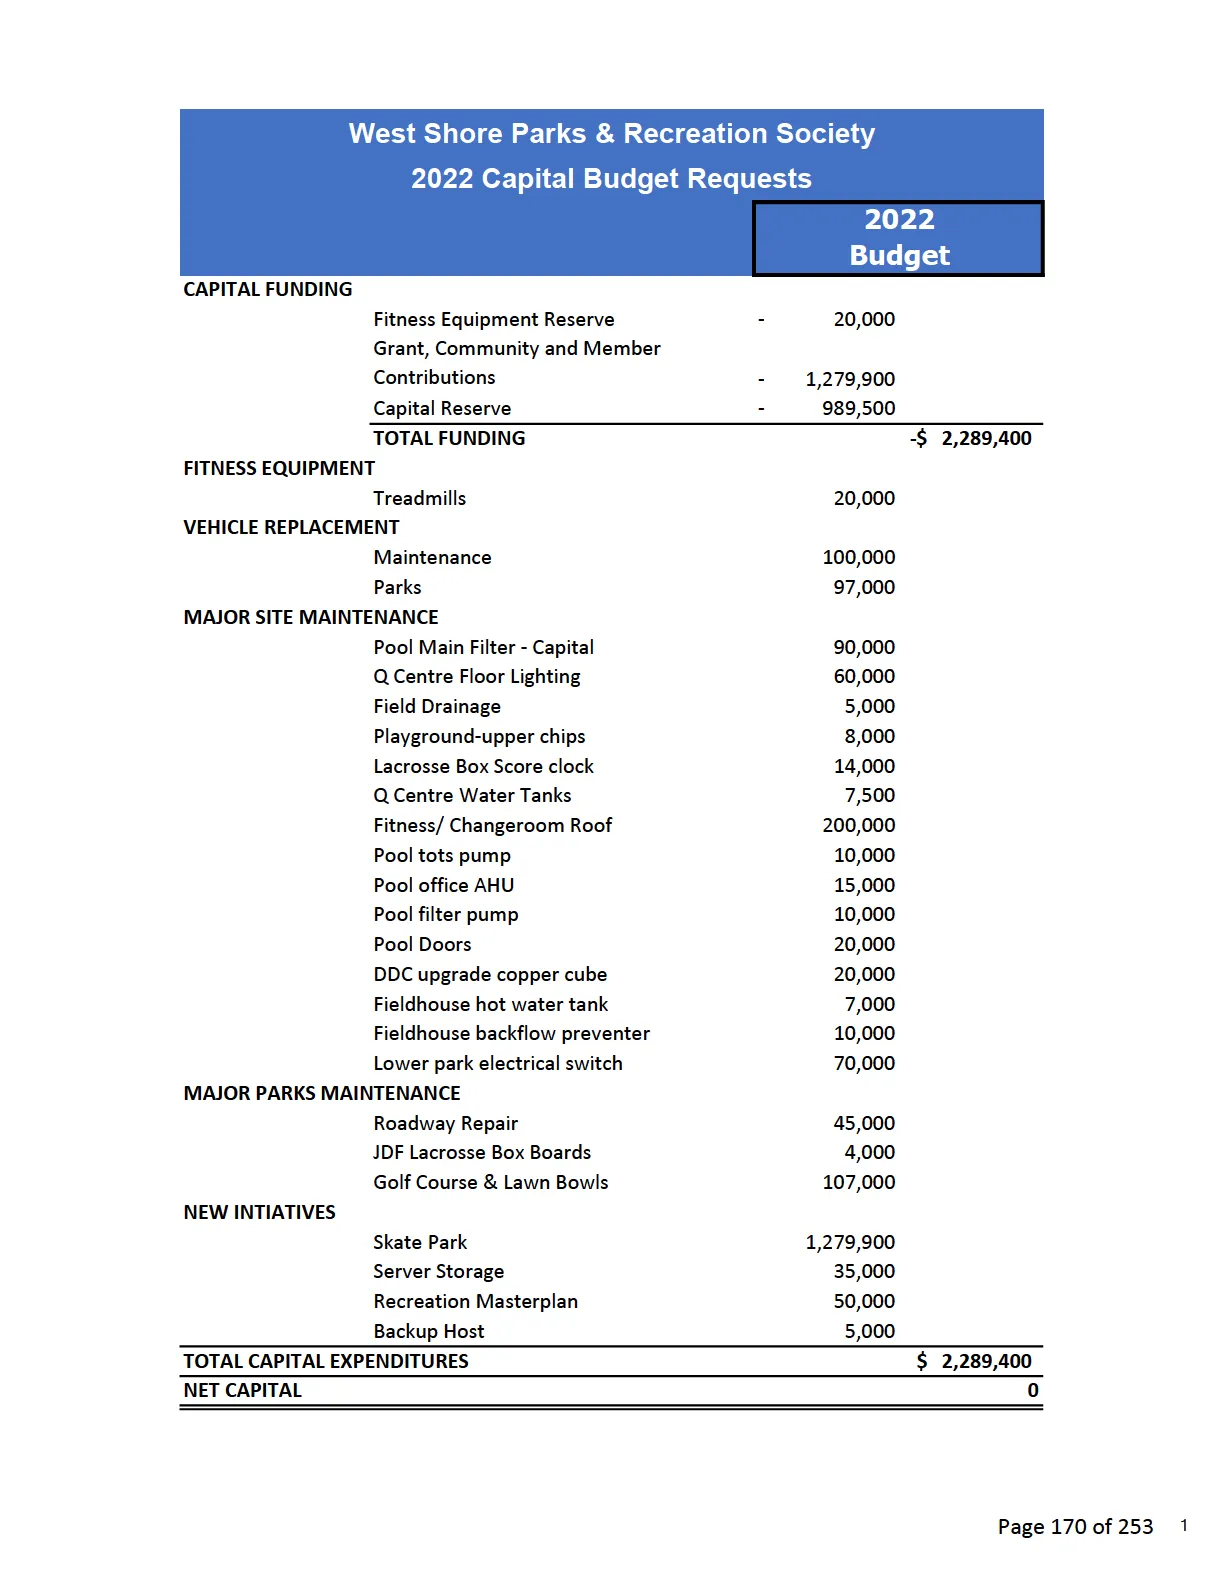
2022 Capital Budget Requests (summary)
| CAPITAL FUNDING | 2022 Budget |
|---|---|
| Fitness Equipment Reserve | 20,000 |
| Grant, Community and Member Contributions | 1,279,900 |
| Capital Reserve | 989,500 |
| TOTAL FUNDING | -$ 2,289,400 |
FITNESS EQUIPMENT
- Treadmills — 20,000
VEHICLE REPLACEMENT
- Maintenance — 100,000
- Parks — 97,000
MAJOR SITE MAINTENANCE
- Pool Main Filter - Capital — 90,000
- Q Centre Floor Lighting — 60,000
- Field Drainage — 5,000
- Playground-upper chips — 8,000
- Lacrosse Box Score clock — 14,000
- Q Centre Water Tanks — 7,500
- Fitness/ Changeroom Roof — 200,000
- Pool tots pump — 10,000
- Pool office AHU — 15,000
- Pool filter pump — 10,000
- Pool Doors — 20,000
- DDC upgrade copper cube — 20,000
- Fieldhouse hot water tank — 7,000
- Fieldhouse backflow preventer — 10,000
- Lower park electrical switch — 70,000
MAJOR PARKS MAINTENANCE
- Roadway Repair — 45,000
- JDF Lacrosse Box Boards — 4,000
- Golf Course & Lawn Bowls — 107,000
NEW INITIATIVES
- Skate Park — 1,279,900
- Server Storage — 35,000
- Recreation Masterplan — 50,000
- Backup Host — 5,000
TOTAL CAPITAL EXPENDITURES $ 2,289,400
NET CAPITAL 0
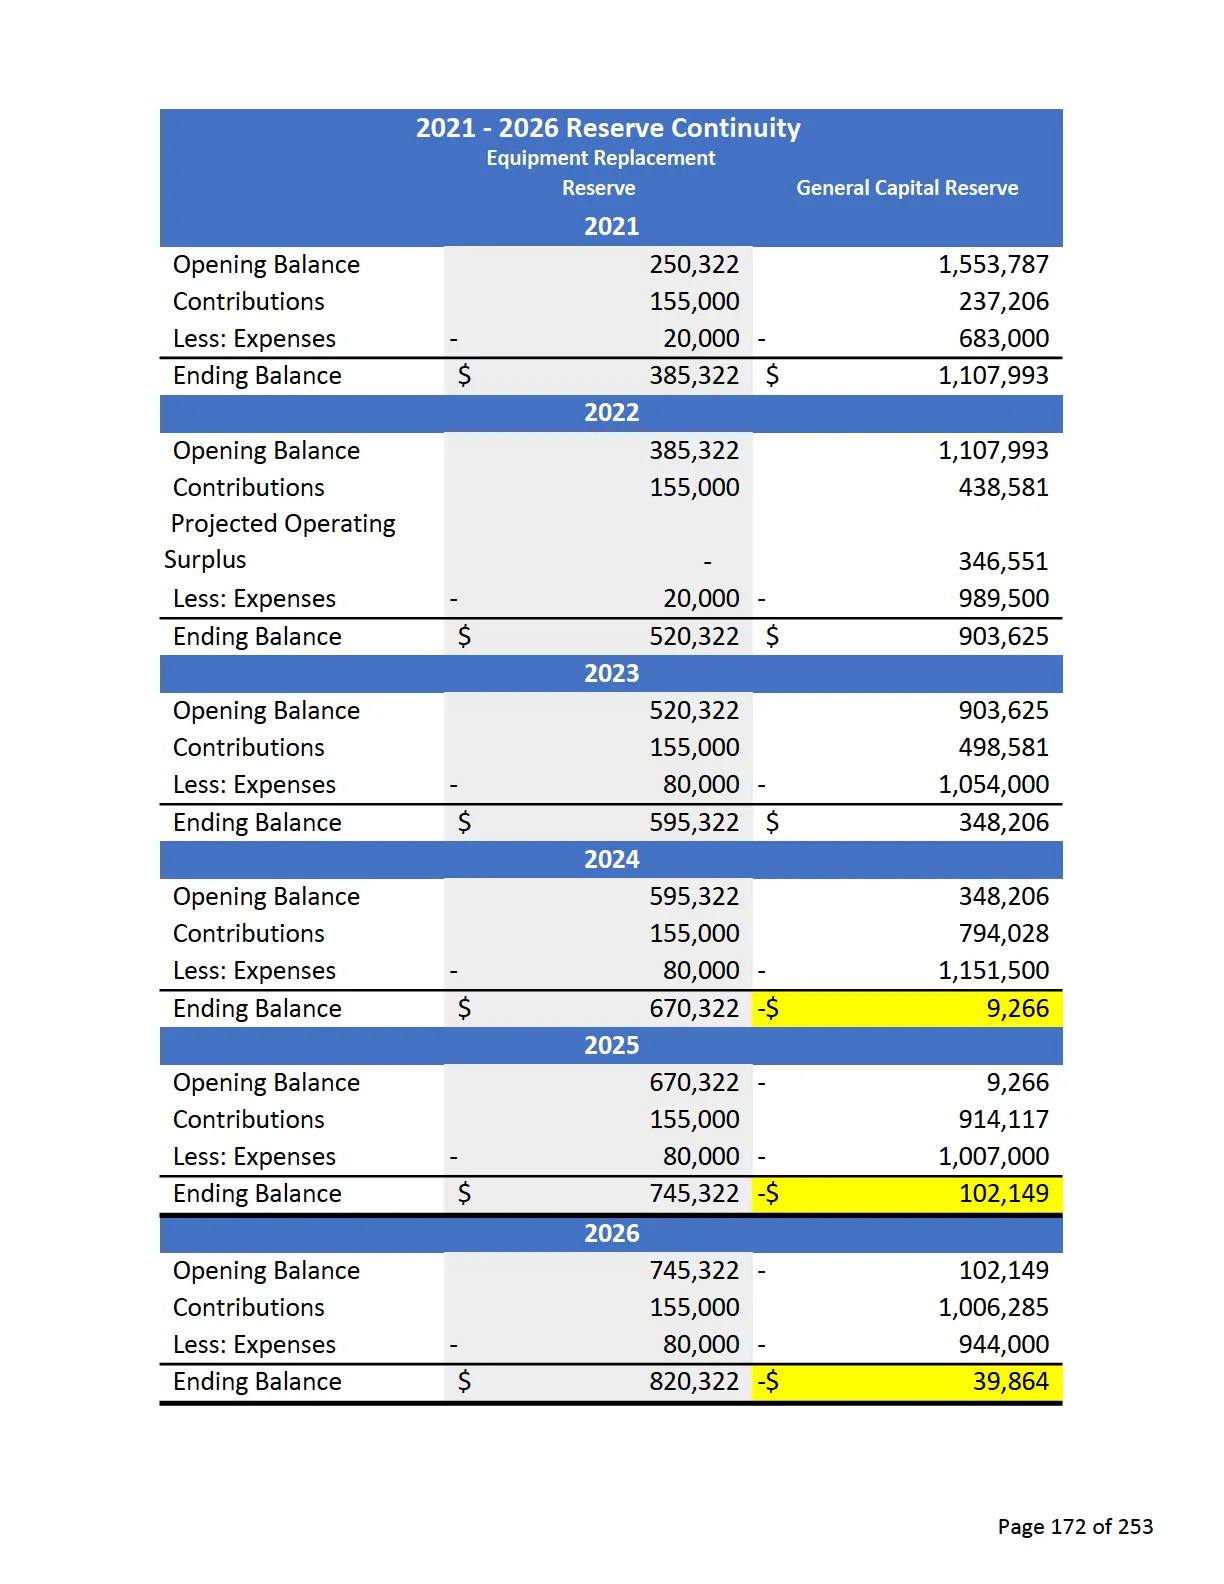
Reserve Continuity (2021 - 2026) — Equipment Replacement Reserve / General Capital Reserve
| Year | Equipment Replacement Reserve — Opening Balance | Contributions | Less: Expenses | Ending Balance | General Capital Reserve — Opening Balance | Contributions | Less: Expenses | Ending Balance |
|---|---|---|---|---|---|---|---|---|
| 2021 | 250,322 | 155,000 | -20,000 | $ 385,322 | 1,553,787 | 237,206 | -683,000 | $ 1,107,993 |
| 2022 | 385,322 | 155,000 | -20,000 | $ 520,322 | 1,107,993 | 438,581 | -989,500 | $ 903,625 |
| 2023 | 520,322 | 155,000 | -80,000 | $ 595,322 | 903,625 | 498,581 | -1,054,000 | $ 348,206 |
| 2024 | 595,322 | 155,000 | -80,000 | $ 670,322 | 348,206 | 794,028 | -1,151,500 | -$ 9,266 |
| 2025 | 670,322 | 155,000 | -80,000 | $ 745,322 | -$ 9,266 | 914,117 | -1,007,000 | -$ 102,149 |
| 2026 | 745,322 | 155,000 | -80,000 | $ 820,322 | -$ 102,149 | 1,006,285 | -944,000 | -$ 39,864 |
Requisition Request and Per Capital Cost
Converted Assessment Totals
Impact to Taxation
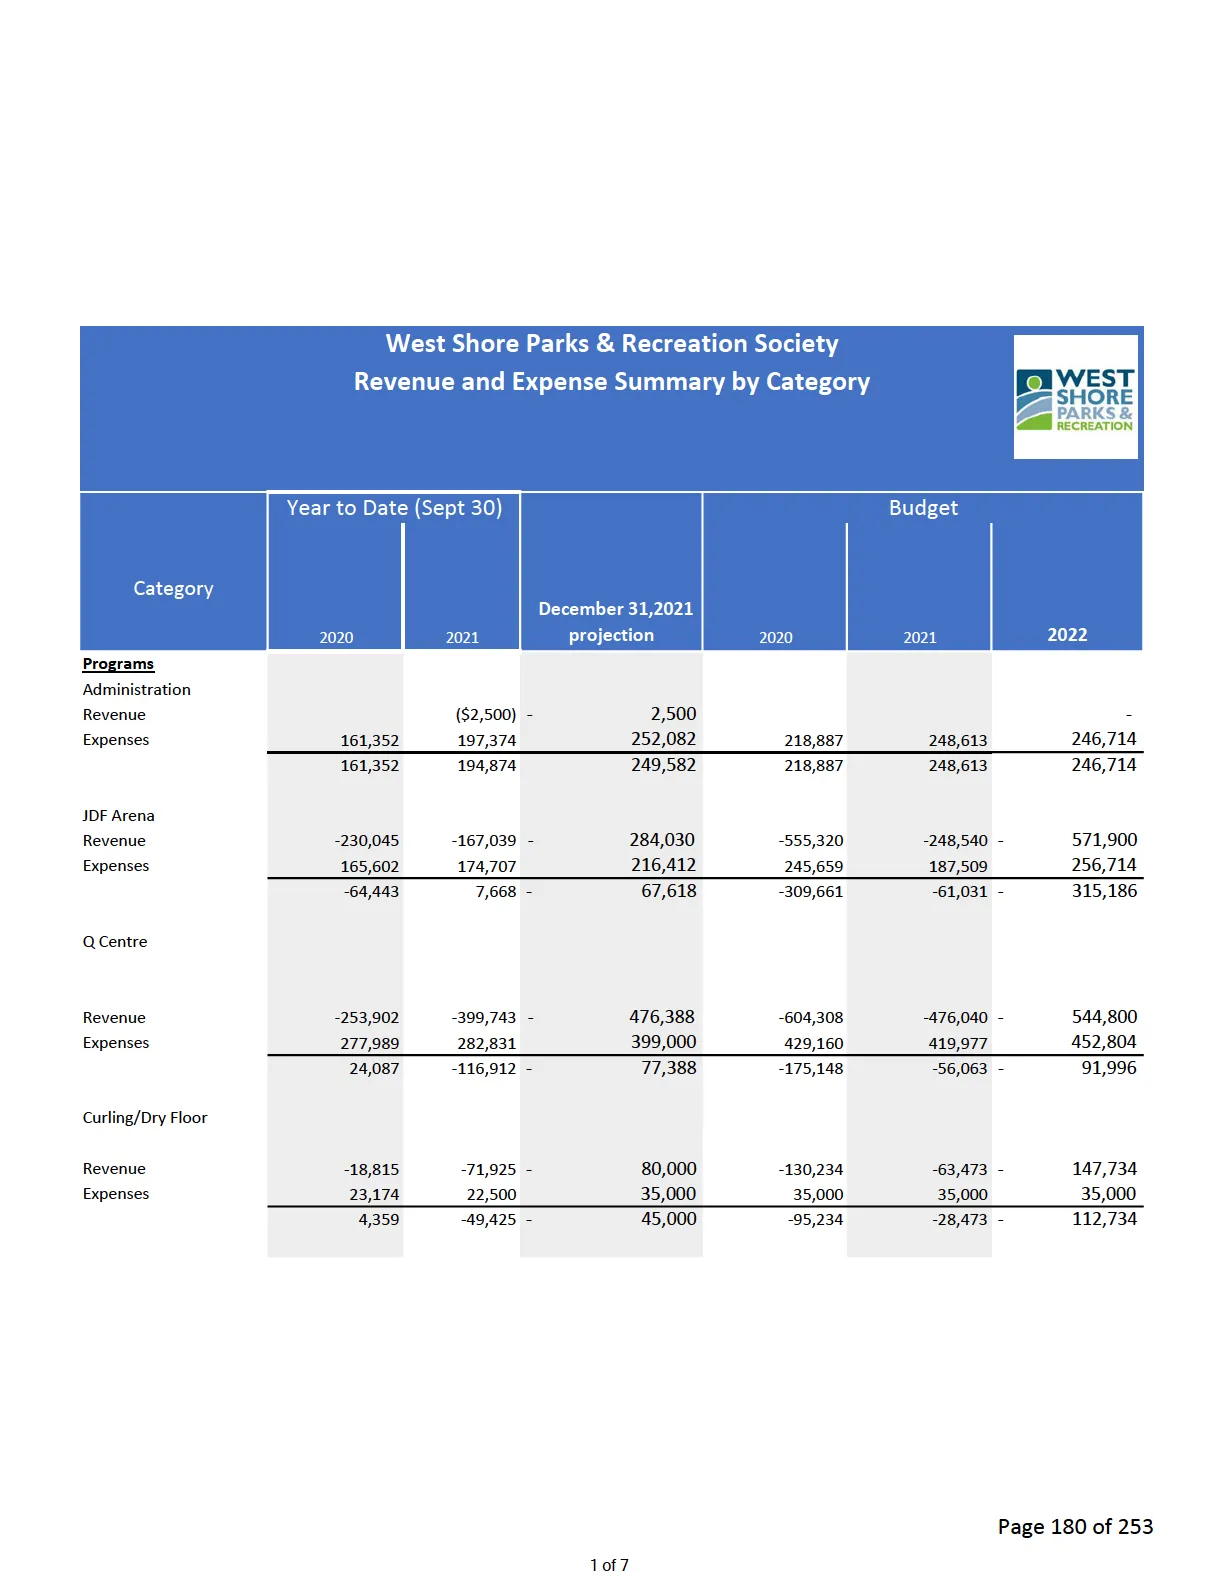
Operating Income and Summary
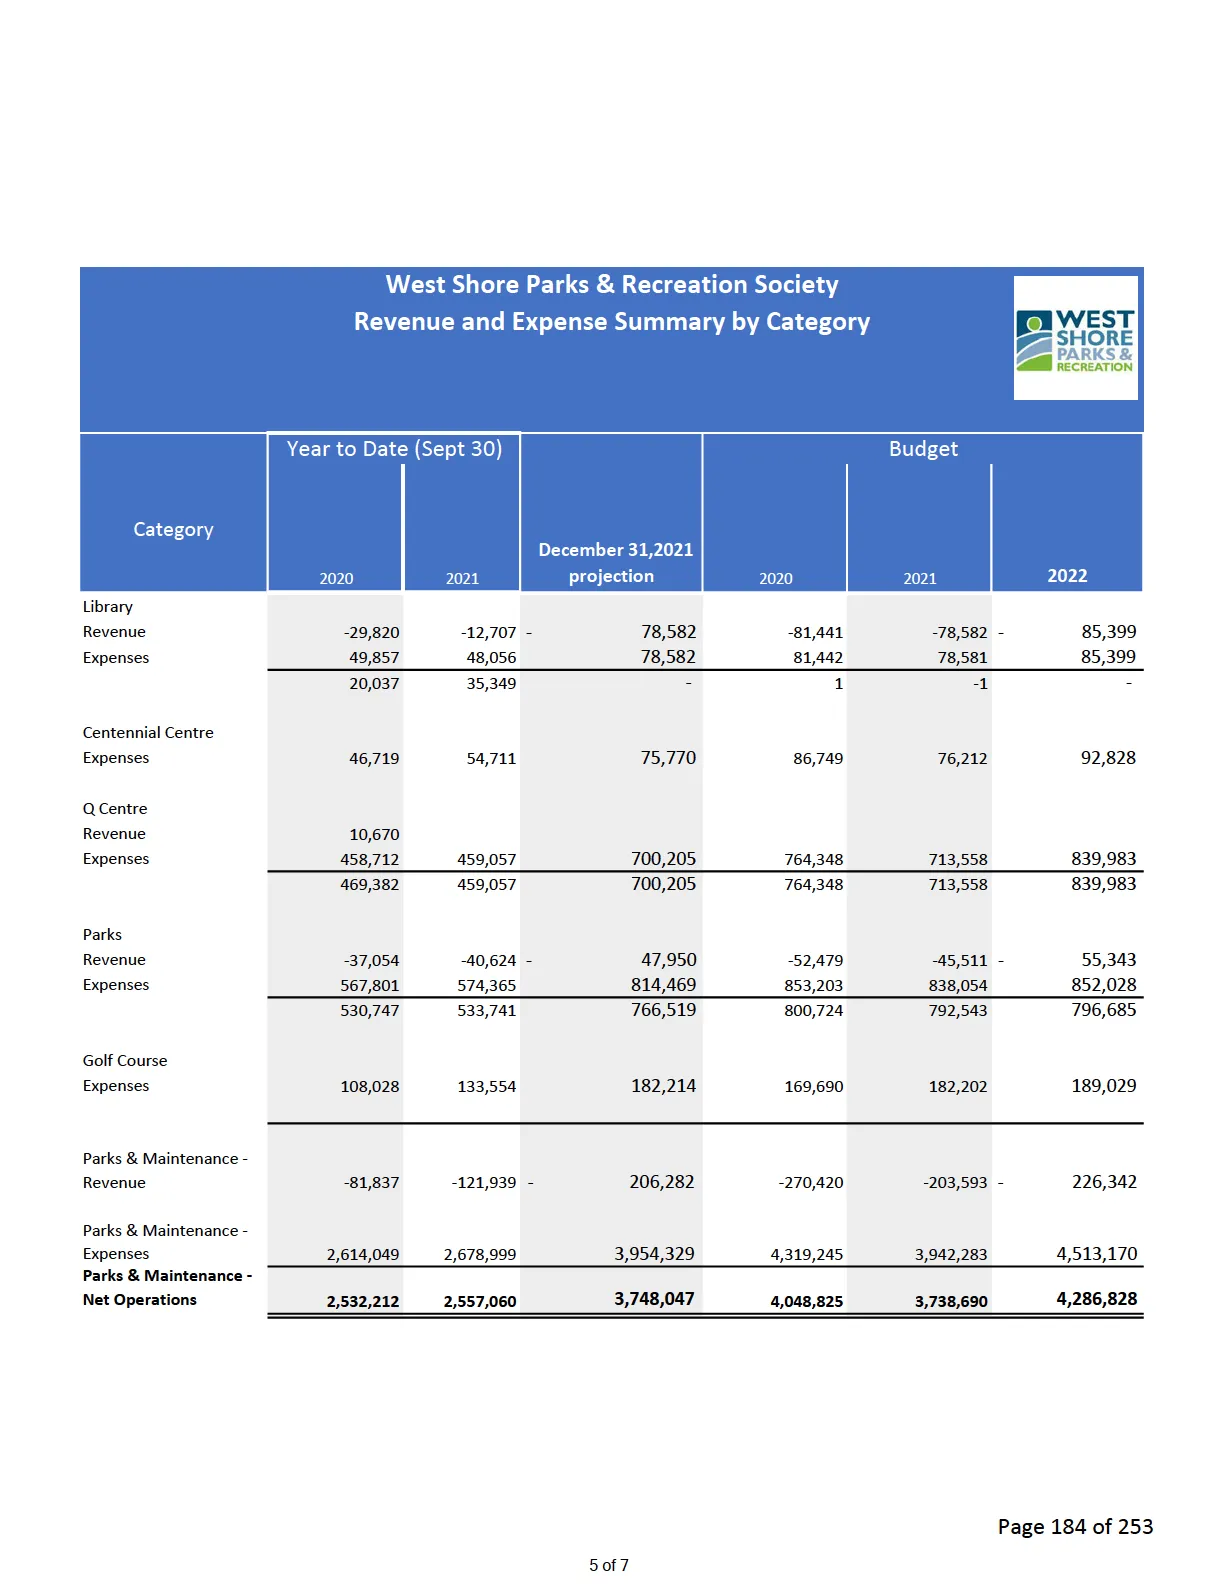
Revenue and Expense Summary by Category (selected lines)
(Seven page Revenue and Expense Summary pages included showing Year to Date (Sept 30), December 31, 2021 projection and budgets for 2020, 2021, 2022 by category. Extracted rows below are representative of the summary tables shown.)
Programs (selected categories)
| Category | 2020 | 2021 | Dec 31, 2021 projection | 2020 Budget | 2021 Budget | 2022 Budget |
|---|---|---|---|---|---|---|
| Administration — Revenue | 161,352 | 197,374 | 252,082 | 218,887 | 248,613 | 246,714 |
| JDF Arena — Revenue | -230,045 | -167,039 | 284,030 | -555,320 | -248,540 | 571,900 |
| Q Centre — Revenue | -253,902 | -399,743 | 476,388 | -604,308 | -476,040 | 544,800 |
| Curling/Dry Floor — Revenue | -18,815 | -71,925 | 80,000 | -130,234 | -63,473 | 147,734 |
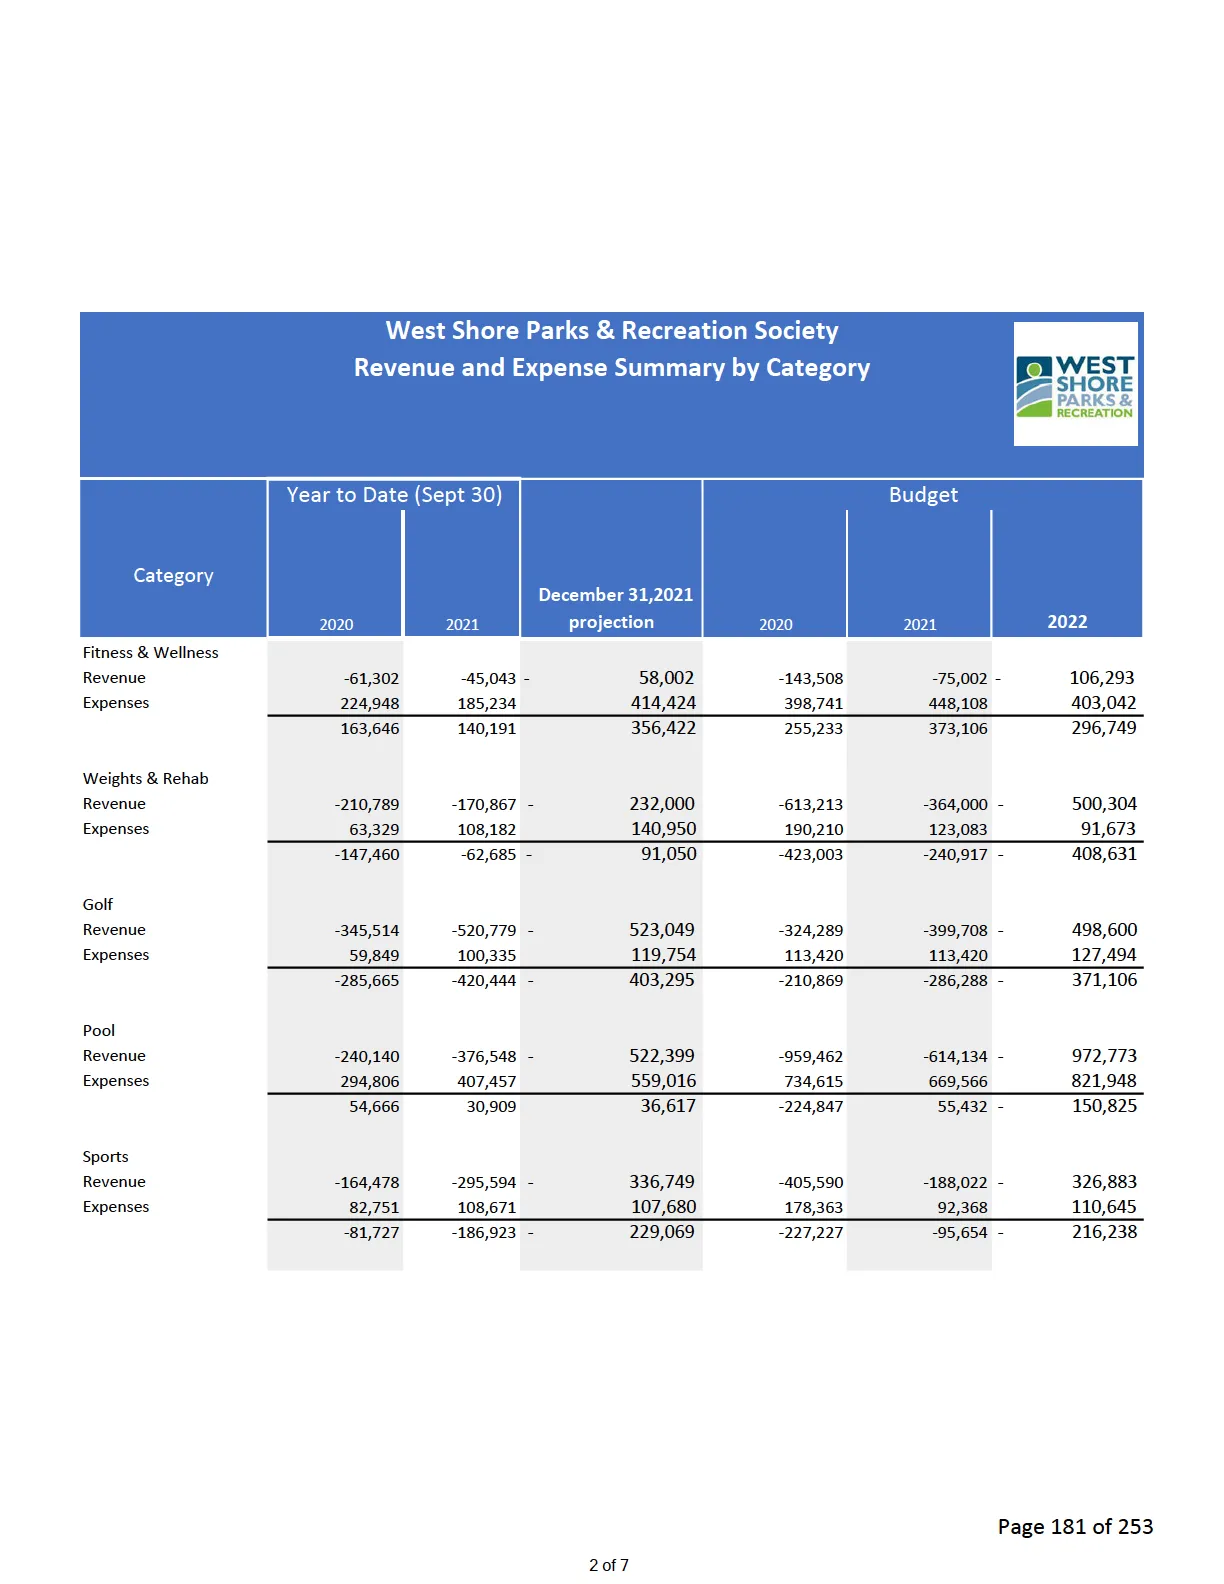
Fitness & Wellness / Weights & Rehab / Golf / Pool / Sports (selected)
| Category | 2020 | 2021 | Dec 31, 2021 projection | 2020 Budget | 2021 Budget | 2022 Budget |
|---|---|---|---|---|---|---|
| Fitness & Wellness — Revenue | -61,302 | -45,043 | 58,002 | -143,508 | -75,002 | 106,293 |
| Weights & Rehab — Revenue | -210,789 | -170,867 | 232,000 | -613,213 | -364,000 | 500,304 |
| Golf — Revenue | -345,514 | -520,779 | 523,049 | -324,289 | -399,708 | 498,600 |
| Pool — Revenue | -240,140 | -376,548 | 522,399 | -959,462 | -614,134 | 972,773 |
| Sports — Revenue | -164,478 | -295,594 | 336,749 | -405,590 | -188,022 | 326,883 |
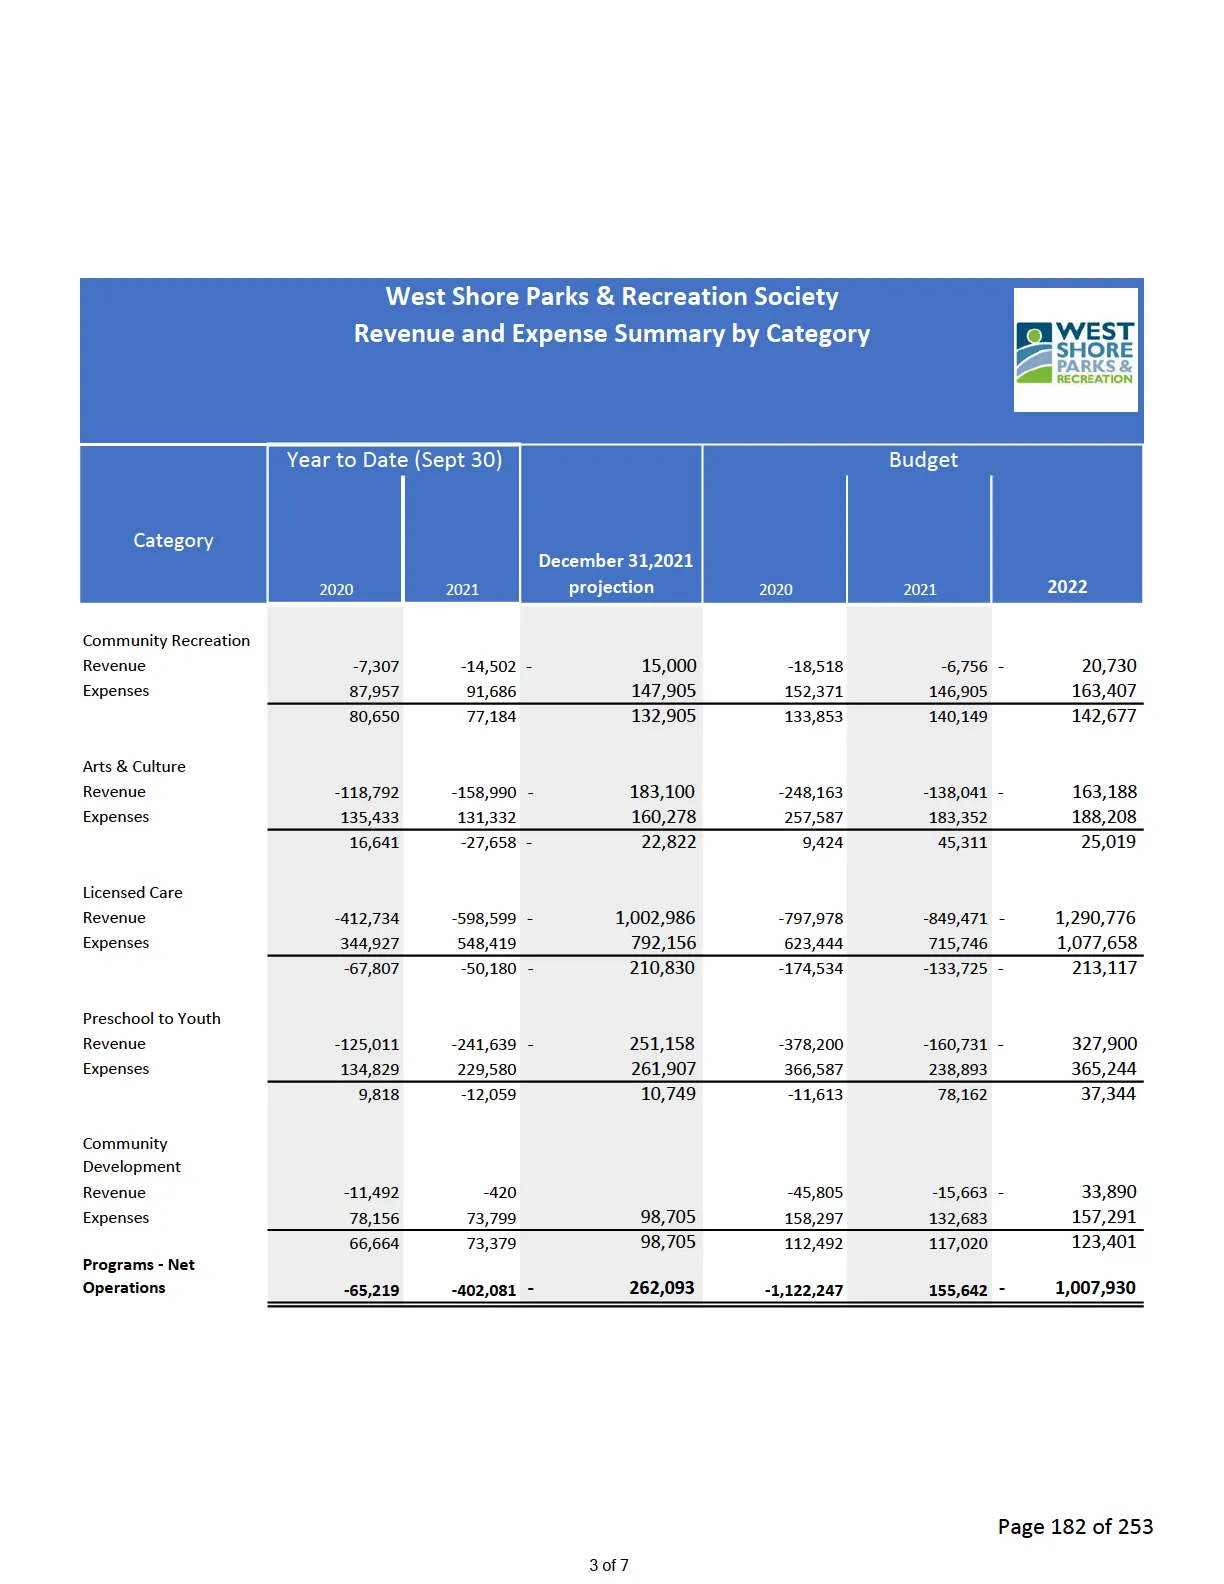
Community Recreation / Arts & Culture / Licensed Care / Preschool to Youth / Community Development
| Category | 2020 | 2021 | Dec 31, 2021 projection | 2020 Budget | 2021 Budget | 2022 Budget |
|---|---|---|---|---|---|---|
| Community Recreation — Revenue | -7,307 | -14,502 | 15,000 | -18,518 | -6,756 | 20,730 |
| Arts & Culture — Revenue | -118,792 | -158,990 | 183,100 | -248,163 | -138,041 | 163,188 |
| Licensed Care — Revenue | -412,734 | -598,599 | 1,002,986 | -797,978 | -849,471 | 1,290,776 |
| Preschool to Youth — Revenue | -125,011 | -241,639 | 251,158 | -378,200 | -160,731 | 327,900 |
| Community Development — Revenue | -11,492 | -420 | -45,805 | -15,663 | 33,890 |
(End of 3 of 7 pages summary)
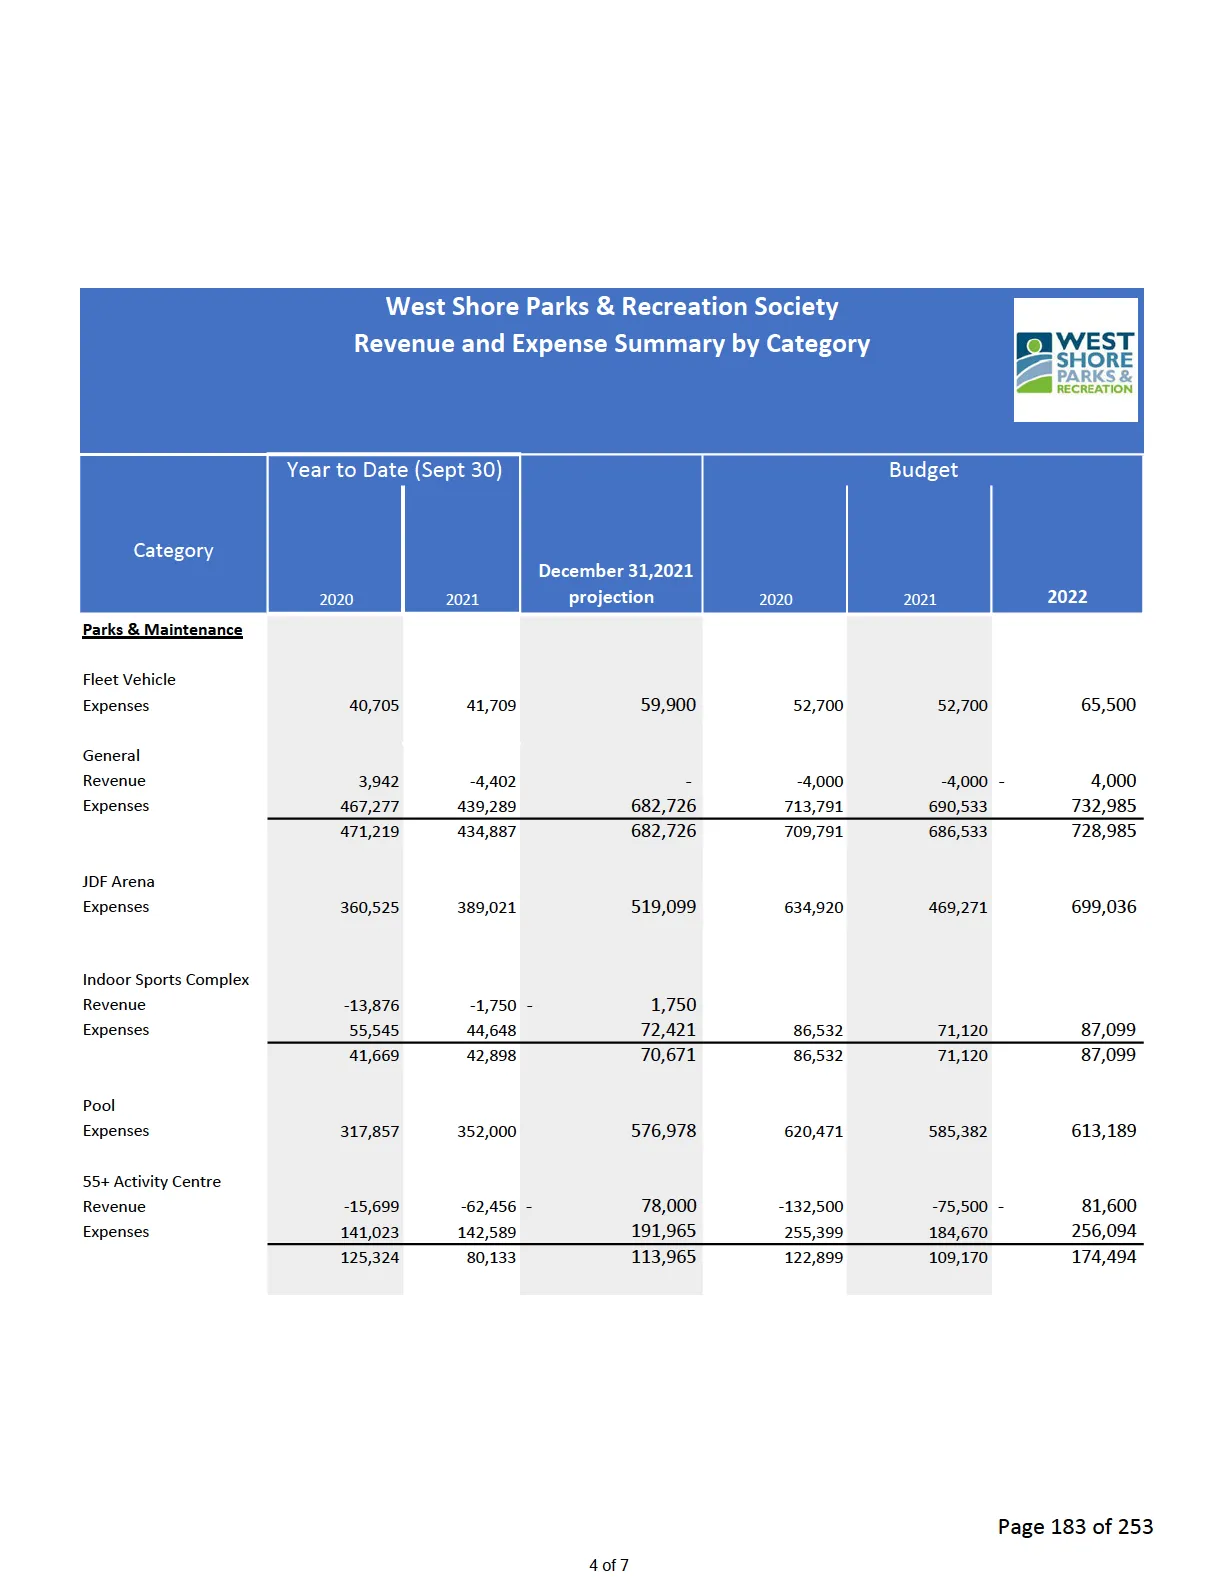
Parks & Maintenance / JDF Arena / Indoor Sports Complex / Pool / 55+ Activity Centre (selected)
| Category | 2020 | 2021 | Dec 31, 2021 projection | 2020 Budget | 2021 Budget | 2022 Budget |
|---|---|---|---|---|---|---|
| Fleet Vehicle Expenses | 40,705 | 41,709 | 59,900 | 52,700 | 52,700 | 65,500 |
| JDF Arena — Expenses | 360,525 | 389,021 | 519,099 | 634,920 | 469,271 | 699,036 |
| Indoor Sports Complex — Revenue | -13,876 | -1,750 | 1,750 | 86,532 | 71,120 | 87,099 |
| Pool — Expenses | 317,857 | 352,000 | 576,978 | 620,471 | 585,382 | 613,189 |
| 55+ Activity Centre — Revenue | -15,699 | -62,456 | 78,000 | -132,500 | -75,500 | 81,600 |
(End of 5 of 7 pages summary)
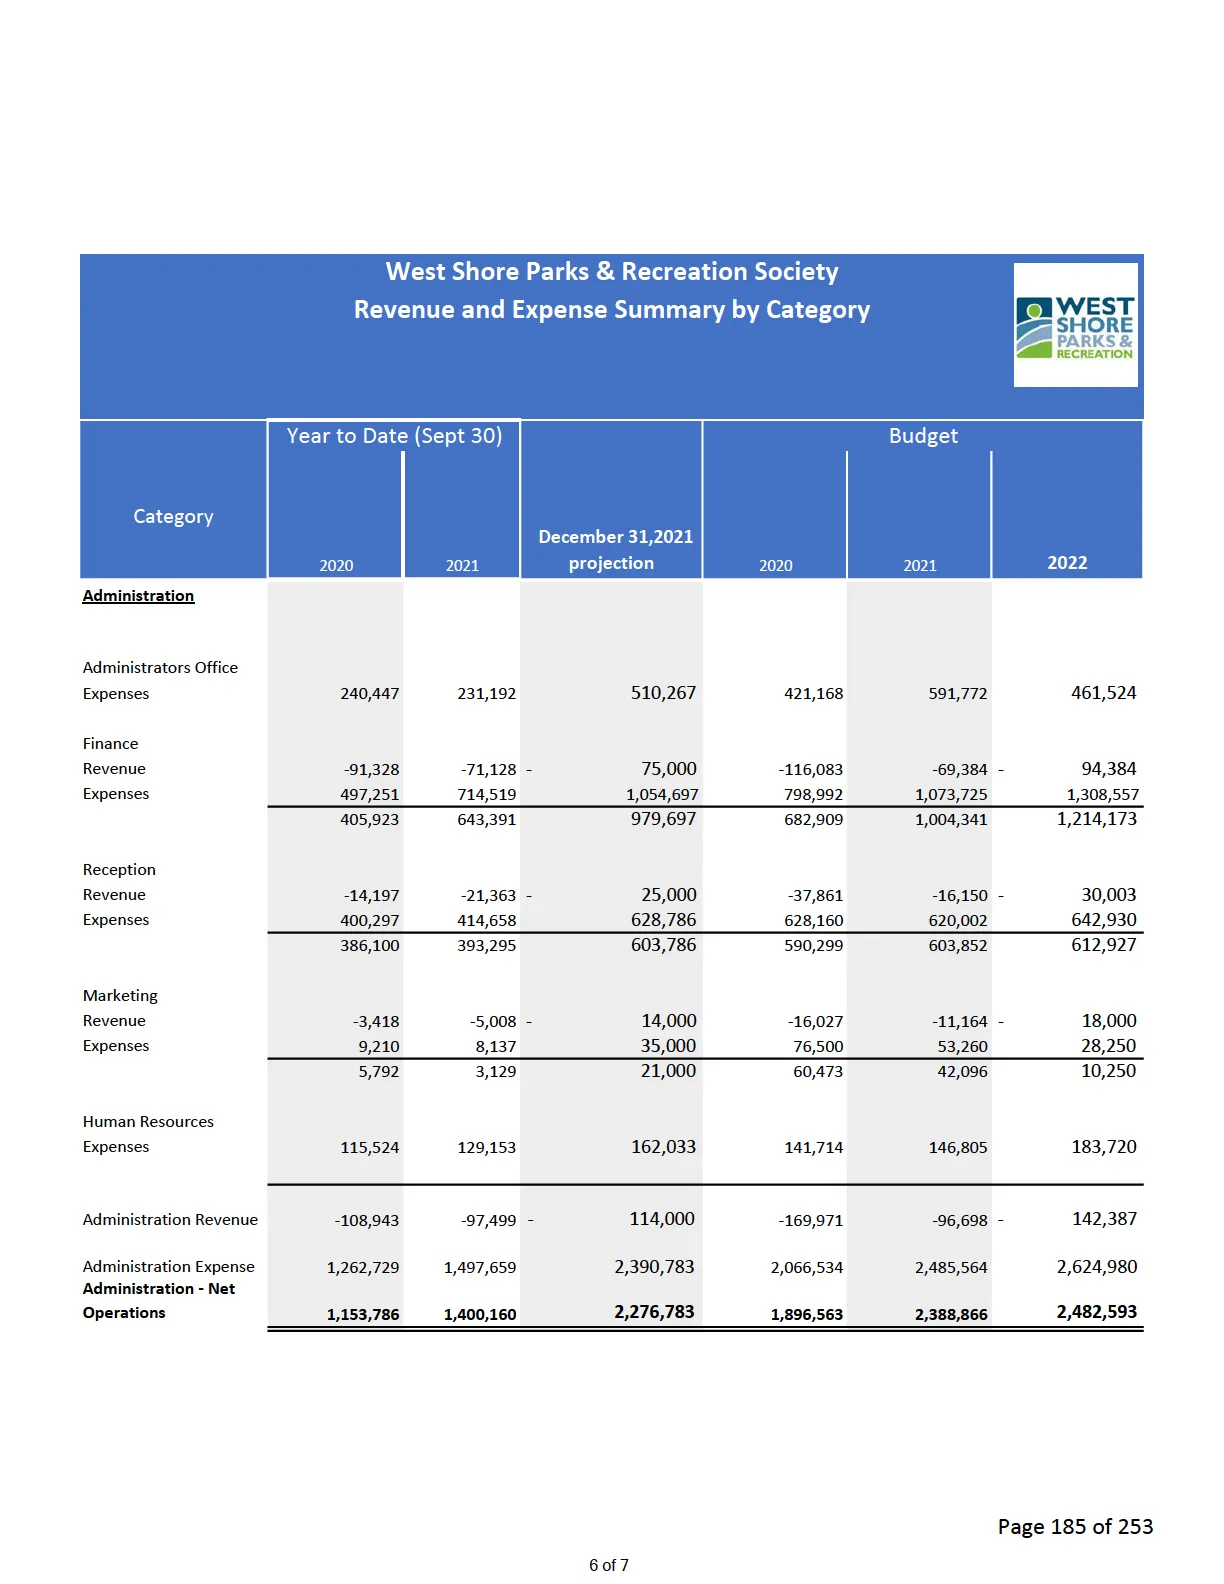
Administration / Finance / Reception / Marketing / Human Resources (selected)
| Category | 2020 | 2021 | Dec 31, 2021 projection | 2020 Budget | 2021 Budget | 2022 Budget |
|---|---|---|---|---|---|---|
| Administrators Office — Expenses | 240,447 | 231,192 | 510,267 | 421,168 | 591,772 | 461,524 |
| Finance — Revenue | -91,328 | -71,128 | 75,000 | -116,083 | -69,384 | 94,384 |
| Reception — Revenue | -14,197 | -21,363 | 25,000 | -37,861 | -16,150 | 30,003 |
| Marketing — Revenue | -3,418 | -5,008 | 14,000 | -16,027 | -11,164 | 18,000 |
| Human Resources — Expenses | 115,524 | 129,153 | 162,033 | 141,714 | 146,805 | 183,720 |
(End of 6 of 7 pages summary)
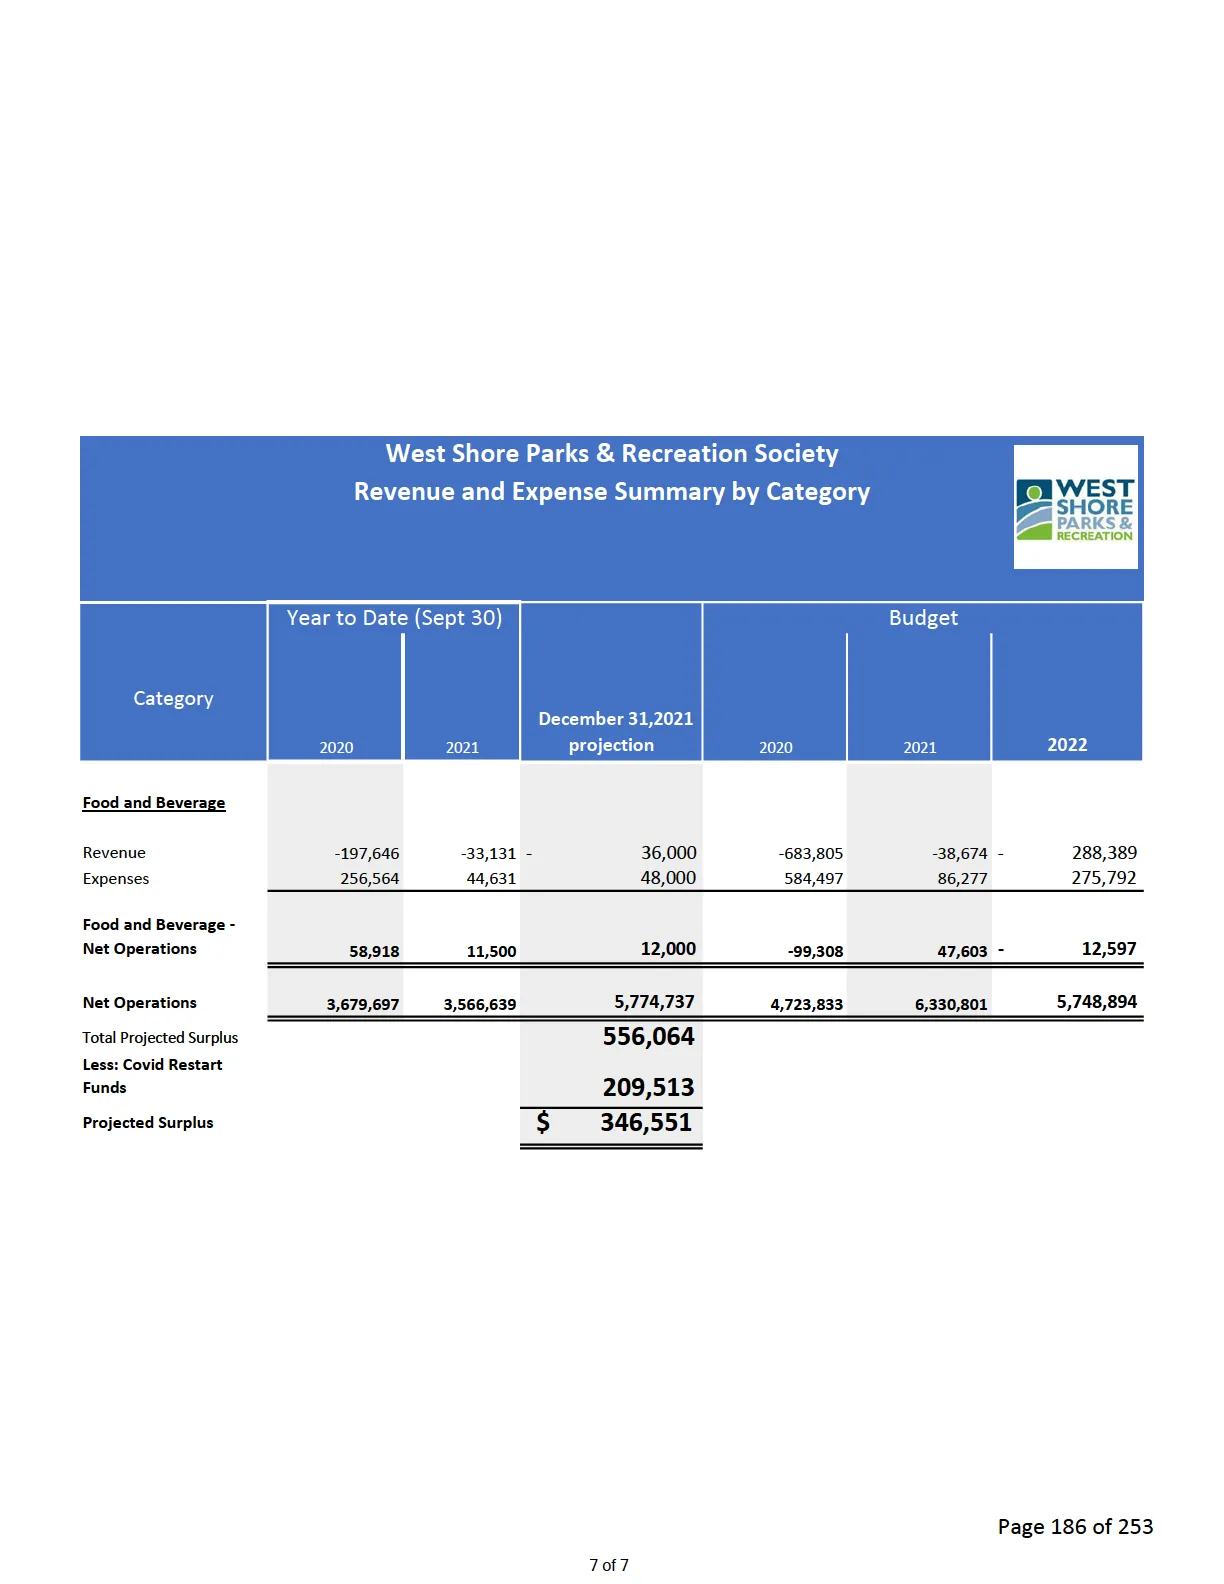
Food and Beverage (selected)
| Category | 2020 | 2021 | Dec 31, 2021 projection | 2020 Budget | 2021 Budget | 2022 Budget |
|---|---|---|---|---|---|---|
| Food and Beverage — Revenue | -197,646 | -33,131 | 36,000 | -683,805 | -38,674 | 288,389 |
| Food and Beverage — Expenses | 256,564 | 44,631 | 48,000 | 584,497 | 86,277 | 275,792 |
Total Projected Surplus 556,064
Less: Covid Restart Funds 209,513
Projected Surplus $ 346,551
(End of 7 of 7 pages summary)
Fees and Charges 2022-2023
Fees Effective: September 1, 2022 to August 31, 2023
(Single drop-in admissions include applicable taxes. All passes have applicable taxes added at the time of purchase)
ADMISSION FEES (swim, skate, weight room, fitness classes)
| Category (Age) | 2022 | % Increase | 2021 | 2020 | 2019 | 2018 | 2017 | 2016 |
|---|---|---|---|---|---|---|---|---|
| Adult Single Admission - incl tax (19 - 59) | $ 6.95 | 1.53% | $ 6.85 | $ 6.80 | $ 6.75 | $ 6.65 | $ 6.50 | $ 6.40 |
| 10x | $ 59.58 | 1.53% | $ 58.68 | $ 58.28 | $ 57.87 | $ 56.97 | $ 55.70 | $ 54.90 |
| 25x | $ 132.40 | 1.53% | $ 130.40 | $ 129.50 | $ 128.60 | $ 126.60 | $ 123.80 | $ 122.00 |
| 1 month | $ 68.19 | 1.77% | $ 67.00 | $ 63.00 | $ 62.00 | $ 60.00 | $ 60.00 | $ 56.00 |
| 3 month | $ 156.83 | 1.84% | $ 154.00 | $ 146.00 | $ 144.00 | $ 140.00 | $ 140.00 | $ 140.00 |
| 12 month | $ 430.00 | 1.18% | $ 425.00 | $ 405.00 | $ 395.00 | $ 385.00 | $ 385.00 | $ 385.00 |
| Senior Single Admission - incl tax (60 plus) | $ 5.25 | 2.04% | $ 5.15 | $ 5.00 | $ 4.90 | $ 4.75 | $ 4.65 | $ 4.60 |
| 10x Senior | $ 45.00 | 2.04% | $ 44.10 | $ 42.84 | $ 42.03 | $ 40.68 | $ 39.90 | $ 39.40 |
| 25x Senior | $ 100.00 | 2.04% | $ 98.00 | $ 95.20 | $ 93.40 | $ 90.40 | $ 88.60 | $ 87.50 |
| Youth Single Admission - incl tax (13 - 18) | $ 4.75 | 0.00% | $ 4.75 | $ 4.75 | $ 4.75 | $ 4.75 | $ 4.65 | $ 4.60 |
| Youth 10x | $ 40.68 | -4.76% | $ 42.71 | $ 42.71 | $ 40.68 | $ 40.68 | $ 39.90 | $ 39.40 |
| Child Single Admission - incl tax (6 - 12) | $ 3.65 | 2.96% | $ 3.55 | $ 3.50 | $ 3.30 | $ 3.25 | $ 3.20 | $ 3.15 |
| Child 10x | $ 31.32 | 2.96% | $ 30.42 | $ 29.97 | $ 28.26 | $ 27.86 | $ 27.45 | $ 27.00 |
| Family Single Admission - incl tax (Max. 5) | $ 13.90 | 1.53% | $ 13.69 | $ 13.60 | $ 13.50 | $ 13.25 | $ 13.00 | $ 12.80 |
| Family 10x | $ 119.16 | 1.53% | $ 117.36 | $ 116.55 | $ 115.74 | $ 113.58 | $ 111.40 | $ 109.70 |
| Family 3 month | $ 313.66 | 7.42% | $ 292.00 | $ 292.00 | $ 288.00 | $ 280.00 | $ 280.00 | $ 425.00 |
| Family 12 month | $ 860.00 | 1.18% | $ 850.00 | $ 810.00 | $ 790.00 | $ 770.00 | $ 770.00 | $ 770.00 |
| Child Minding per 75 min | $ - | 0.00% | $ 3.75 | $ 3.50 | $ 3.50 | $ 3.50 | $ 3.50 | |
| Child Minding 10x | $ - | 0.00% | $ 32.14 | $ 30.00 | $ 30.00 | $ 30.00 | $ 30.00 | |
| Child Minding 25x | $ - | -100.00% | $ 71.43 |
INDOOR FACILITIES RENTAL FEES
Fees Effective: September 1, 2022 to August 31, 2023
(All Fees Subject to Applicable Taxes)
Rooms (per hour unless noted) (In alignment with SD62 fees where noted)
Small Rooms include: Boardroom, Upper and Lower Clubhouse, JDF Seniors Centre
Rooms 201-202 and Centennial Centre for Arts and Culture Rooms
Large Rooms include: Kinsmen Fieldhouse, Langford and Highlands Rooms, 55+ Centre Auditorium & Room 101
Wedding Rooms Include: Kinsmen Fieldhouse and 55+ Centre Auditorium
| Room / Rental Type | 2022 | % Increase | 2021 | 2020 | 2019 | 2018 | 2017 | 2016 |
|---|---|---|---|---|---|---|---|---|
| Adult (In alignment with SD62) | $ 35.00 | 11.11% | $ 31.50 | $ 28.50 | $ 28.00 | $ 27.00 | $ 26.50 | $ 26.00 |
| Youth (In alignment with SD62) | $ 20.00 | 11.11% | $ 18.00 | $ 16.25 | $ 16.00 | $ 15.75 | $ 15.50 | $ 14.50 |
| Commercial/Party Room Rental (Charge per/hr with a 2hr min rental) | $ 46.50 | 11.38% | $ 41.75 | $ 37.75 | $ 37.00 | $ 36.00 | $ 35.00 | $ 34.00 |
| Adult / Community | $ 16.00 | 3.23% | $ 15.50 | $ 14.00 | $ 13.75 | $ 13.25 | $ 13.00 | $ 12.50 |
| Youth / Community | $ 12.00 | 2.13% | $ 11.75 | $ 10.75 | $ 10.50 | $ 10.25 | $ 10.00 | $ 9.40 |
| Adult / Meetings or User Group (In alignment with SD62) | $ 48.00 | 11.63% | $ 43.00 | $ 43.00 | $ 42.00 | $ 40.50 | $ 39.50 | $ 39.00 |
| Youth / Meetings or User Group (In alignment with SD62) | $ 32.25 | 11.21% | $ 29.00 | $ 29.00 | $ 28.50 | $ 27.75 | $ 27.00 | $ 26.00 |
| Commercial Rental (Charge per/hr with 2hr minimum) | $ 59.50 | 11.21% | $ 53.50 | $ 53.50 | $ 52.00 | $ 50.00 | $ 49.00 | $ 48.00 |
| Wedding Reception - Full Day Rental | $ 475.00 | 0.00% | $ 475.00 | $ 450.00 | $ 440.00 | $ 430.00 | $ 430.00 | $ 430.00 |
| Wedding Ceremony - Outdoor | $ 340.00 | 0.00% | $ 340.00 | $ 340.00 | $ 330.00 | $ 325.00 | $ 325.00 | $ 325.00 |
| Wedding Ceremony - Indoor | $ 235.00 | 0.00% | $ 235.00 | $ 235.00 | $ 230.00 | $ 220.00 | $ 220.00 | $ 220.00 |
| Wedding Reception - additonal set-up from 5pm night before | $ 125.00 | 0.00% | $ 125.00 | $ 110.00 | $ 105.00 | $ 100.00 | $ 100.00 | $ 100.00 |
| Commercial - Per Lane | $ 34.00 | 3.03% | $ 33.00 | $ 32.50 | $ 32.32 | $ 26.90 | $ 26.25 | $ 25.63 |
| Adult - Per Lane | $ 30.00 | 0.00% | $ 30.00 | $ 30.00 | $ 28.94 | $ 26.90 | $ 26.25 | $ 25.63 |
| Youth - Per Lane | $ 18.50 | 2.78% | $ 18.00 | $ 17.50 | $ 17.16 | $ 12.80 | $ 12.50 | $ 12.30 |
| Group Booking Fee | $ 60.00 | 9.09% | $ 55.00 | $ 50.00 | $ 45.00 | |||
| Lifeguard/Instructor Fee (additional staff) | $ 31.00 | 3.33% | $ 30.00 | $ 28.00 | $ 27.00 |
JDF Indoor Sports Turf / Indoor Sports Floor (selected)
| Item | 2022 | % Increase | 2021 |
|---|---|---|---|
| Turf Prime Time 4pm-10pm Mon - Fri, 9am-10pm Sat - Sun | $ 77.00 | 2.67% | $ 75.00 |
| Turf Commercial Prime 4pm-10pm Mon - Fri, 9am-10pm Sat - Sun | $ 98.00 | 3.16% | $ 95.00 |
| Turf Non-Prime | $ 50.00 | 0.00% | $ 50.00 |
| Half Sport Floor Prime Time | $ 46.00 | 2.22% | $ 45.00 |
| Half Sports Floor Commercial Prime | $ 72.00 | 2.86% | $ 70.00 |
| Indoor Sports Complex Full Day (24 hrs) - Community Group | $ 1,100.00 | 0.00% | $ 1,100.00 |
| Indoor Sports Complex Full Day (24 hrs) - Commercial | $ 2,000.00 | 0.00% | $ 2,000.00 |
ARENA FACILITIES RENTAL FEES
Fees Effective: September 1, 2022 to August 31, 2023
(All Fees Subject to Applicable Taxes Unless Noted)
| Item | 2022 | % Increase | 2021 |
|---|---|---|---|
| Ice - Adult Prime Time* | $ 242.00 | 2.98% | $ 235.00 |
| Ice - Adult Non-Prime** | $ 161.00 | 2.22% | $ 157.50 |
| Ice - Midnight Rate (midnight to 6 am) | $ 109.00 | 1.87% | $ 107.00 |
| Ice - Youth Prime Time* | $ 137.00 | 3.79% | $ 132.00 |
| Ice - Youth Non-Prime** | $ 111.00 | 2.78% | $ 108.00 |
| Ice - School District #62 Hockey Academy | $ 111.00 | 2.78% | $ 108.00 |
| Ice - Commercial Prime Time | $ 255.00 | 4.08% | $ 245.00 |
| Skate Rentals (tax incl) | $ 3.60 | 0.00% | $ 3.60 |
| 1-50 Participants (Skate Rental for groups) | $ 83.75 | 2.13% | $ 82.00 |
| 51-100 Participants | $ 125.50 | 2.03% | $ 123.00 |
| Skate Rentals for School Groups (tax incl) | $ 1.75 | 9.65% | $ 1.60 |
| Arena Dry Floor - Adult | $ 87.00 | 2.35% | $ 85.00 |
| Arena Dry Floor - Youth | $ 59.00 | 3.51% | $ 57.00 |
| JdF Arena Full Day (24 hrs) - Community Group | $ 1,200.00 | 9.09% | $ 1,100.00 |
| JdF Arena Full Day (24 hrs) - Commercial | $ 2,200.00 | 10.00% | $ 2,000.00 |
*Prime: M-F 6:00 am - 8:00 am, 4:00 pm-11:30 pm / Sat & Sun 6:00 am - 11:30 pm
**Non-Prime: M-F 8:00 am - 4:00 pm & 11:30 pm - Midnight/ Sat & Sun 11:30 pm - Midnight
Move/In Out days for full day rentals will be 50% of the base rate
OUTDOOR FACILITIES RENTAL FEES
Fees Effective: September 1, 2022 to August 31, 2023
| Item | 2022 | % Increase | 2021 |
|---|---|---|---|
| Youth (Sand Volleyball/Tennis/Basketball per court per hour) | $ 9.25 | 2.78% | $ 9.00 |
| Adult (Sand Volleyball/Tennis/Basketball per court per hour) | $ 18.50 | 2.78% | $ 18.00 |
| Commercial - Youth | $ 18.50 | 2.78% | $ 18.00 |
| Commercial - Adult | $ 37.50 | 1.35% | $ 37.00 |
| BMX Track | Lease | Lease | |
| Ball Diamonds (per diamond per hour - minimum 2 hour rental) — Youth | $ 9.25 | 2.78% | $ 9.00 |
| Ball Diamonds — Adult | $ 18.50 | 2.78% | $ 18.00 |
| Playing Fields (per field per hour - minimum 2 hour rental) — Youth | $ 9.25 | 2.78% | $ 9.00 |
| Playing Fields — Adult | $ 18.50 | 2.78% | $ 18.00 |
| Lights - Field 1 ,2 & 3 - Youth & Adult * | $ 35.18 | 5.00% | $ 33.50 |
| Youth - Artificial Turf Field Youth Prime-Time** | $ 38.00 | 2.70% | $ 37.00 |
| Youth - Artificial Turf Field Youth Non-Prime*** | $ 19.00 | 2.70% | $ 18.50 |
| Adult - Artificial Turf Field | $ 62.00 | 3.33% | $ 60.00 |
| Commercial - Youth - Artificial Turf | $ 62.00 | 3.33% | $ 60.00 |
| Commercial - Adult - Artificial Turf | $ 93.00 | 3.33% | $ 90.00 |
| Lights - Artificial Turf Field | $ 25.73 | 5.00% | $ 24.50 |
| Lights - Lacrosse Box | $ 9.98 | 5.00% | $ 9.50 |
| Velodrome (per hour) — Youth | $ 22.00 | 10.00% | $ 20.00 |
| Velodrome — Adult | $ 22.00 | 10.00% | $ 20.00 |
| Velodrome — Commercial | $ 44.00 | 0.00% | $ 44.00 |
| Lights - Velodrome | $ 25.73 | 5.00% | $ 24.50 |
| Entire Picnic Shelter | $ 31.50 | 5.00% | $ 30.00 |
*Lights can be booked in 1/2 hour blocks at 50% of rate.
**Prime: All day time hours excluding below Non-Prime time hours
***Non-Prime: School Days 8:00 am - 3:30 pm (based on SD #62 calendar)
GOLF COURSE GREEN FEES AND RENTALS
(All Fees Include Applicable Taxes)
Winter - October 1, 2021 - March 31, 2022
| Category | 2022 | % Increase | 2021 |
|---|---|---|---|
| Child/Youth | $ 8.50 | 2.99% | $ 8.25 |
| Adult | $ 11.25 | 2.19% | $ 11.00 |
| Family** | $ 30.75 | 1.67% | $ 30.25 |
| Extra Rounds | $ 7.25 | 0.00% | $ 7.25 |
| Club Rentals | $ 7.25 | 0.00% | $ 7.25 |
| Cart Rentals | $ 4.75 | 0.00% | $ 4.75 |
Summer - April 1, 2022 - September 30, 2022
| Category | 2022 | % Increase | 2021 |
|---|---|---|---|
| Child/Youth | $ 11.00 | 4.80% | $ 10.50 |
| Adult | $ 16.50 | 3.08% | $ 16.00 |
| Family** | $ 43.00 | 1.16% | $ 42.50 |
Family rate includes four (4) people with 2 adults maximum
Fees and Charges — Additional Pages
(Additional detailed tables for Indoor Facilities rental fees, Arena Facilities rental fees, Outdoor Facilities rental fees and breakouts for each facility are included in the full Fees and Charges section covering pages with full rate histories from 2016–2022.)
Signature / Submission
Grant Brown, Administrator
(End of extracted content for pages 1 to 34.)
Document Images
(18)