DocumentsOtherMar 4, 2019Pages 59–96
Supplementary Attachments, Notices and Advertisements (assorted attachments and public notices)
Collection of supplementary pages including public notices, advertisements, appendices and supporting materials related to agenda items.
Key facts
- Contains public notices and newspaper advertisement excerpts for public hearings
- Includes appendices and supporting visuals for planning applications
- Pages are largely image-dominant and scanned attachments
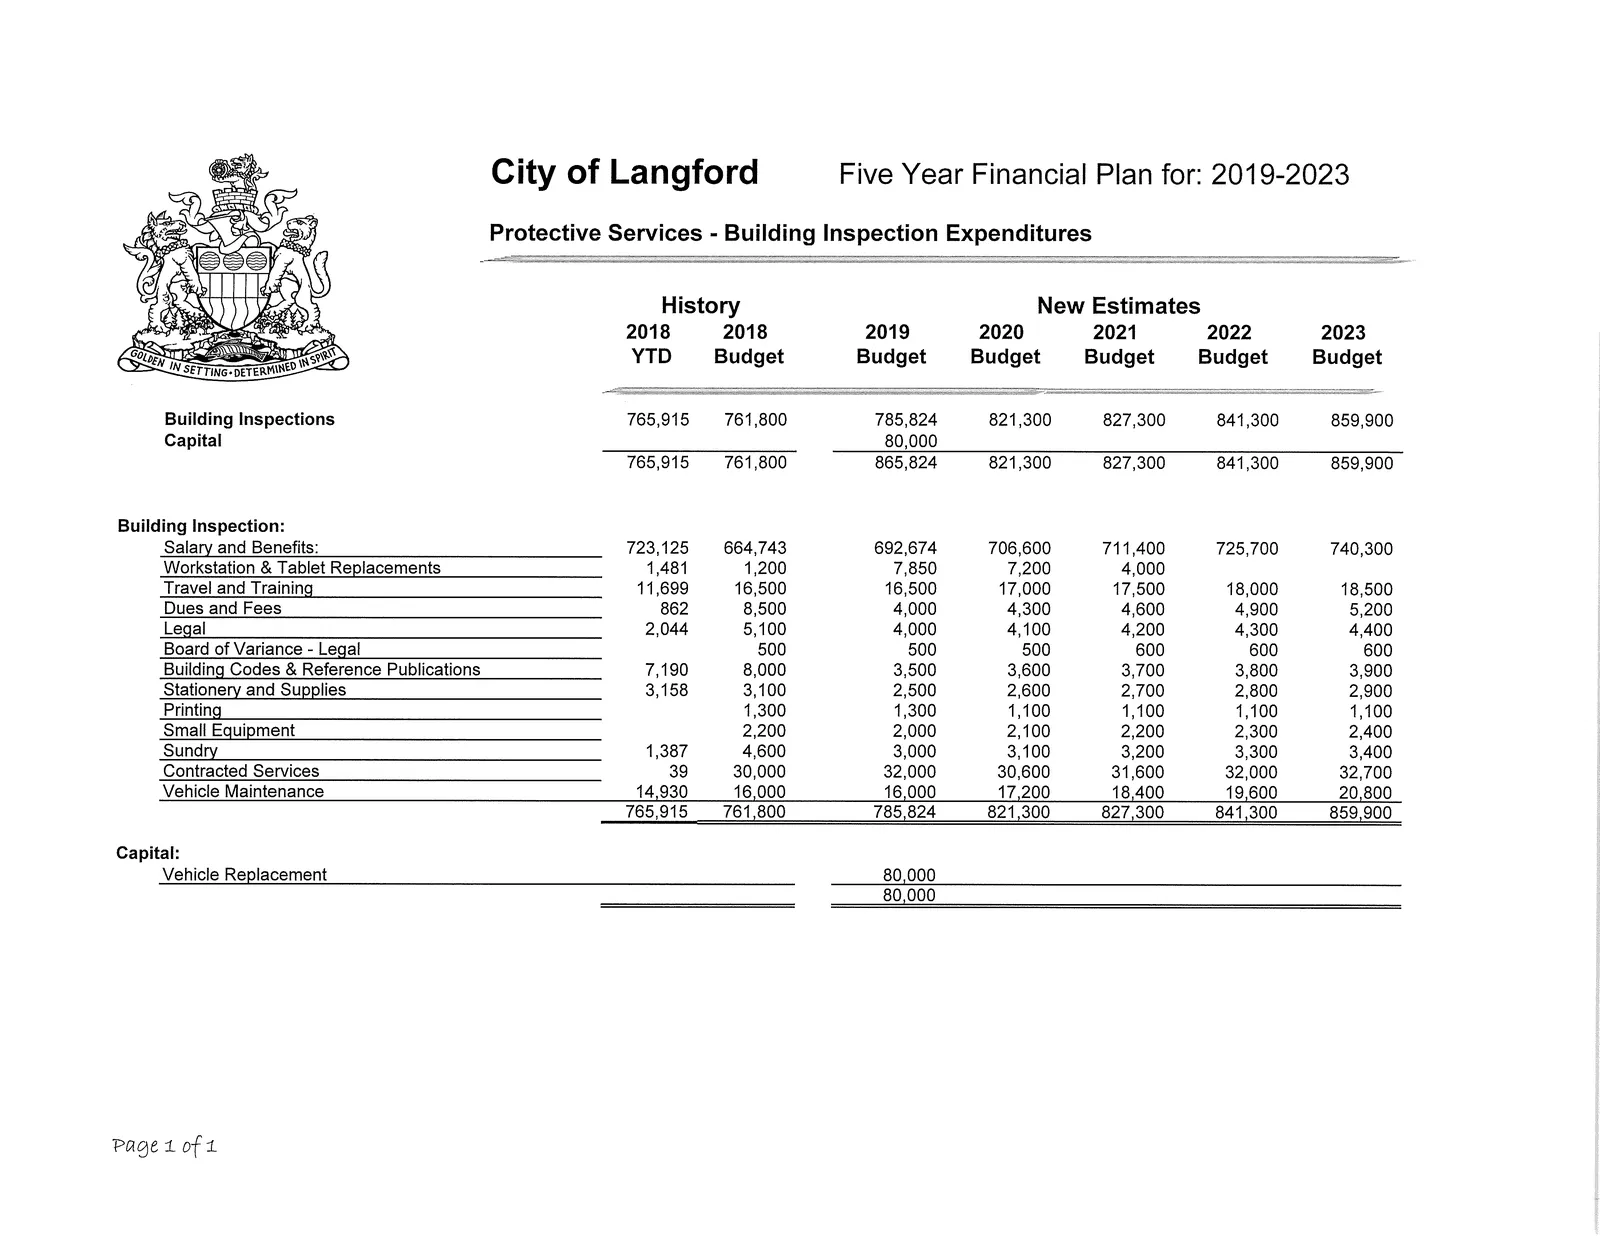
Protective Services - Building Inspection Expenditures
Summary (History / New Estimates)
| Category | 2018 YTD | 2018 Budget | 2019 Budget | 2020 Budget | 2021 Budget | 2022 Budget | 2023 Budget |
|---|---|---|---|---|---|---|---|
| Building Inspections (Total) | 765,915 | 761,800 | 785,824 | 821,300 | 827,300 | 841,300 | 859,900 |
| Capital | 80,000 | - | 80,000 (included in totals) | - | - | - | - |
Building Inspection - Detailed Breakdown
| Line Item | 2018 YTD | 2018 Budget | 2019 Budget | 2020 Budget | 2021 Budget | 2022 Budget | 2023 Budget |
|---|---|---|---|---|---|---|---|
| Salary and Benefits | 723,125 | 664,743 | 692,674 | 706,600 | 711,400 | 725,700 | 740,300 |
| Workstation & Tablet Replacements | 1,481 | 1,200 | 7,850 | 7,200 | 4,000 | - | - |
| Travel and Training | 11,699 | 16,500 | 16,500 | 17,000 | 17,500 | 18,000 | 18,500 |
| Dues and Fees | 862 | 8,500 | 4,000 | 4,300 | 4,600 | 4,900 | 5,200 |
| Legal | 2,044 | 5,100 | 4,000 | 4,100 | 4,200 | 4,300 | 4,400 |
| Board of Variance - Legal | - | 500 | 500 | 500 | 600 | 600 | 600 |
| Building Codes & Reference Publications | 7,190 | 8,000 | 3,500 | 3,600 | 3,700 | 3,800 | 3,900 |
| Stationery and Supplies | 3,158 | 3,100 | 2,500 | 2,600 | 2,700 | 2,800 | 2,900 |
| Printing | 1,300 | 1,300 | 1,100 | 1,100 | 1,100 | 1,100 | 1,100 |
| Small Equipment | 2,200 | 2,000 | 2,100 | 2,200 | 2,300 | 2,400 | - |
| Sundry | 1,387 | 4,600 | 3,000 | 3,100 | 3,200 | 3,300 | 3,400 |
| Contracted Services | 39 | 30,000 | 32,000 | 30,600 | 31,600 | 32,000 | 32,700 |
| Vehicle Maintenance | 14,930 | 16,000 | 16,000 | 17,200 | 18,400 | 19,600 | 20,800 |
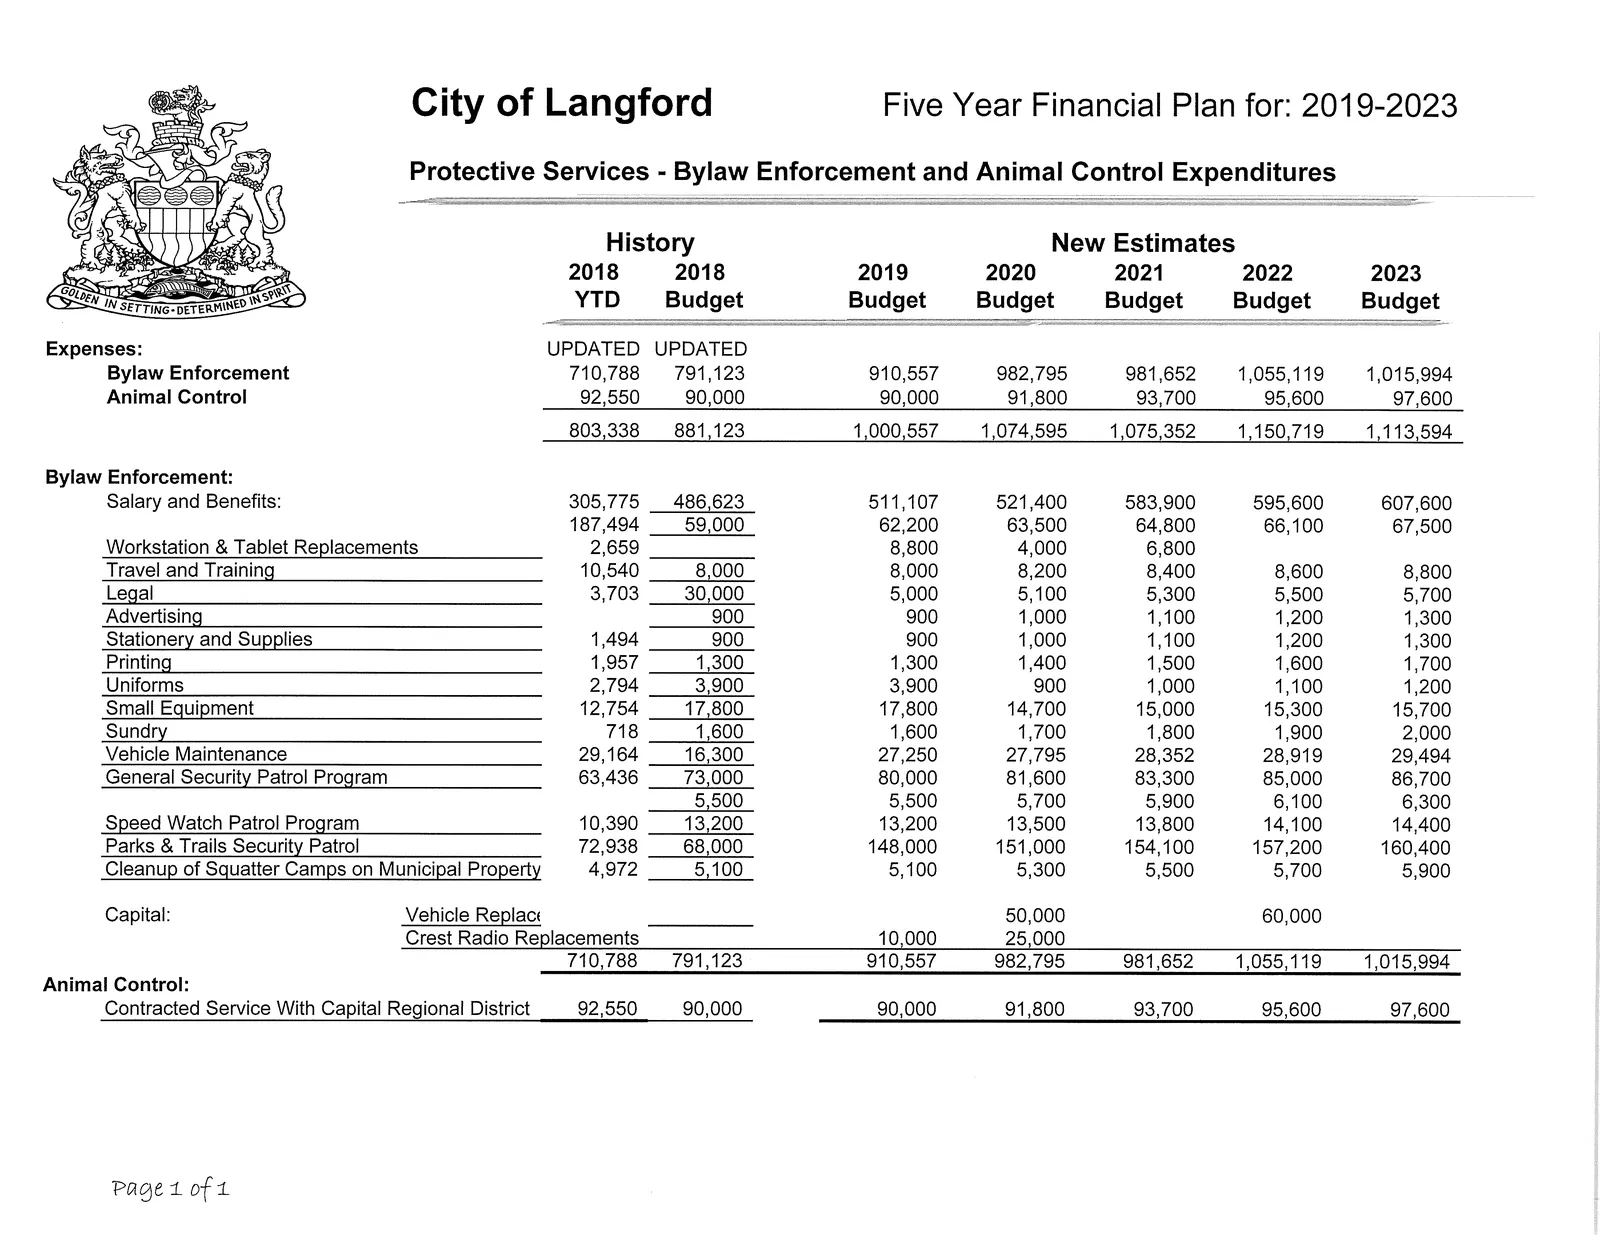
Protective Services - Bylaw Enforcement and Animal Control Expenditures
Summary (History / New Estimates)
| Category | 2018 YTD | 2018 Budget | 2019 Budget | 2020 Budget | 2021 Budget | 2022 Budget | 2023 Budget |
|---|---|---|---|---|---|---|---|
| Bylaw Enforcement | 710,788 | 791,123 | 910,557 | 982,795 | 981,652 | 1,055,119 | 1,015,994 |
| Animal Control | 92,550 | 90,000 | 90,000 | 91,800 | 93,700 | 95,600 | 97,600 |
| Total | 803,338 | 881,123 | 1,000,557 | 1,074,595 | 1,075,352 | 1,150,719 | 1,113,594 |
Bylaw Enforcement - Detailed Breakdown
| Line Item | 2018 YTD | 2018 Budget | 2019 Budget | 2020 Budget | 2021 Budget | 2022 Budget | 2023 Budget |
|---|---|---|---|---|---|---|---|
| Salary and Benefits | 305,775 | 486,623 | 511,107 | 521,400 | 583,900 | 595,600 | 607,600 |
| (Other Salary line) | 187,494 | 59,000 | 62,200 | 63,500 | 64,800 | 66,100 | 67,500 |
| Workstation & Tablet Replacements | 2,659 | - | 8,800 | 4,000 | - | 6,800 | - |
| Travel and Training | 10,540 | 8,000 | 8,000 | 8,200 | 8,400 | 8,600 | 8,800 |
| Legal | 3,703 | 30,000 | 5,000 | 5,100 | 5,300 | 5,500 | 5,700 |
| Advertising | - | 900 | - | 1,000 | 1,100 | 1,200 | 1,300 |
| Stationery and Supplies | 1,494 | 900 | 900 | 1,000 | 1,100 | 1,200 | 1,300 |
| Printing | 1,957 | 1,300 | 1,300 | 1,400 | 1,500 | 1,600 | 1,700 |
| Uniforms | 2,794 | 3,900 | 3,900 | 900 | 1,000 | 1,100 | 1,200 |
| Small Equipment | 12,754 | 17,800 | 17,800 | 14,700 | 15,000 | 15,300 | 15,700 |
| Sundry | 718 | 1,600 | 1,600 | 1,700 | 1,800 | 1,900 | 2,000 |
| Vehicle Maintenance | 29,164 | 16,300 | 27,250 | 27,795 | 28,352 | 28,919 | 29,494 |
| General Security Patrol Program | 63,436 | 73,000 | 80,000 | 81,600 | 83,300 | 85,000 | 86,700 |
| (Other patrol program) | 5,500 | 5,500 | - | 5,700 | 5,900 | 6,100 | 6,300 |
| Speed Watch Patrol Program | 10,390 | 13,200 | 13,200 | 13,500 | 13,800 | 14,100 | 14,400 |
| Parks & Trails Security Patrol | 72,938 | 68,000 | 148,000 | 151,000 | 154,100 | 157,200 | 160,400 |
| Cleanup of Squatter Camps on Municipal Property | 4,972 | 5,100 | 5,100 | 5,300 | 5,500 | 5,700 | 5,900 |
| Capital - Vehicle Replacement | - | 50,000 | 60,000 | - | - | - | - |
| Crest Radio Replacements | - | 10,000 | 25,000 | - | - | - | - |
Animal Control
| Line Item | 2018 YTD | 2018 Budget | 2019 Budget | 2020 Budget | 2021 Budget | 2022 Budget | 2023 Budget |
|---|---|---|---|---|---|---|---|
| Contracted Service with Capital Regional District | 92,550 | 90,000 | 90,000 | 91,800 | 93,700 | 95,600 | 97,600 |
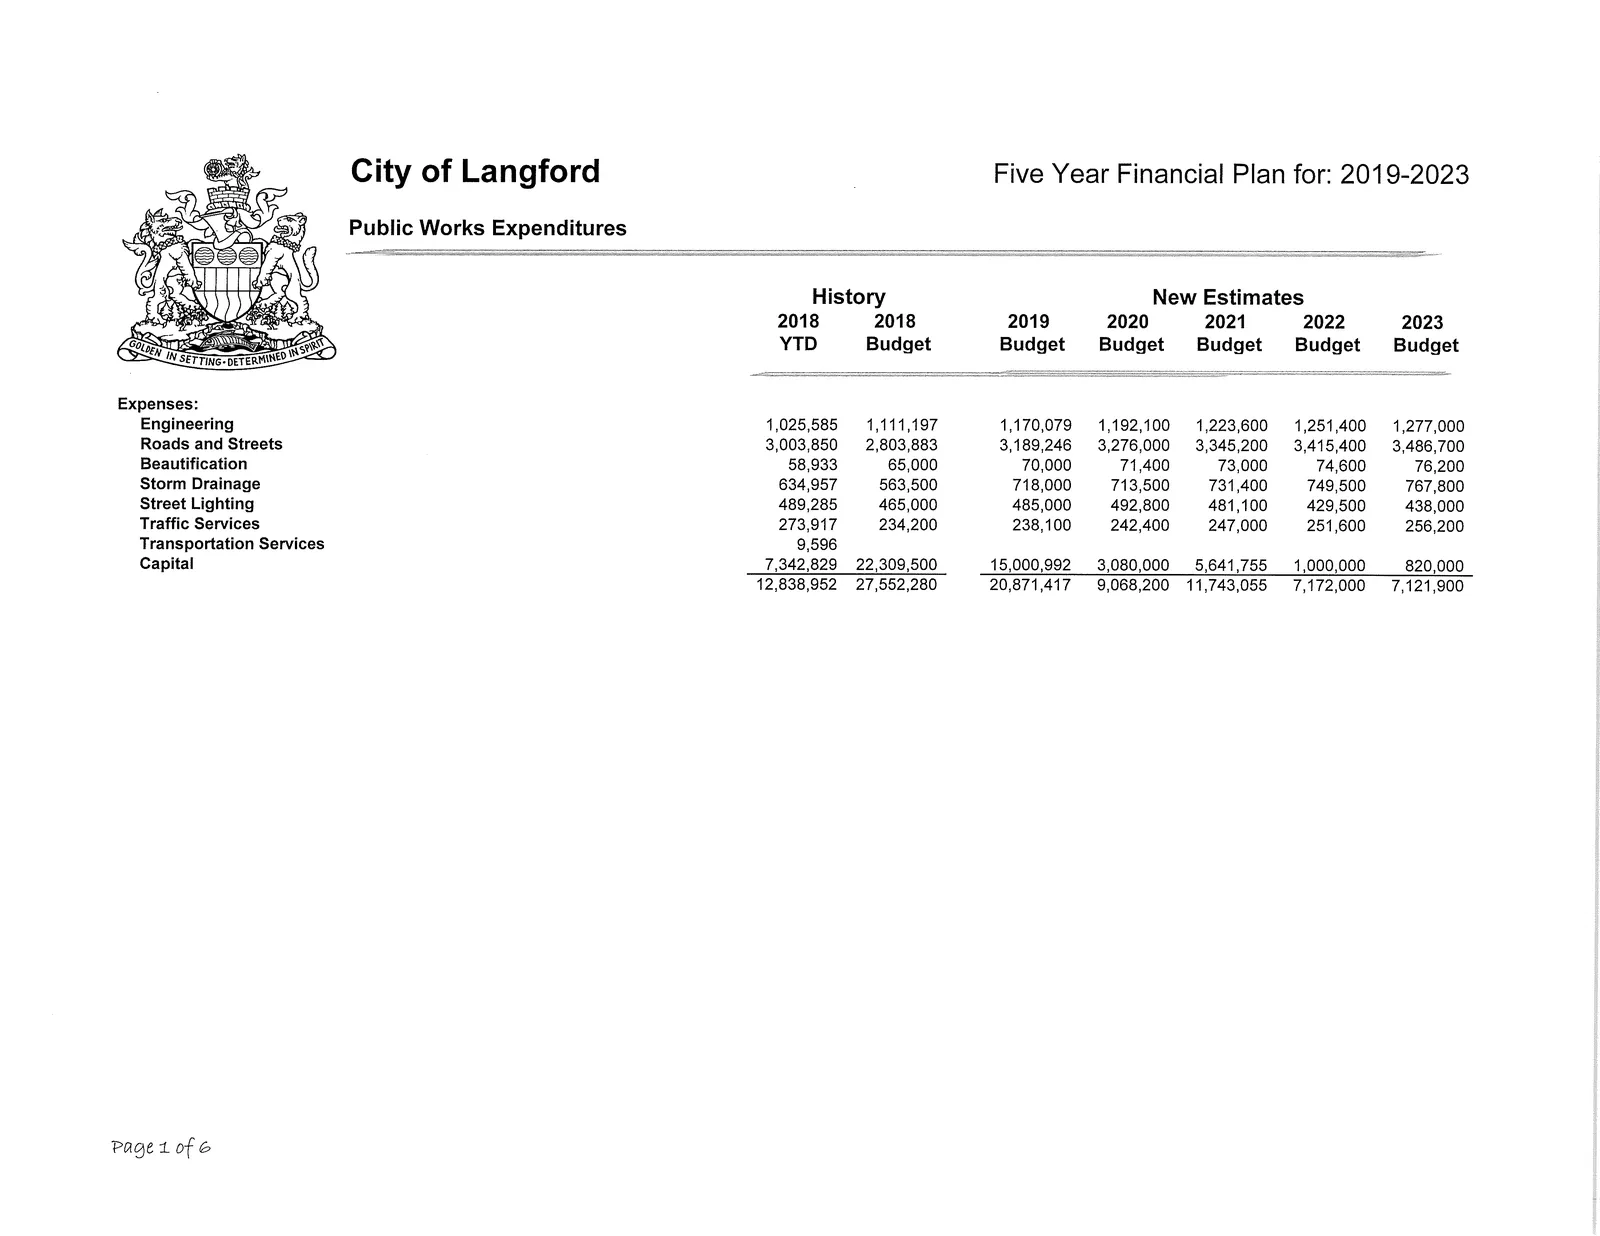
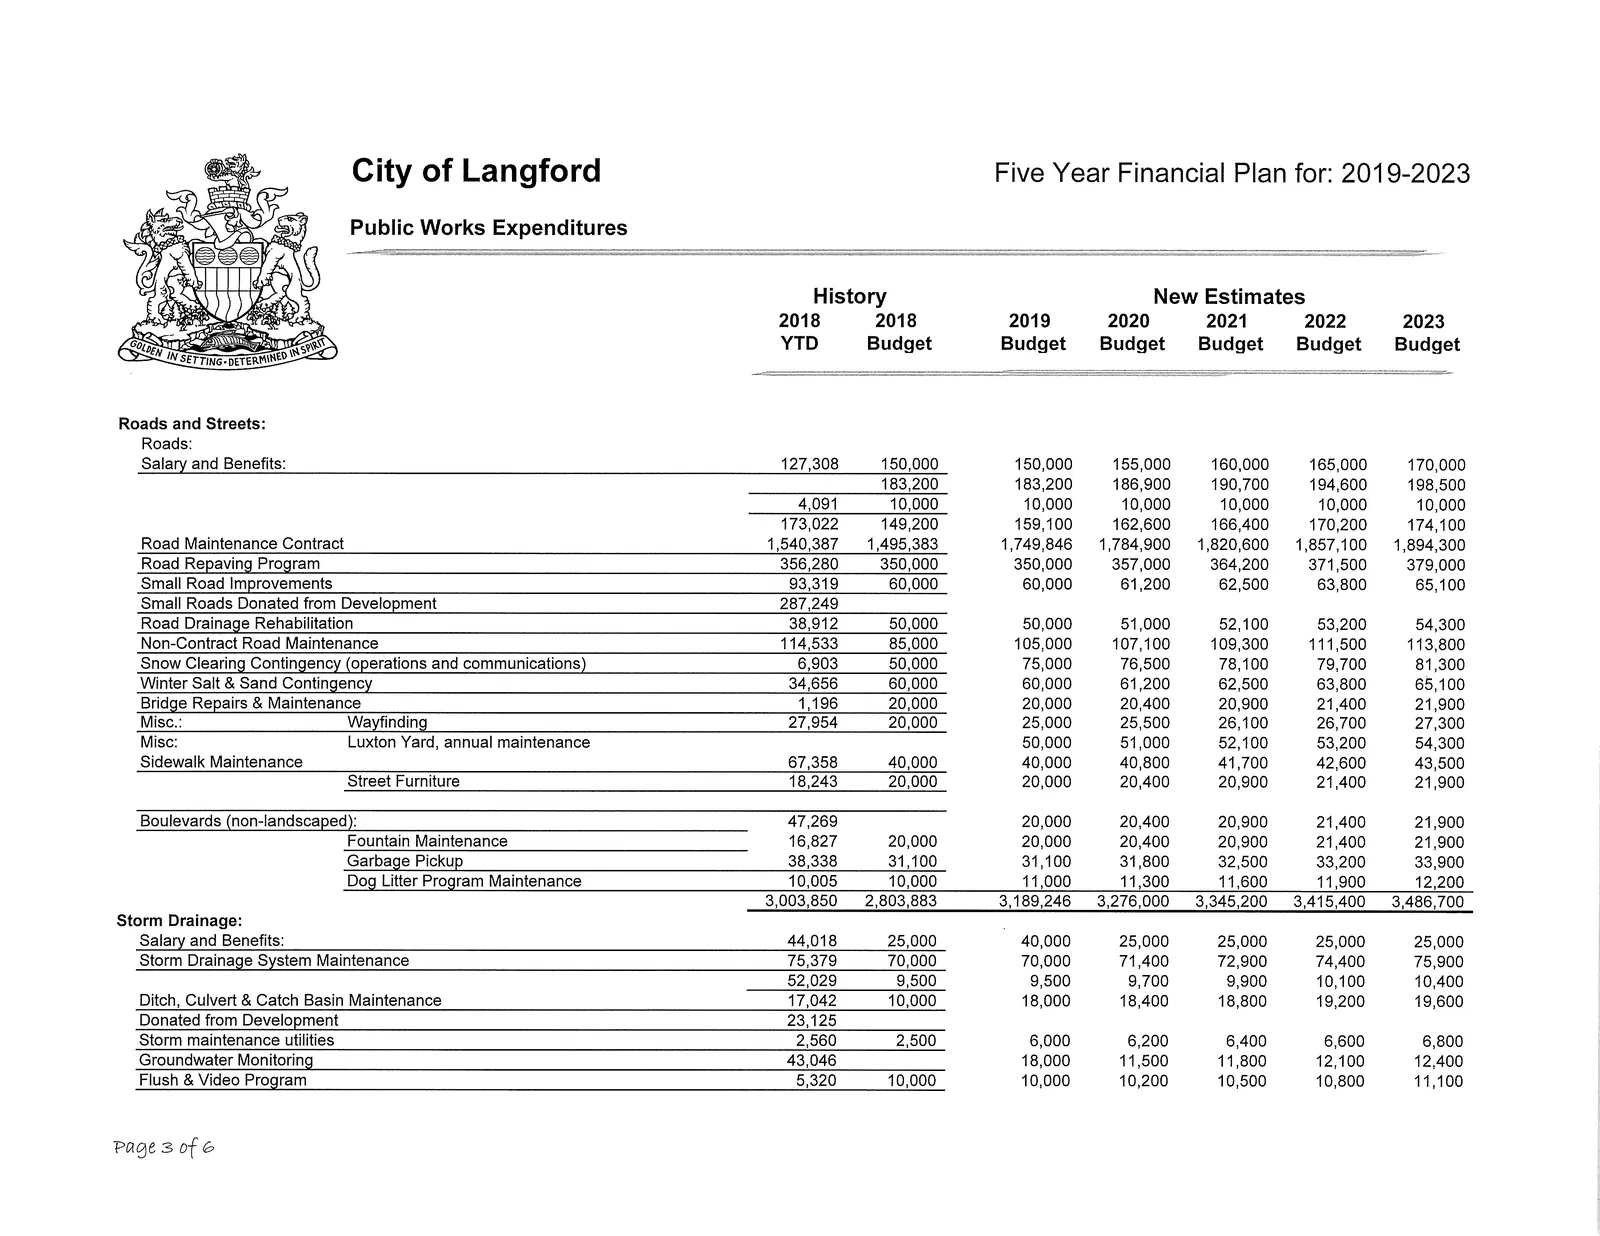
Public Works Expenditures
Summary (Major Categories)
| Category | 2018 YTD | 2018 Budget | 2019 Budget | 2020 Budget | 2021 Budget | 2022 Budget | 2023 Budget |
|---|---|---|---|---|---|---|---|
| Engineering | 1,025,585 | 1,111,197 | 1,170,079 | 1,192,100 | 1,223,600 | 1,251,400 | 1,277,000 |
| Roads and Streets | 3,003,850 | 2,803,883 | 3,189,246 | 3,276,000 | 3,345,200 | 3,415,400 | 3,486,700 |
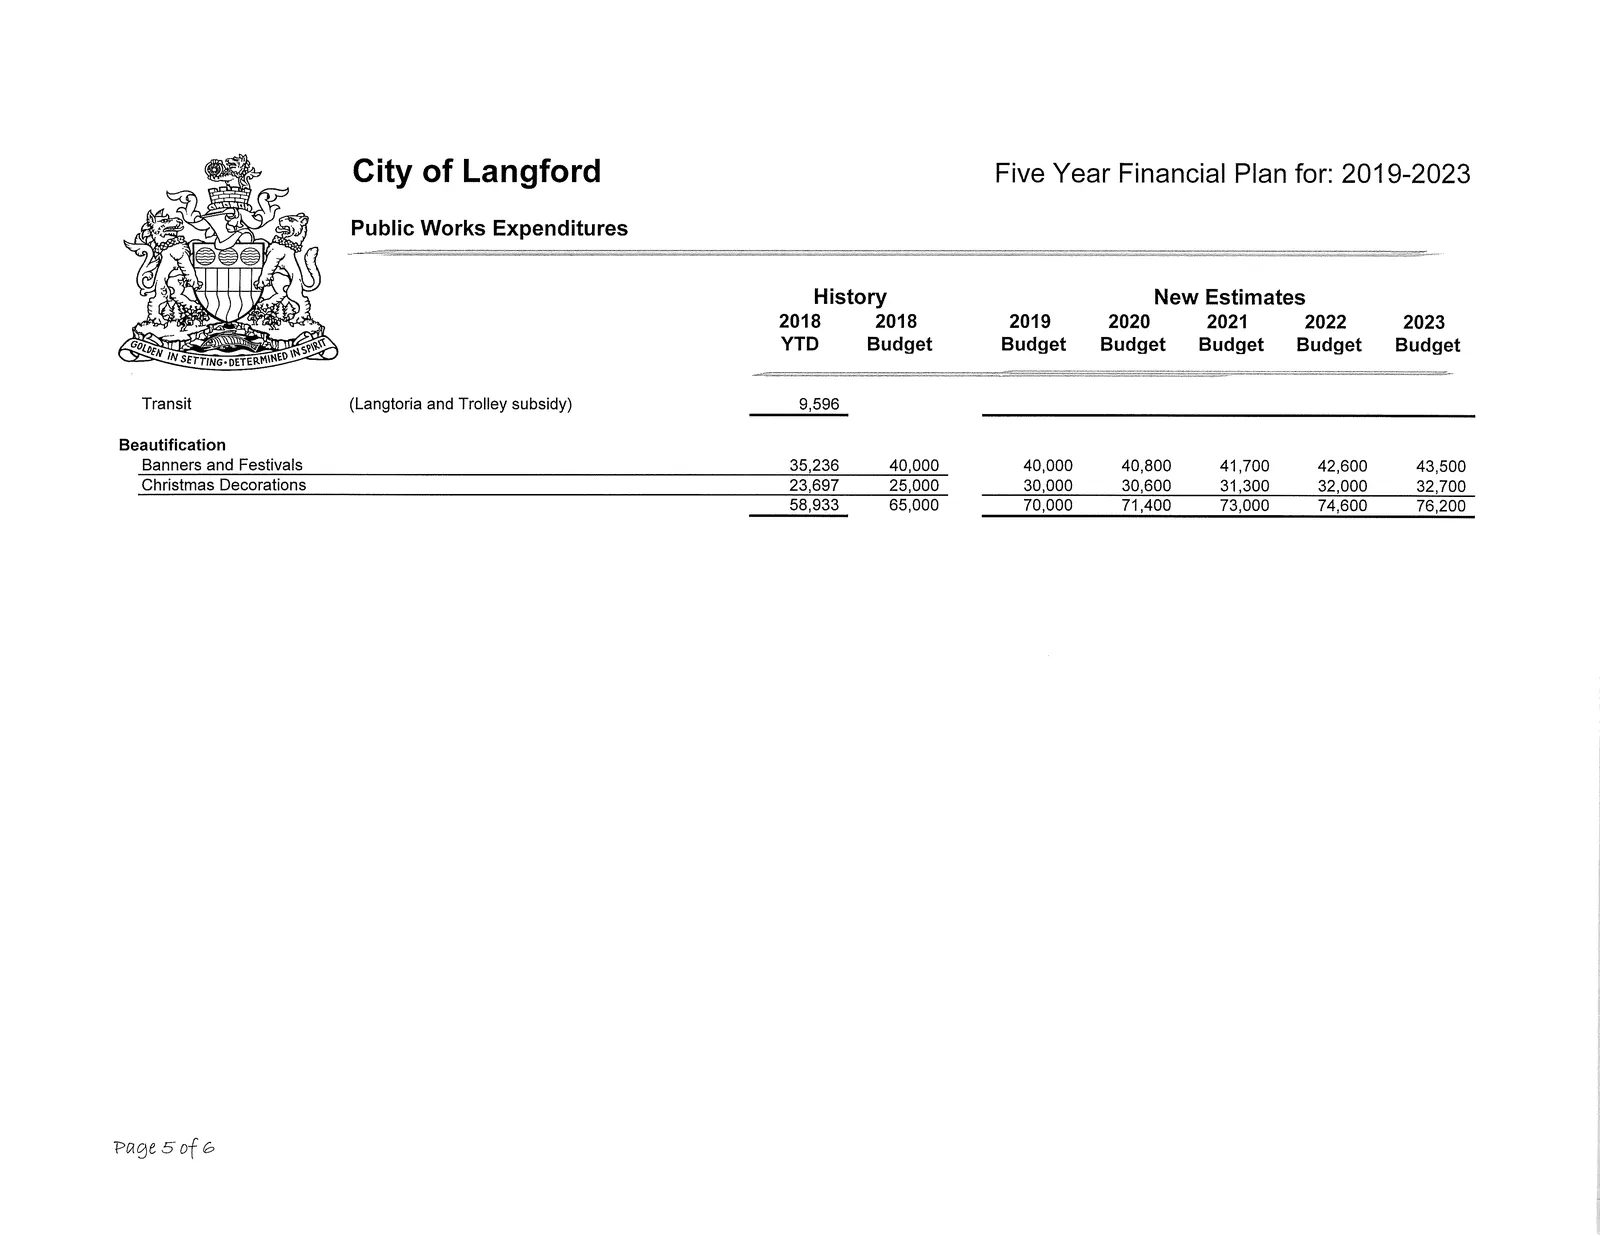
| Beautification | 58,933 | 65,000 | 70,000 | 71,400 | 73,000 | 74,600 | 76,200 |
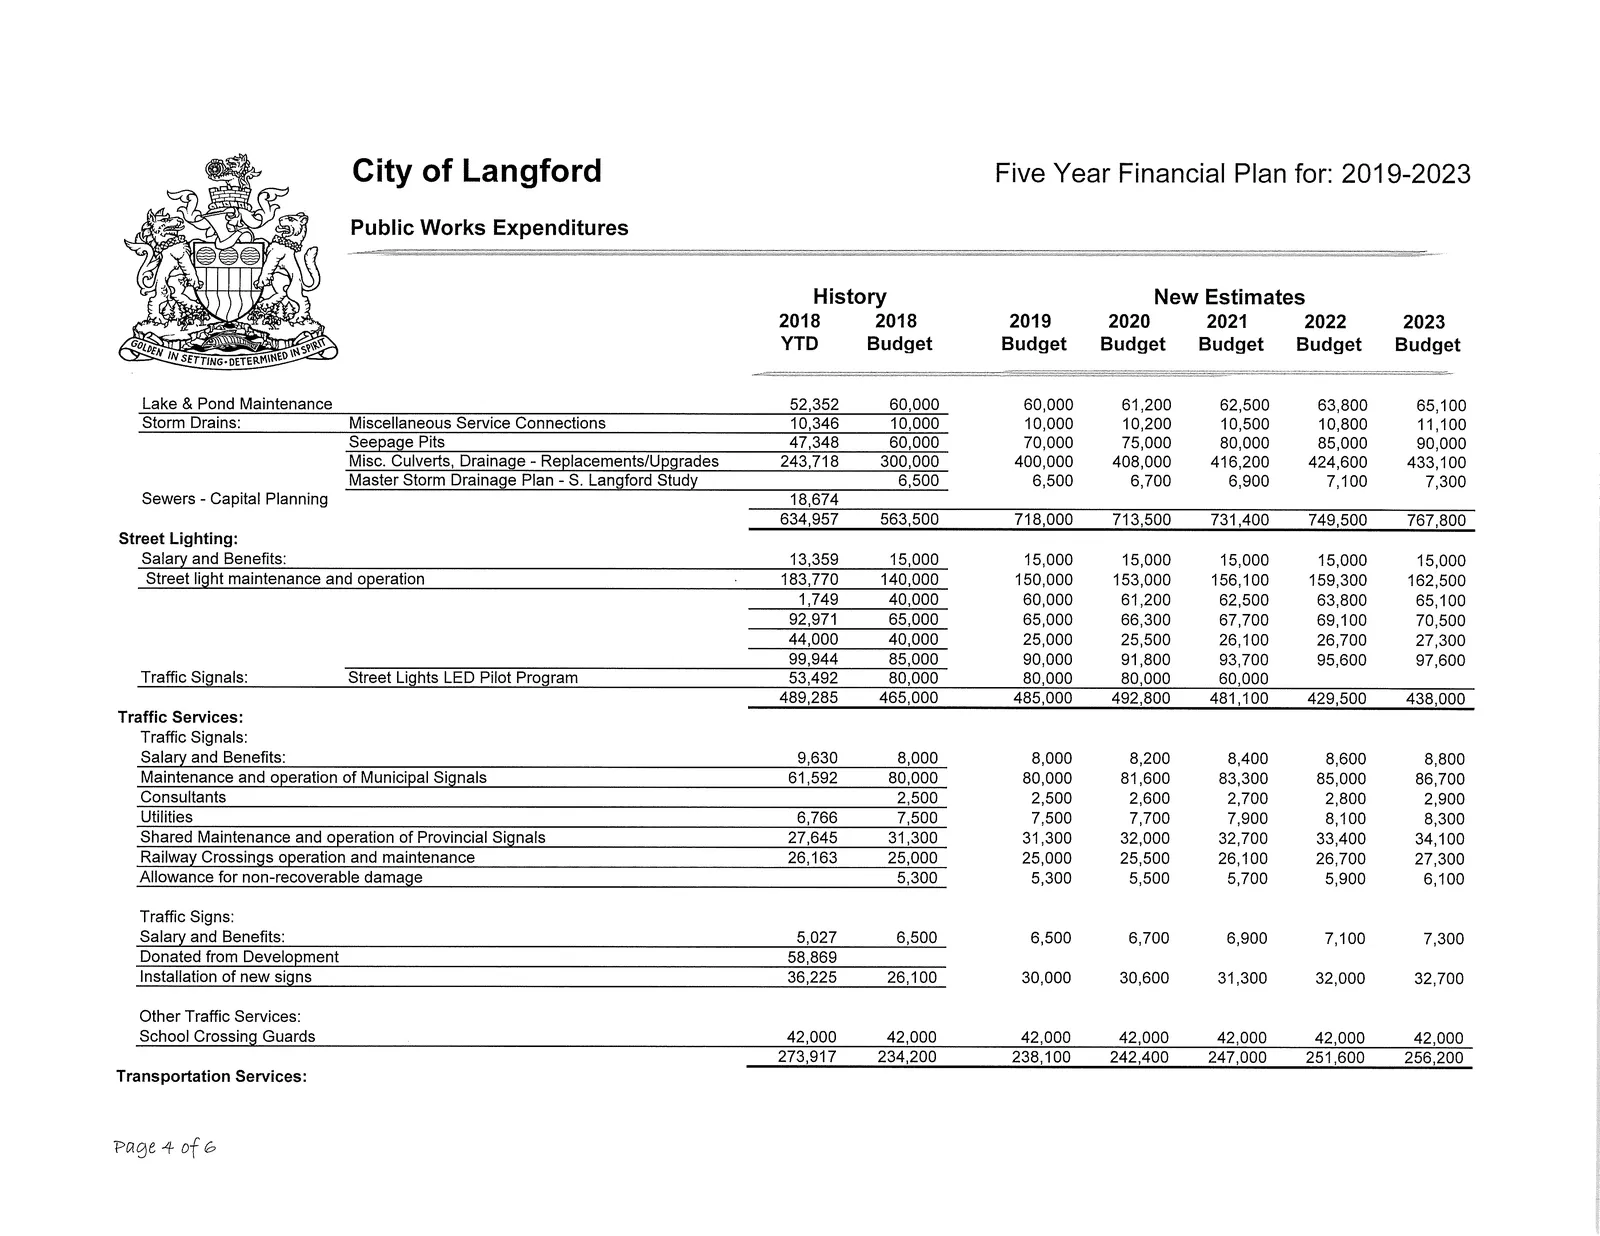
| Storm Drainage | 634,957 | 563,500 | 718,000 | 713,500 | 731,400 | 749,500 | 767,800 |
| Street Lighting | 489,285 | 465,000 | 485,000 | 492,800 | 481,100 | 429,500 | 438,000 |
| Traffic Services | 273,917 | 234,200 | 238,100 | 242,400 | 247,000 | 251,600 | 256,200 |
| Transportation Services | 9,596 | - | - | - | - | - | - |
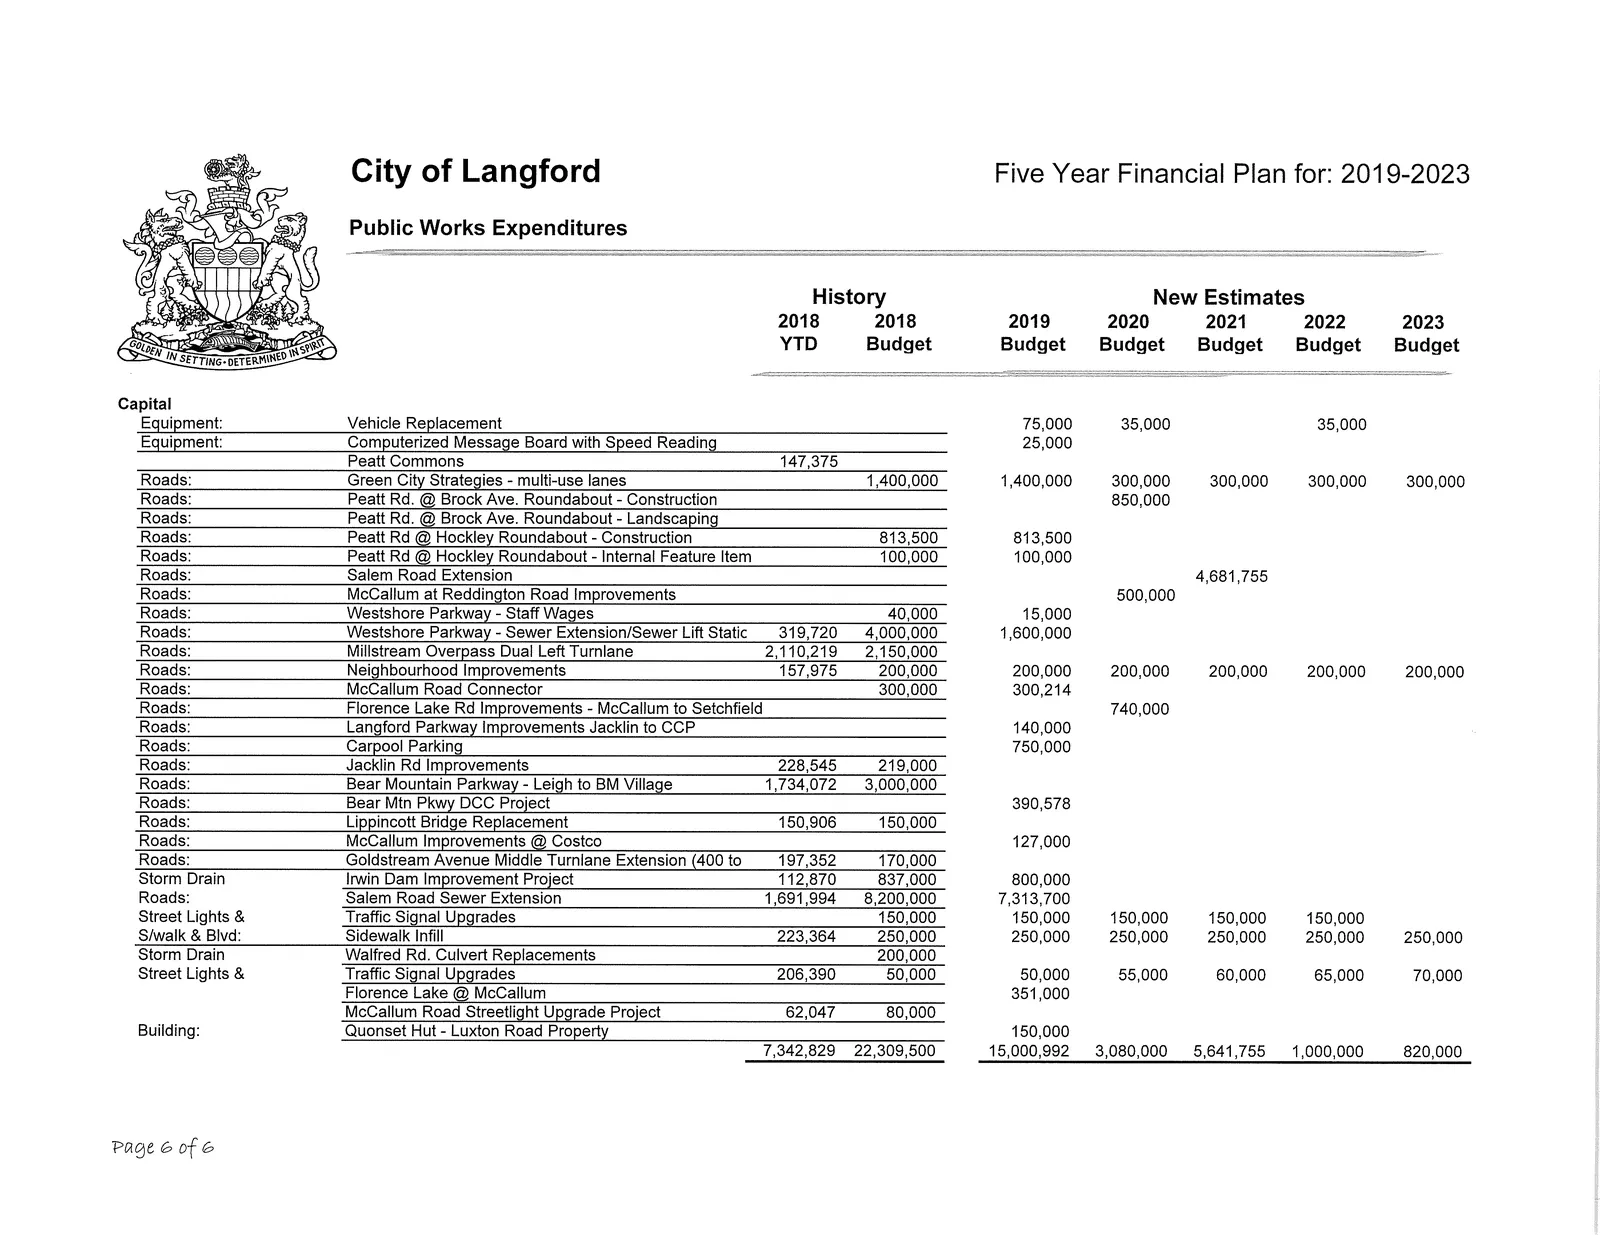
| Capital (Public Works) | 7,342,829 | 22,309,500 | 15,000,992 | 3,080,000 | 5,641,755 | 1,000,000 | 820,000 |
| Total (Public Works Expenditures) | 12,838,952 | 27,552,280 | 20,871,417 | 9,068,200 | 11,743,055 | 7,172,000 | 7,121,900 |
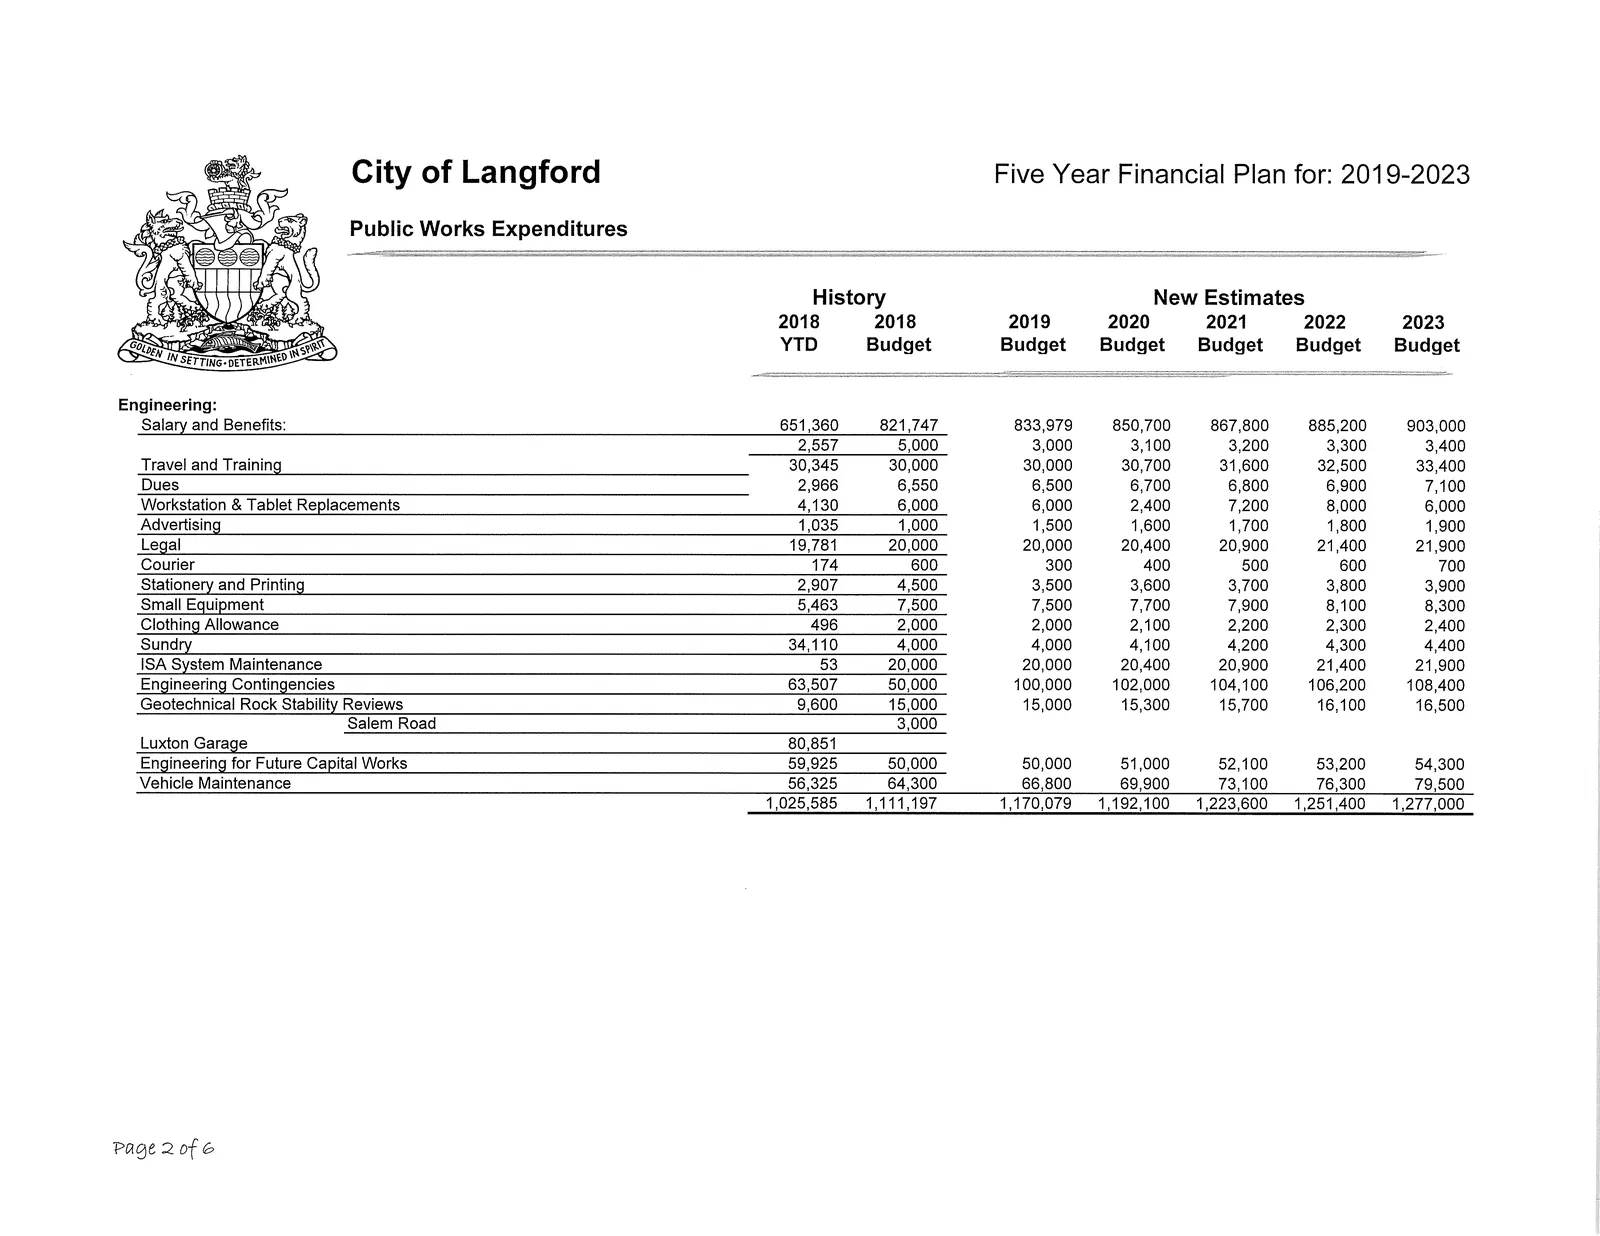
Engineering - Breakdown
| Line Item | 2018 YTD | 2018 Budget | 2019 Budget | 2020 Budget | 2021 Budget | 2022 Budget | 2023 Budget |
|---|---|---|---|---|---|---|---|
| Salary and Benefits | 651,360 | 821,747 | 833,979 | 850,700 | 867,800 | 885,200 | 903,000 |
| Workstation & Tablet Replacements | 4,130 | 6,000 | 6,000 | 2,400 | 7,200 | 8,000 | 6,000 |
| Travel and Training | 30,345 | 30,000 | 30,000 | 30,700 | 31,600 | 32,500 | 33,400 |
| Dues | 2,966 | 6,550 | 6,500 | 6,700 | 6,800 | 6,900 | 7,100 |
| Legal | 19,781 | 20,000 | 20,000 | 20,400 | 20,900 | 21,400 | 21,900 |
| ISA System Maintenance | 53 | 20,000 | 20,000 | 20,400 | 20,900 | 21,400 | 21,900 |
| Engineering Contingencies | 63,507 | 50,000 | 100,000 | 102,000 | 104,100 | 106,200 | 108,400 |
| Geotechnical Rock Stability Reviews | 9,600 | 15,000 | 15,000 | 15,300 | 15,700 | 16,100 | 16,500 |
| Engineering for Future Capital Works | 59,925 | 50,000 | 50,000 | 51,000 | 52,100 | 53,200 | 54,300 |
| Vehicle Maintenance | 56,325 | 64,300 | 66,800 | 69,900 | 73,100 | 76,300 | 79,500 |
| Other (Courier, Advertising, etc.) | various | see detail in source | see detail in source | - | - | - | - |
Roads and Streets - Selected Items and Totals
| Line Item | 2018 YTD | 2018 Budget | 2019 Budget | 2020 Budget | 2021 Budget | 2022 Budget | 2023 Budget |
|---|---|---|---|---|---|---|---|
| Roads - Salary and Benefits | 127,308 | 150,000 | 150,000 | 155,000 | 160,000 | 165,000 | 170,000 |
| Road Maintenance Contract | 1,540,387 | 1,495,383 | 1,749,846 | 1,784,900 | 1,820,600 | 1,857,100 | 1,894,300 |
| Road Repaving Program | 356,280 | 350,000 | 350,000 | 357,000 | 364,200 | 371,500 | 379,000 |
| Small Road Improvements | 93,319 | 60,000 | 60,000 | 61,200 | 62,500 | 63,800 | 65,100 |
| Non-Contract Road Maintenance | 114,533 | 85,000 | 105,000 | 107,100 | 109,300 | 111,500 | 113,800 |
| Snow Clearing Contingency (operations and communications) | 6,903 | 50,000 | 75,000 | 76,500 | 78,100 | 79,700 | 81,300 |
| Winter Salt & Sand Contingency | 34,656 | 60,000 | 60,000 | 61,200 | 62,500 | 63,800 | 65,100 |
| Sidewalk Maintenance | 67,358 | 40,000 | 40,000 | 40,800 | 41,700 | 42,600 | 43,500 |
| Street Furniture | 18,243 | 20,000 | 20,000 | 20,400 | 20,900 | 21,400 | 21,900 |
| Fountain Maintenance | 16,827 | 20,000 | 20,000 | 20,400 | 20,900 | 21,400 | 21,900 |
| Garbage Pickup | 38,338 | 31,100 | 31,100 | 31,800 | 32,500 | 33,200 | 33,900 |
| Dog Litter Program Maintenance | 10,005 | 10,000 | 11,000 | 11,300 | 11,600 | 11,900 | 12,200 |
| Roads & Streets - Total | 3,003,850 | 2,803,883 | 3,189,246 | 3,276,000 | 3,345,200 | 3,415,400 | 3,486,700 |
Storm Drainage - Selected Items and Totals
| Line Item | 2018 YTD | 2018 Budget | 2019 Budget | 2020 Budget | 2021 Budget | 2022 Budget | 2023 Budget |
|---|---|---|---|---|---|---|---|
| Salary and Benefits | 44,018 | 25,000 | 40,000 | 25,000 | 25,000 | 25,000 | 25,000 |
| Storm Drainage System Maintenance | 75,379 | 70,000 | 70,000 | 71,400 | 72,900 | 74,400 | 75,900 |
| Ditch, Culvert & Catch Basin Maintenance | 17,042 | 10,000 | 18,000 | 18,400 | 18,800 | 19,200 | 19,600 |
| Seepage Pits | 47,348 | 60,000 | 70,000 | 75,000 | 80,000 | 85,000 | 90,000 |
| Misc. Culverts, Drainage - Replacements/Upgrades | 243,718 | 300,000 | 400,000 | 408,000 | 416,200 | 424,600 | 433,100 |
| Lake & Pond Maintenance | 52,352 | 60,000 | 60,000 | 61,200 | 62,500 | 63,800 | 65,100 |
| Master Storm Drainage Plan - S. Langford Study | - | - | 6,500 | - | 6,700 | 6,900 | 7,100 |
| Sewers - Capital Planning | 18,674 | - | - | - | - | - | - |
| Storm Drainage - Total | 634,957 | 563,500 | 718,000 | 713,500 | 731,400 | 749,500 | 767,800 |
Street Lighting and Traffic Services - Selected Items
| Line Item | 2018 YTD | 2018 Budget | 2019 Budget | 2020 Budget | 2021 Budget | 2022 Budget | 2023 Budget |
|---|---|---|---|---|---|---|---|
| Street light maintenance and operation | 183,770 | 140,000 | 150,000 | 153,000 | 156,100 | 159,300 | 162,500 |
| Street Lights LED Pilot Program | 53,492 | 80,000 | 80,000 | 80,000 | 60,000 | - | - |
| Traffic Signals - Maintenance and operation of Municipal Signals | 61,592 | 80,000 | 80,000 | 81,600 | 83,300 | 85,000 | 86,700 |
| Shared Maintenance and operation of Provincial Signals | 27,645 | 31,300 | 31,300 | 32,000 | 32,700 | 33,400 | 34,100 |
| Installation of new signs | 36,225 | 26,100 | 30,000 | 30,600 | 31,300 | 32,000 | 32,700 |
| Traffic Services - Total | 273,917 | 234,200 | 238,100 | 242,400 | 247,000 | 251,600 | 256,200 |
Transportation Services (Beautification / Transit)
| Line Item | 2018 YTD | 2018 Budget | 2019 Budget | 2020 Budget | 2021 Budget | 2022 Budget | 2023 Budget |
|---|---|---|---|---|---|---|---|
| Transit (Langtoria and Trolley subsidy) | 9,596 | - | - | - | - | - | - |
| Banners and Festivals | 35,236 | 40,000 | 40,000 | 40,800 | 41,700 | 42,600 | 43,500 |
| Christmas Decorations | 23,697 | 25,000 | 30,000 | 30,600 | 31,300 | 32,000 | 32,700 |
| Beautification - Total | 58,933 | 65,000 | 70,000 | 71,400 | 73,000 | 74,600 | 76,200 |
Public Works - Capital (selected)
- Equipment: Vehicle Replacement: 75,000 (2019), 35,000 (2020), 35,000 (2021)
- Equipment: Computerized Message Board with Speed Reading: 25,000
- Peatt Commons: 147,375
- Roads: Green City Strategies - multi-use lanes: 1,400,000 (2019), phased amounts thereafter (300,000)
- Roads: Peatt Rd. @ Brock Ave. Roundabout - Construction: 850,000
- Roads: Peatt Rd @ Hockley Roundabout - Construction: 813,500
- Roads: Peatt Rd @ Hockley Roundabout - Internal Feature Item: 100,000
- Roads: Salem Road Extension: 4,681,755 (2019)
- Roads: Westshore Parkway - Sewer Extension/Sewer Lift Station: 1,600,000 (2019)
- Roads: Millstream Overpass Dual Left Turnlane: 2,110,219 (2019)
- Roads: Neighbourhood Improvements: 157,975 (2019) then 200,000 annually
- Roads: McCallum Road Connector: 300,214
- Roads: Florence Lake Rd Improvements - McCallum to Setchfield: 740,000
- Roads: Carpool Parking: 750,000
- Storm Drain: Irwin Dam Improvement Project: 837,000 / 800,000 amounts shown
- Roads: Salem Road Sewer Extension: 1,691,994 / 8,200,000 / 7,313,700 (various years)
- Street Lights & Traffic Signal Upgrades: 150,000 (annual)
- Sidewalk & Boulevard: Sidewalk Infill: 223,364 (2019), 250,000 annually thereafter
- Walfred Rd. Culvert Replacements: 200,000
- McCallum Road Streetlight Upgrade Project: 62,047 (2019), 80,000 (2020)
- Building: Quonset Hut - Luxton Road Property: 150,000
Total Public Works Capital (selected totals shown above):
| 2018 Total | 2019 Total | 2020 Total | 2021 Total | 2022 Total | 2023 Total |
|---|---|---|---|---|---|
| 7,342,829 | 22,309,500 | 15,000,992 | 3,080,000 | 5,641,755 | 1,000,000 |
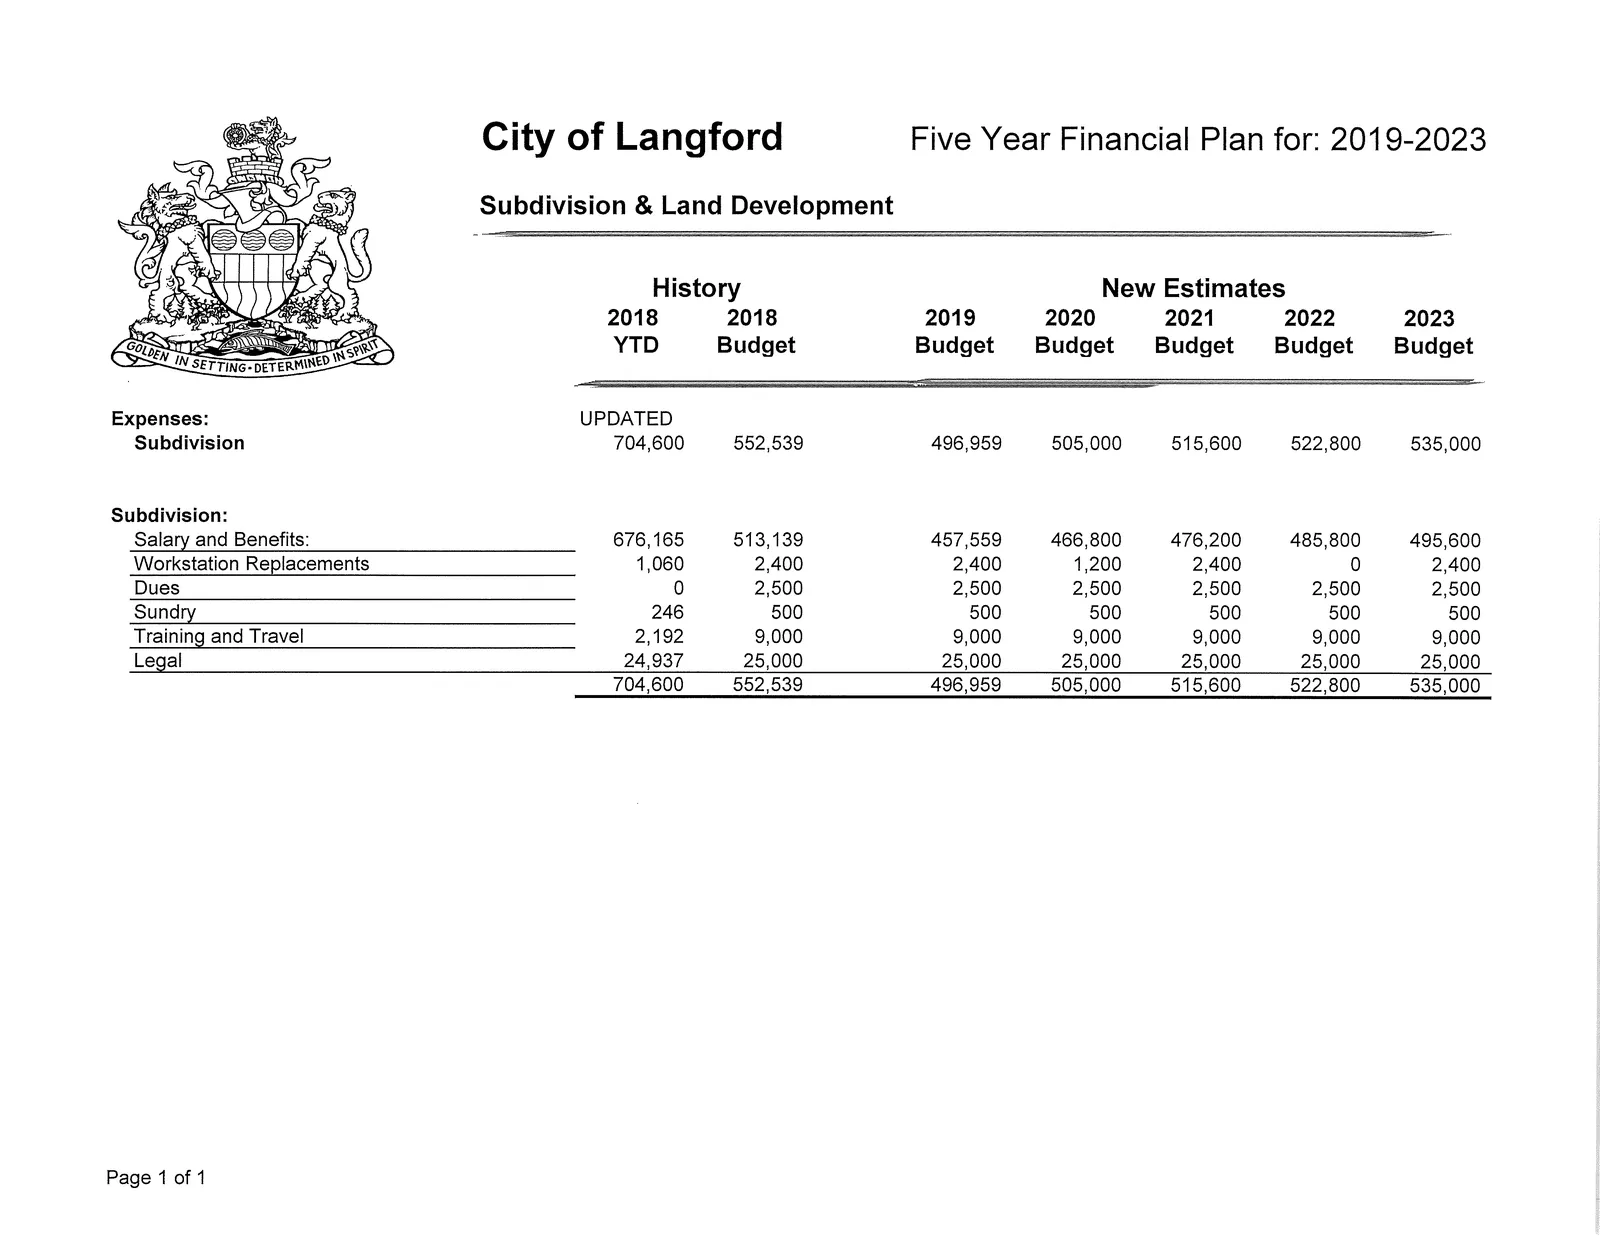
Subdivision & Land Development
Summary (History / New Estimates)
| Category | 2018 YTD | 2018 Budget | 2019 Budget | 2020 Budget | 2021 Budget | 2022 Budget | 2023 Budget |
|---|---|---|---|---|---|---|---|
| Subdivision (Total) | 704,600 | 552,539 | 496,959 | 505,000 | 515,600 | 522,800 | 535,000 |
Subdivision - Breakdown
| Line Item | 2018 YTD | 2018 Budget | 2019 Budget | 2020 Budget | 2021 Budget | 2022 Budget | 2023 Budget |
|---|---|---|---|---|---|---|---|
| Salary and Benefits | 676,165 | 513,139 | 457,559 | 466,800 | 476,200 | 485,800 | 495,600 |
| Workstation Replacements | 1,060 | 2,400 | 2,400 | 1,200 | 2,400 | 0 | 2,400 |
| Dues | 0 | 2,500 | 2,500 | 2,500 | 2,500 | 2,500 | 2,500 |
| Sundry | 246 | 500 | 500 | 500 | 500 | 500 | 500 |
| Training and Travel | 2,192 | 9,000 | 9,000 | 9,000 | 9,000 | 9,000 | 9,000 |
| Legal | 24,937 | 25,000 | 25,000 | 25,000 | 25,000 | 25,000 | 25,000 |
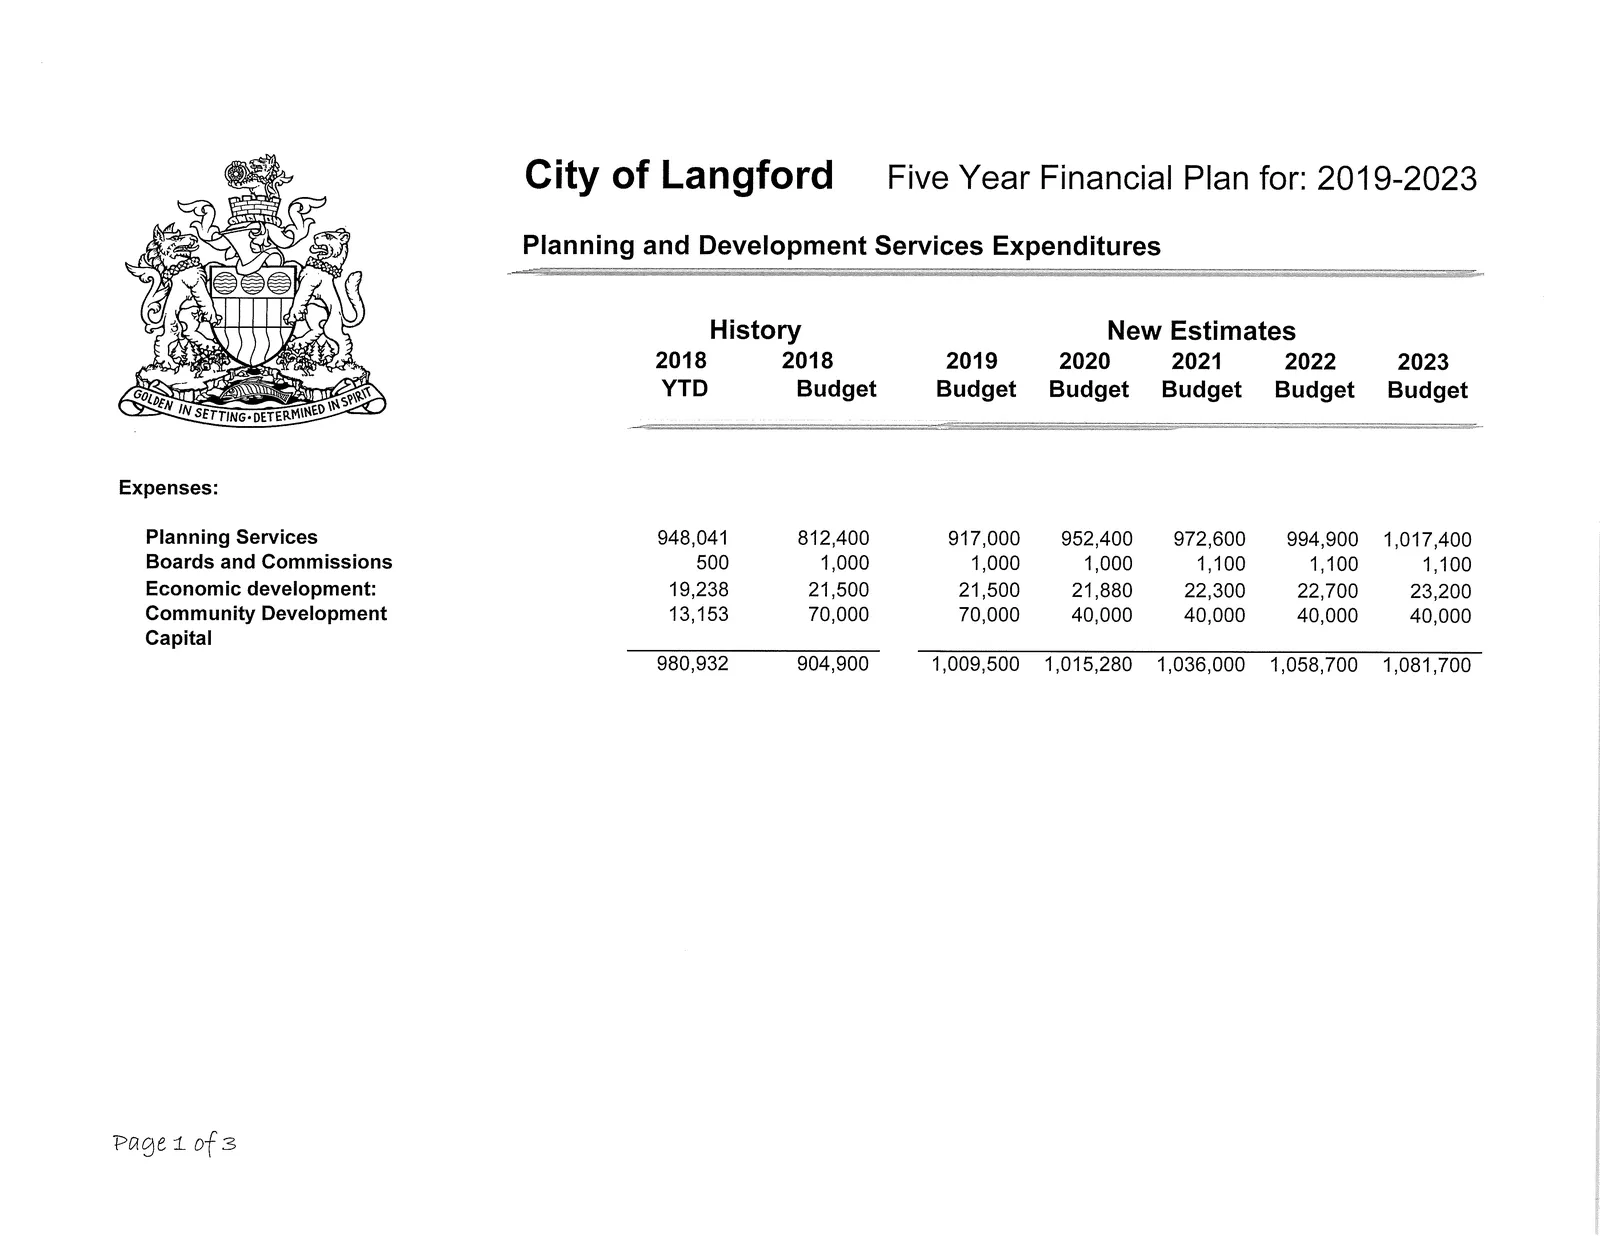
Planning and Development Services Expenditures
Summary (History / New Estimates)
| Category | 2018 YTD | 2018 Budget | 2019 Budget | 2020 Budget | 2021 Budget | 2022 Budget | 2023 Budget |
|---|---|---|---|---|---|---|---|
| Planning Services | 948,041 | 812,400 | 917,000 | 952,400 | 972,600 | 994,900 | 1,017,400 |
| Boards and Commissions | 500 | 1,000 | 1,000 | 1,000 | 1,100 | 1,100 | 1,100 |
| Economic Development | 19,238 | 21,500 | 21,500 | 21,880 | 22,300 | 22,700 | 23,200 |
| Community Development | 13,153 | 70,000 | 70,000 | 40,000 | 40,000 | 40,000 | 40,000 |
| Total | 980,932 | 904,900 | 1,009,500 | 1,015,280 | 1,036,000 | 1,058,700 | 1,081,700 |
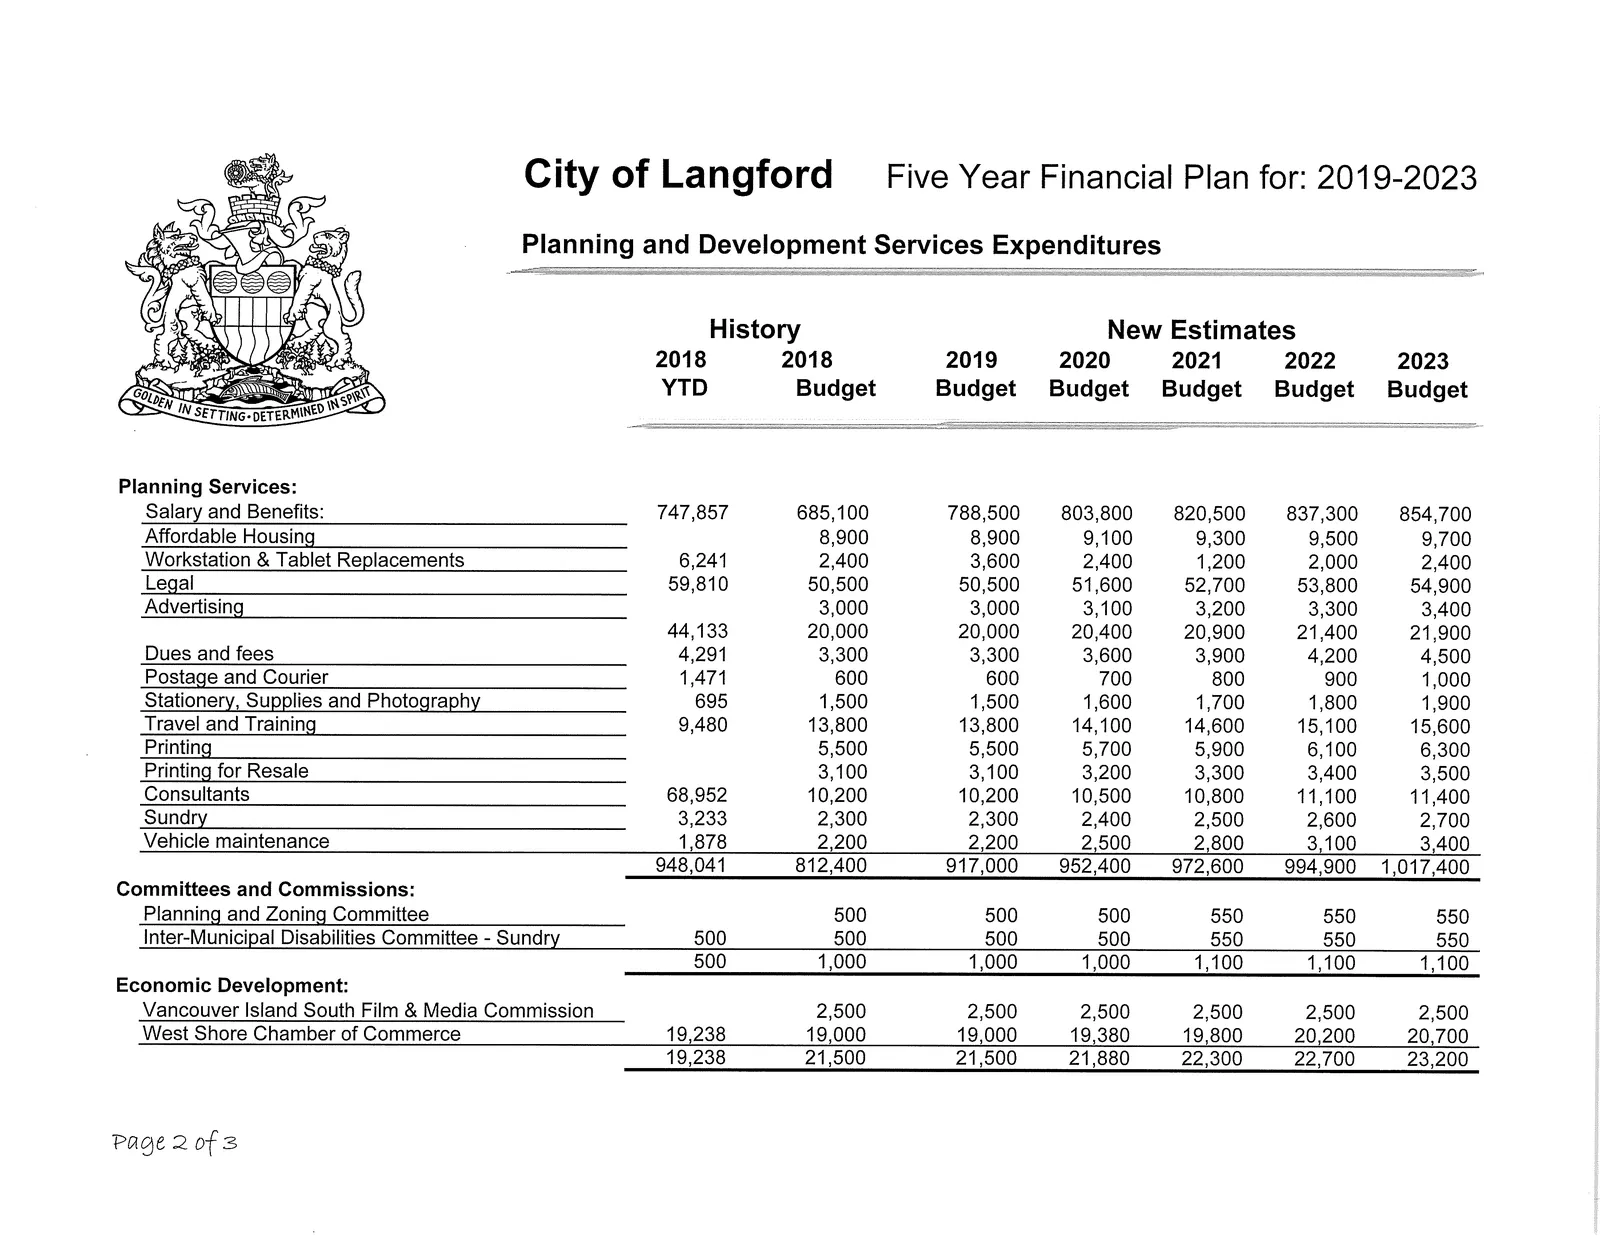
Planning Services - Selected Breakdown
| Line Item | 2018 YTD | 2018 Budget | 2019 Budget | 2020 Budget | 2021 Budget | 2022 Budget | 2023 Budget |
|---|---|---|---|---|---|---|---|
| Salary and Benefits | 747,857 | 685,100 | 788,500 | 803,800 | 820,500 | 837,300 | 854,700 |
| Affordable Housing | - | 8,900 | 8,900 | 9,100 | 9,300 | 9,500 | 9,700 |
| Workstation & Tablet Replacements | 6,241 | 2,400 | 3,600 | 2,400 | 1,200 | 2,000 | 2,400 |
| Legal | 59,810 | 50,500 | 50,500 | 51,600 | 52,700 | 53,800 | 54,900 |
| Consultants | 68,952 | 10,200 | 10,200 | 10,500 | 10,800 | 11,100 | 11,400 |
| Travel and Training | 9,480 | 13,800 | 13,800 | 14,100 | 14,600 | 15,100 | 15,600 |
| Printing / Postage / Supplies / Dues | various | see detail in source | see detail in source | - | - | - | - |
Committees and Commissions
- Planning and Zoning Committee: 500 (2019) rising to 550 (2021 onwards)
- Inter-Municipal Disabilities Committee - Sundry: 500 (2019) rising to 550 (2021 onwards)
Economic Development
- Vancouver Island South Film & Media Commission: 2,500 annually
- West Shore Chamber of Commerce: 19,238 (2018) then 19,000 / 19,380 / 19,800 / 20,200 / 20,700
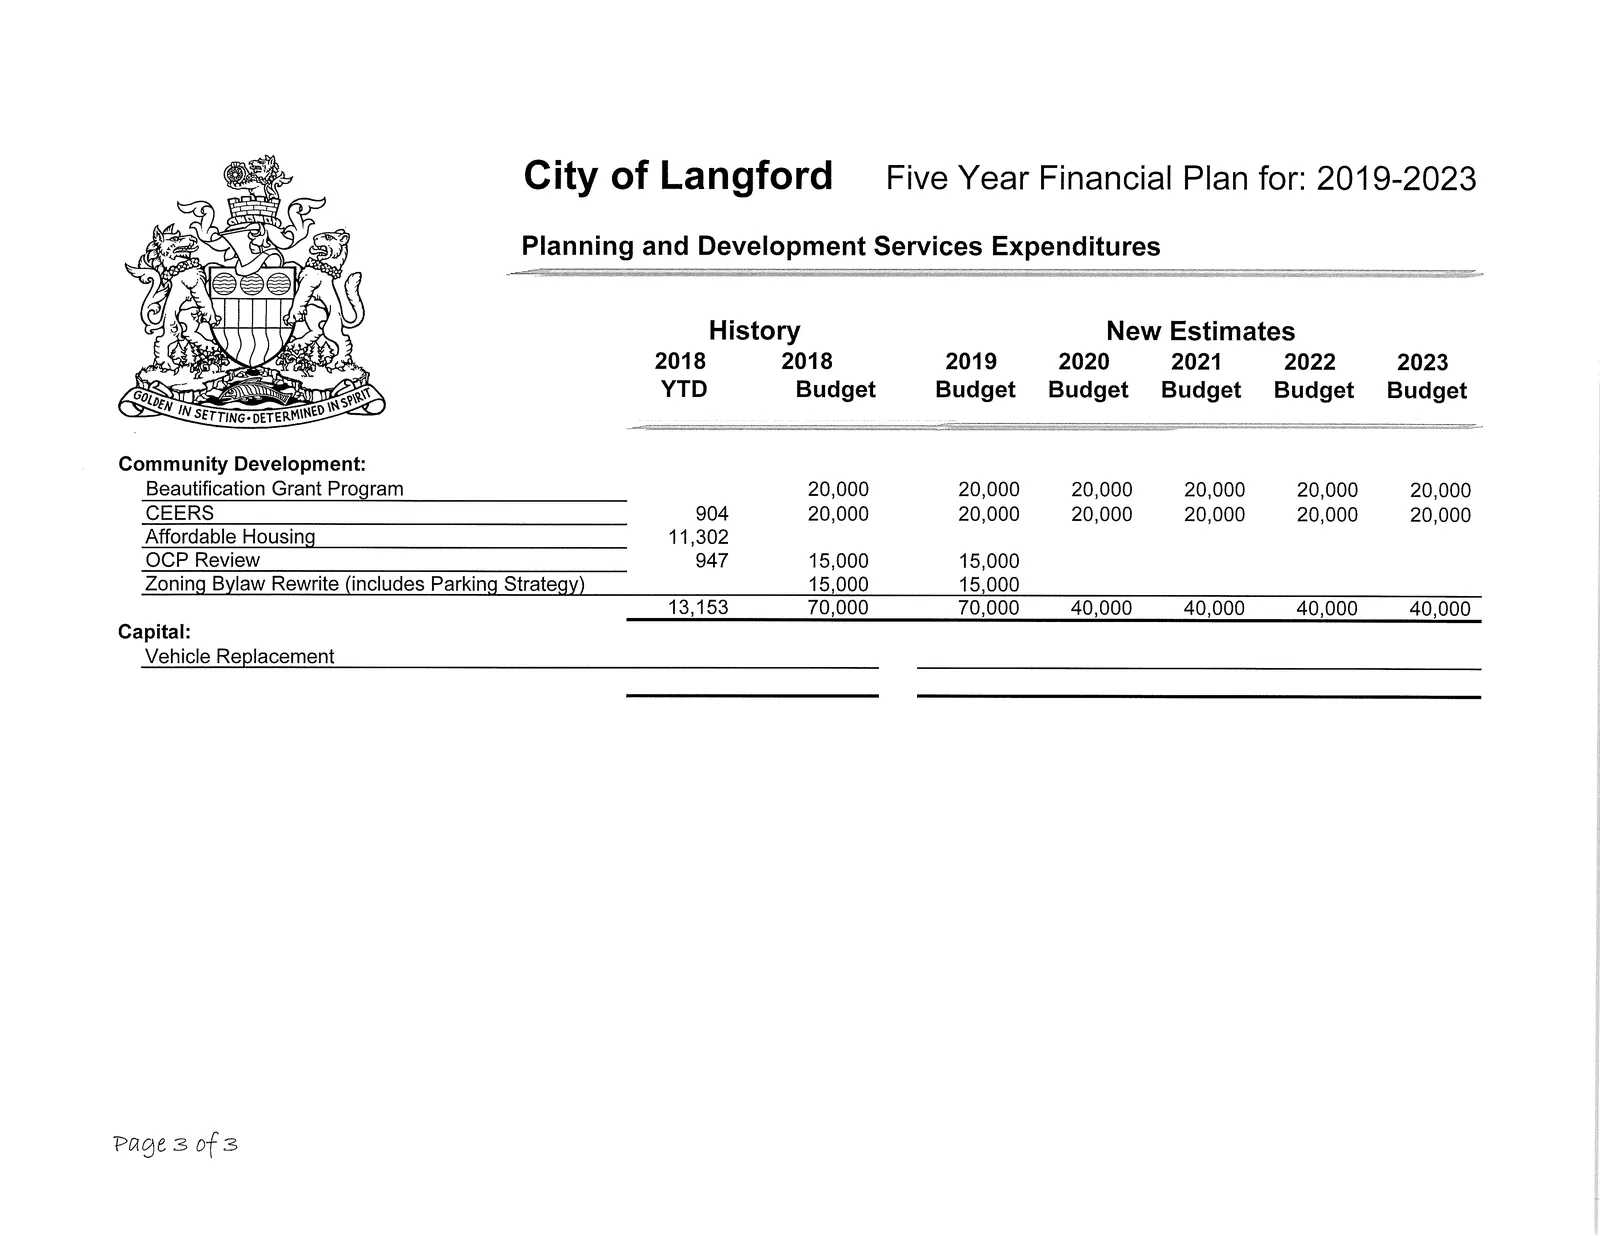
Community Development
- Beautification Grant Program: 20,000 annually
- CEERS: 904 (2018) then 20,000 annually
- Affordable Housing: line present (11,302 in 2018)
- OCP Review / Zoning Bylaw Rewrite: amounts shown (15,000 lines)
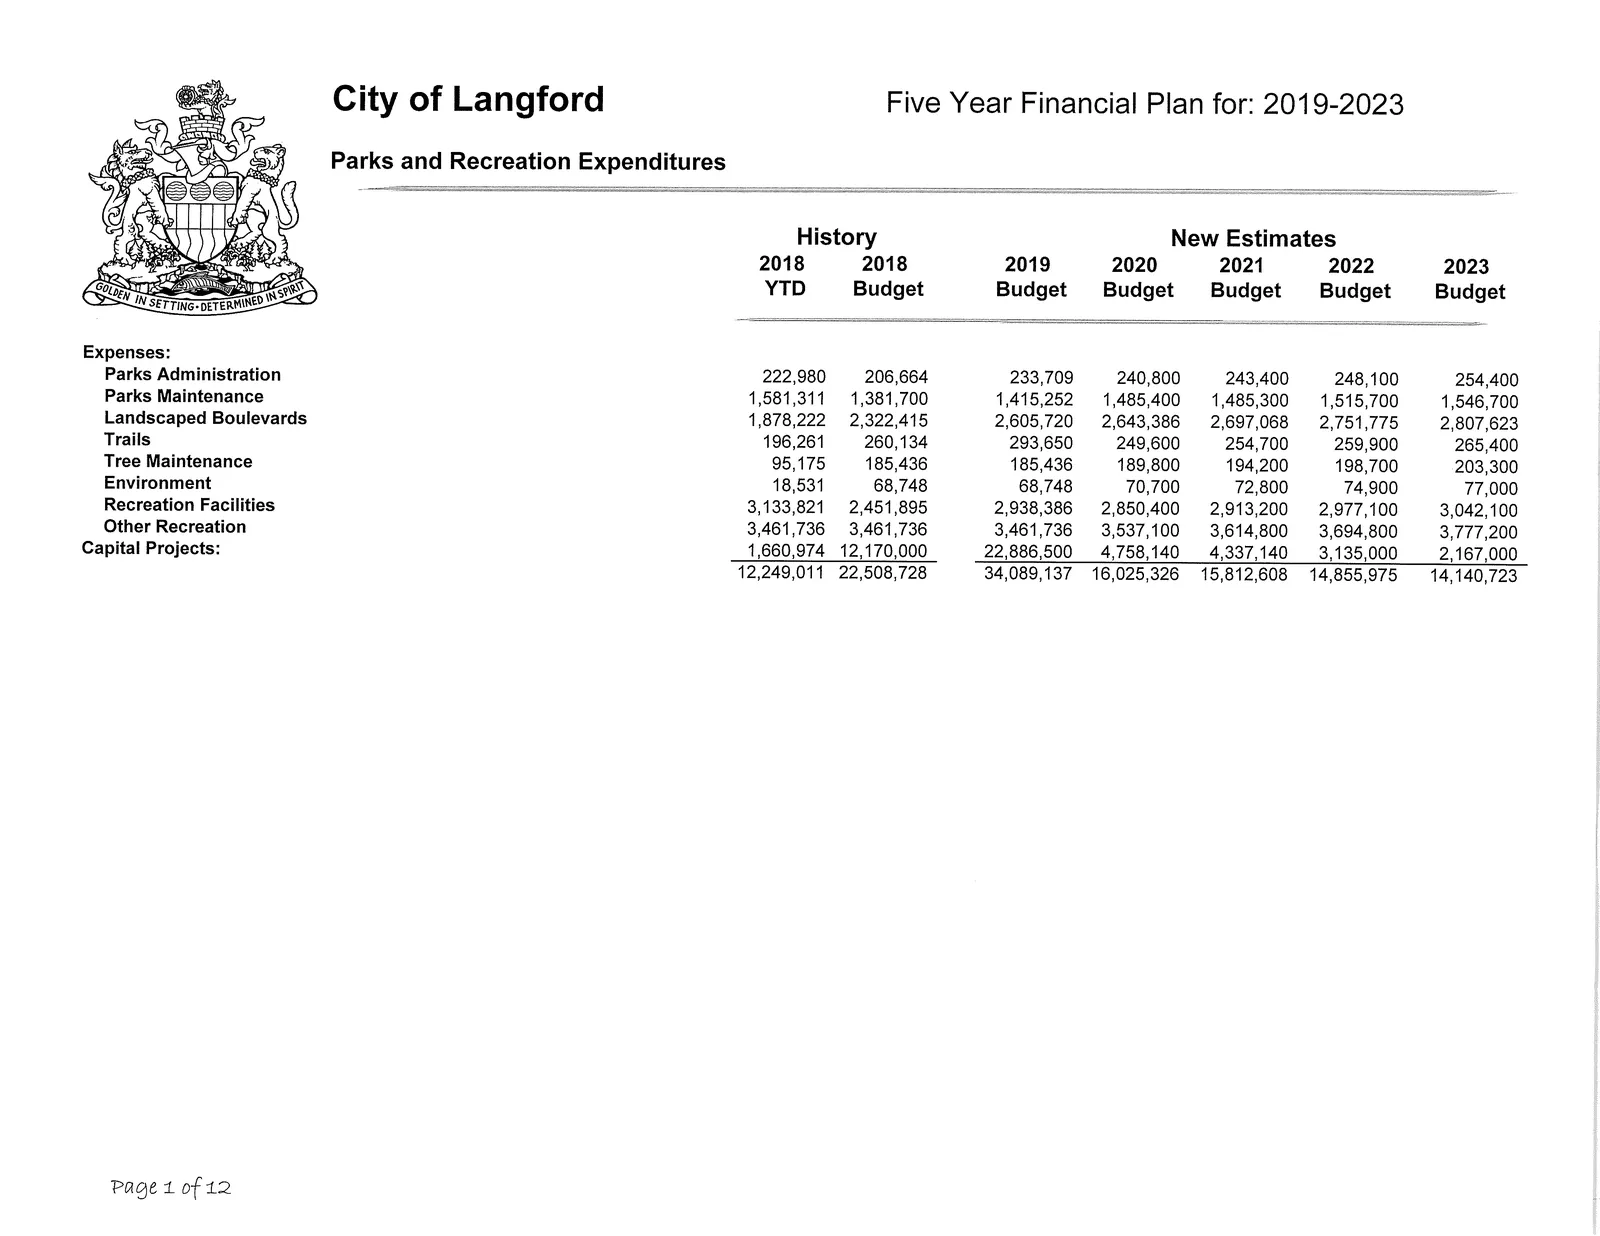
Parks and Recreation Expenditures
Summary (Major Categories)
| Category | 2018 YTD | 2018 Budget | 2019 Budget | 2020 Budget | 2021 Budget | 2022 Budget | 2023 Budget |
|---|---|---|---|---|---|---|---|
| Parks Administration | 222,980 | 206,664 | 233,709 | 240,800 | 243,400 | 248,100 | 254,400 |
| Parks Maintenance | 1,581,311 | 1,381,700 | 1,415,252 | 1,485,400 | 1,485,300 | 1,515,700 | 1,546,700 |
| Landscaped Boulevards | 1,878,222 | 2,322,415 | 2,605,720 | 2,643,386 | 2,697,068 | 2,751,775 | 2,807,623 |
| Trails | 196,261 | 260,134 | 293,650 | 249,600 | 254,700 | 259,900 | 265,400 |
| Tree Maintenance | 95,175 | 185,436 | 185,436 | 189,800 | 194,200 | 198,700 | 203,300 |
| Environment / Natural Areas Management | 18,531 | 68,748 | 68,748 | 70,700 | 72,800 | 74,900 | 77,000 |
| Recreation Facilities | 3,133,821 | 2,451,895 | 2,938,386 | 2,850,400 | 2,913,200 | 2,977,100 | 3,042,100 |
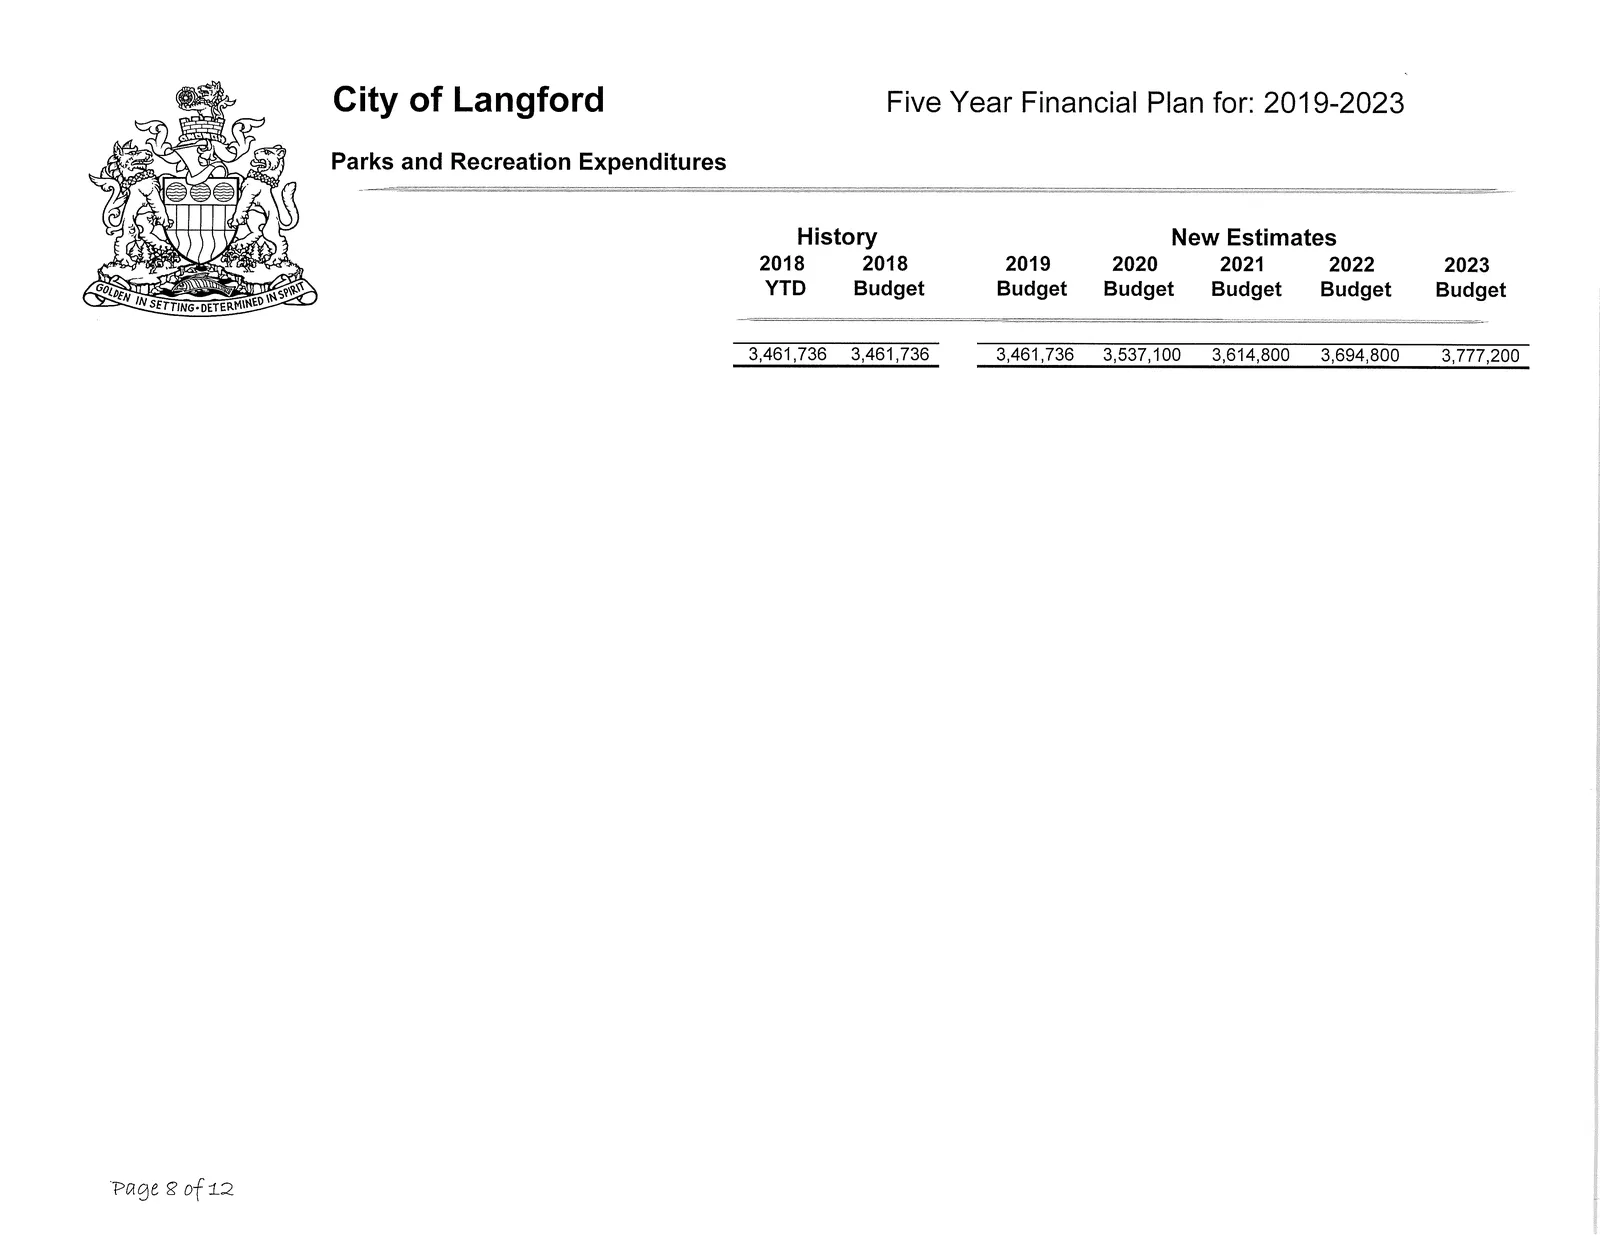
| Other Recreation (West Shore Parks & Rec contract etc.) | 3,461,736 | 3,461,736 | 3,461,736 | 3,537,100 | 3,614,800 | 3,694,800 | 3,777,200 |
| Parks Capital (Total) | 1,660,974 | 12,170,000 | 22,886,500 | 4,758,140 | 4,337,140 | 3,135,000 | 2,167,000 |
Total Recreation Capital and Projects totals appear with larger aggregated totals in the schedule.
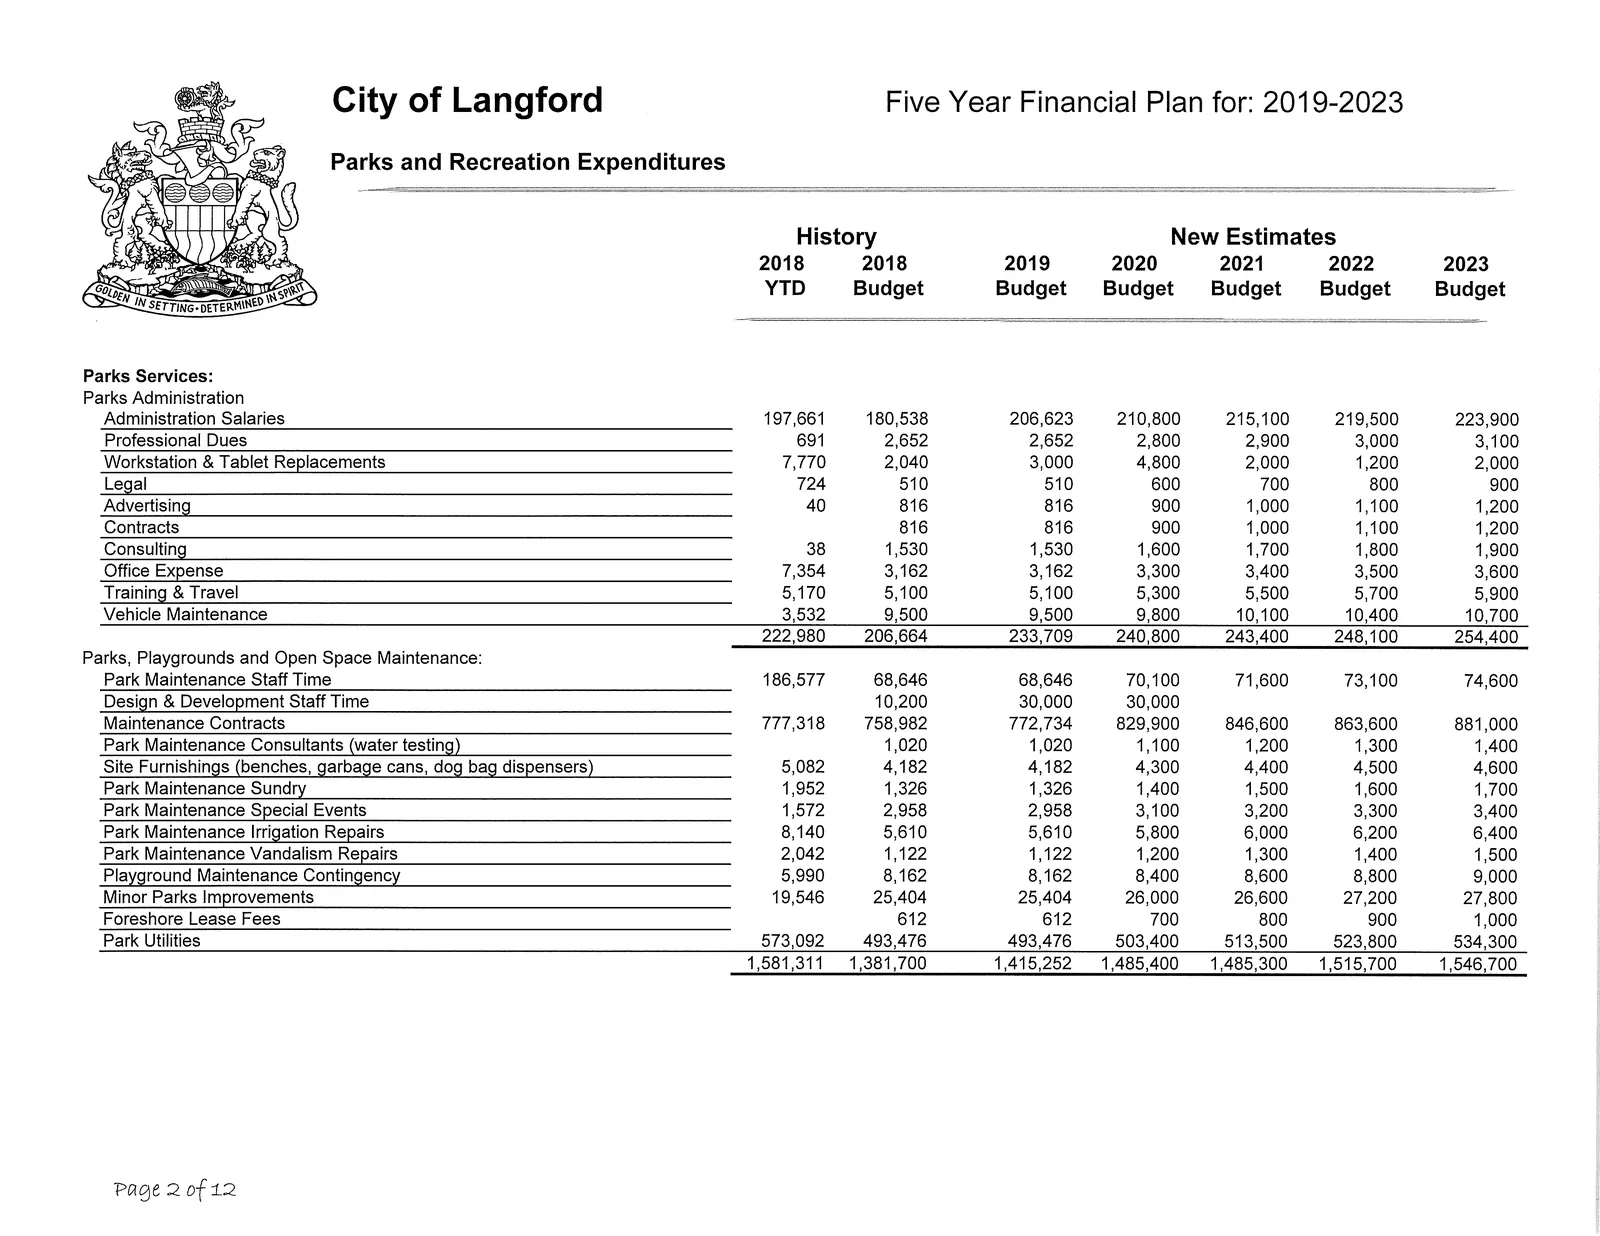
Parks Services - Selected Details
- Administration Salaries: 197,661 (2018 YTD) increasing to 223,900 (2023)
- Park Utilities: 573,092 (2018 YTD); 493,476 (2018 budget) rising to 534,300 (2023)
- Maintenance Contracts: 777,318 (2018 YTD); ongoing contract allocations shown
- Minor Parks Improvements: 19,546 (2018 YTD); 25,404 (2018 budget) rising to 27,800 (2023)
- Playground Maintenance Contingency: 5,990 (2018 YTD); 8,162 (2018 budget) rising to 9,000 (2023)
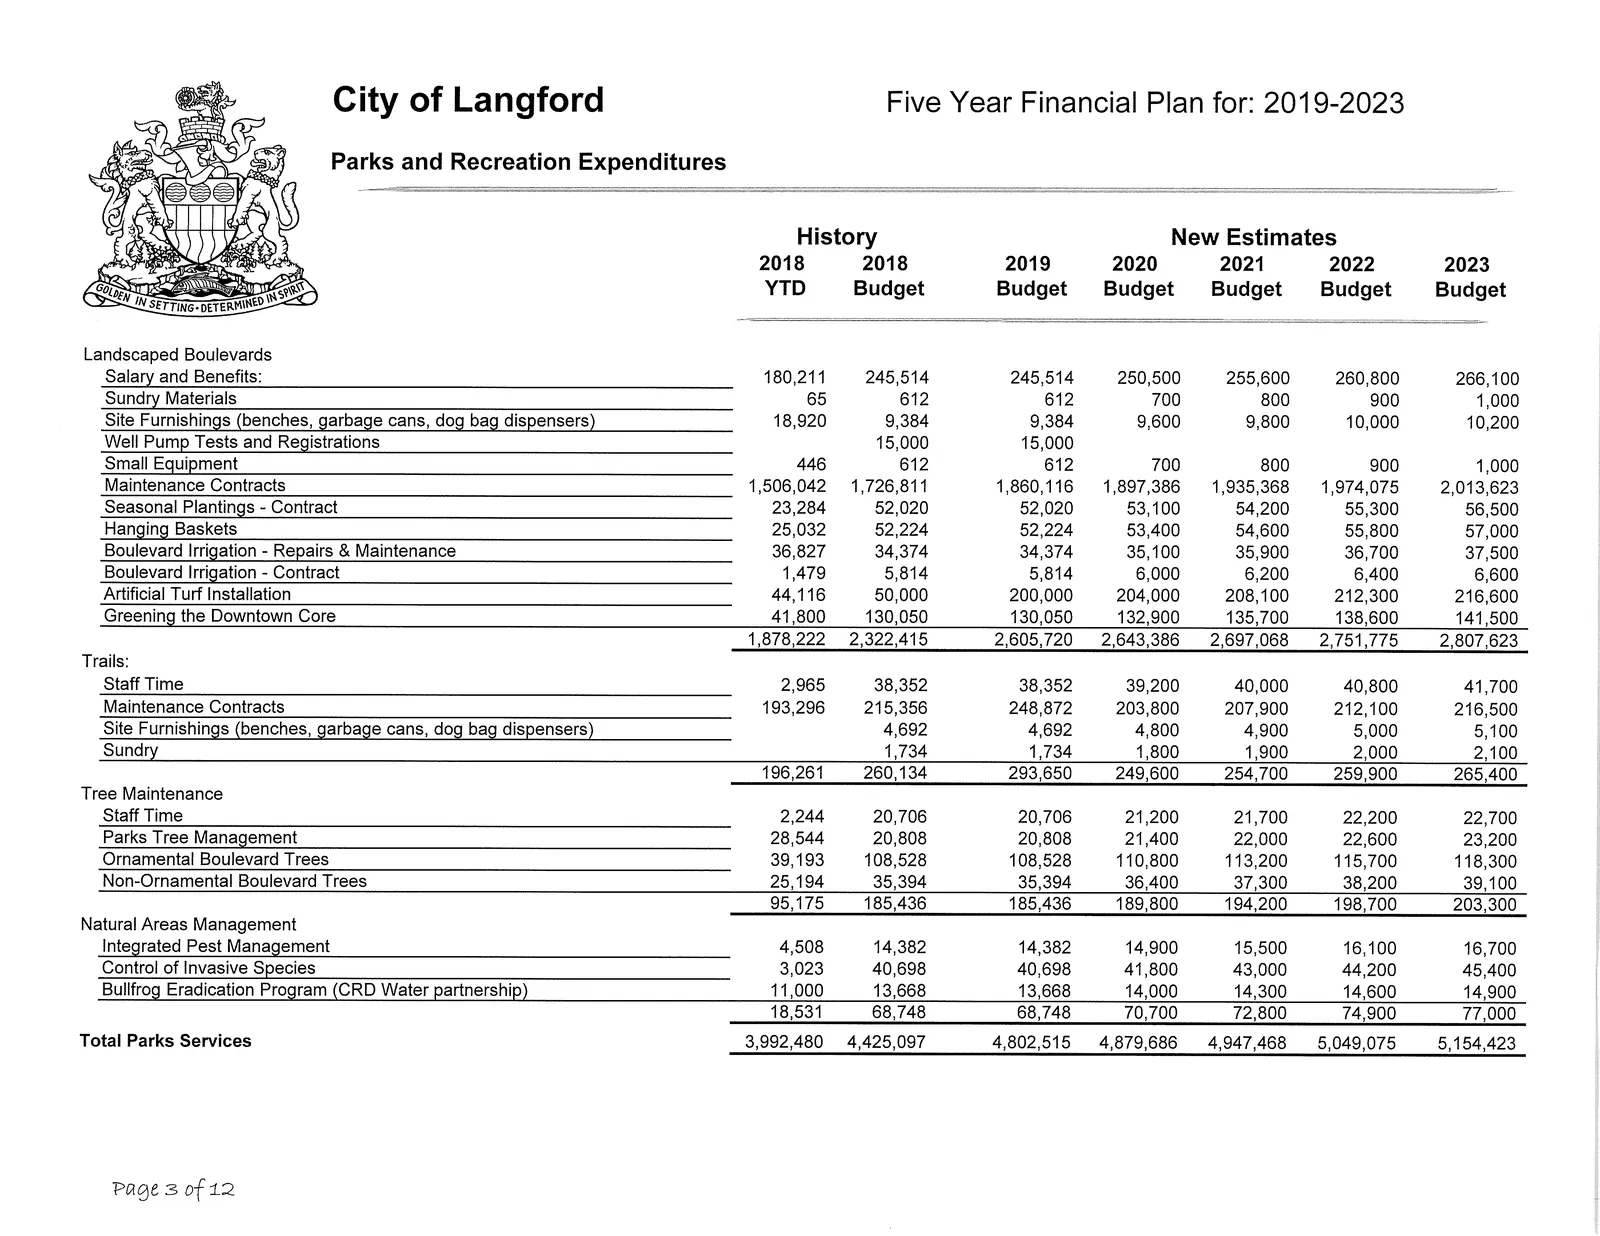
Landscaped Boulevards - Selected Details
- Salary and Benefits: 180,211 (2018 YTD) to 266,100 (2023)
- Maintenance Contracts (boulevards): 1,506,042 (2018 YTD) to 2,013,623 (2023)
- Seasonal Plantings - Contract: 23,284 (2018 YTD) to 56,500 (2023)
- Artificial Turf Installation: 44,116 (2018 YTD) then 50,000 (2019) and 200,000 (2020) etc.
- Greening the Downtown Core: 41,800 (2018 YTD) to 141,500 (2023)
Trails, Tree Maintenance and Natural Areas Management (Selected)
- Trails Total: 196,261 (2018 YTD) to 265,400 (2023)
- Tree Maintenance total: 95,175 (2018 YTD) to 203,300 (2023)
- Integrated Pest Management, Control of Invasive Species, Bullfrog Eradication Program: totals shown under Natural Areas Management with increases to 77,000 (2023)
Total Parks Services (aggregate): 3,992,480 (2018 YTD) rising to 5,154,423 (2023)
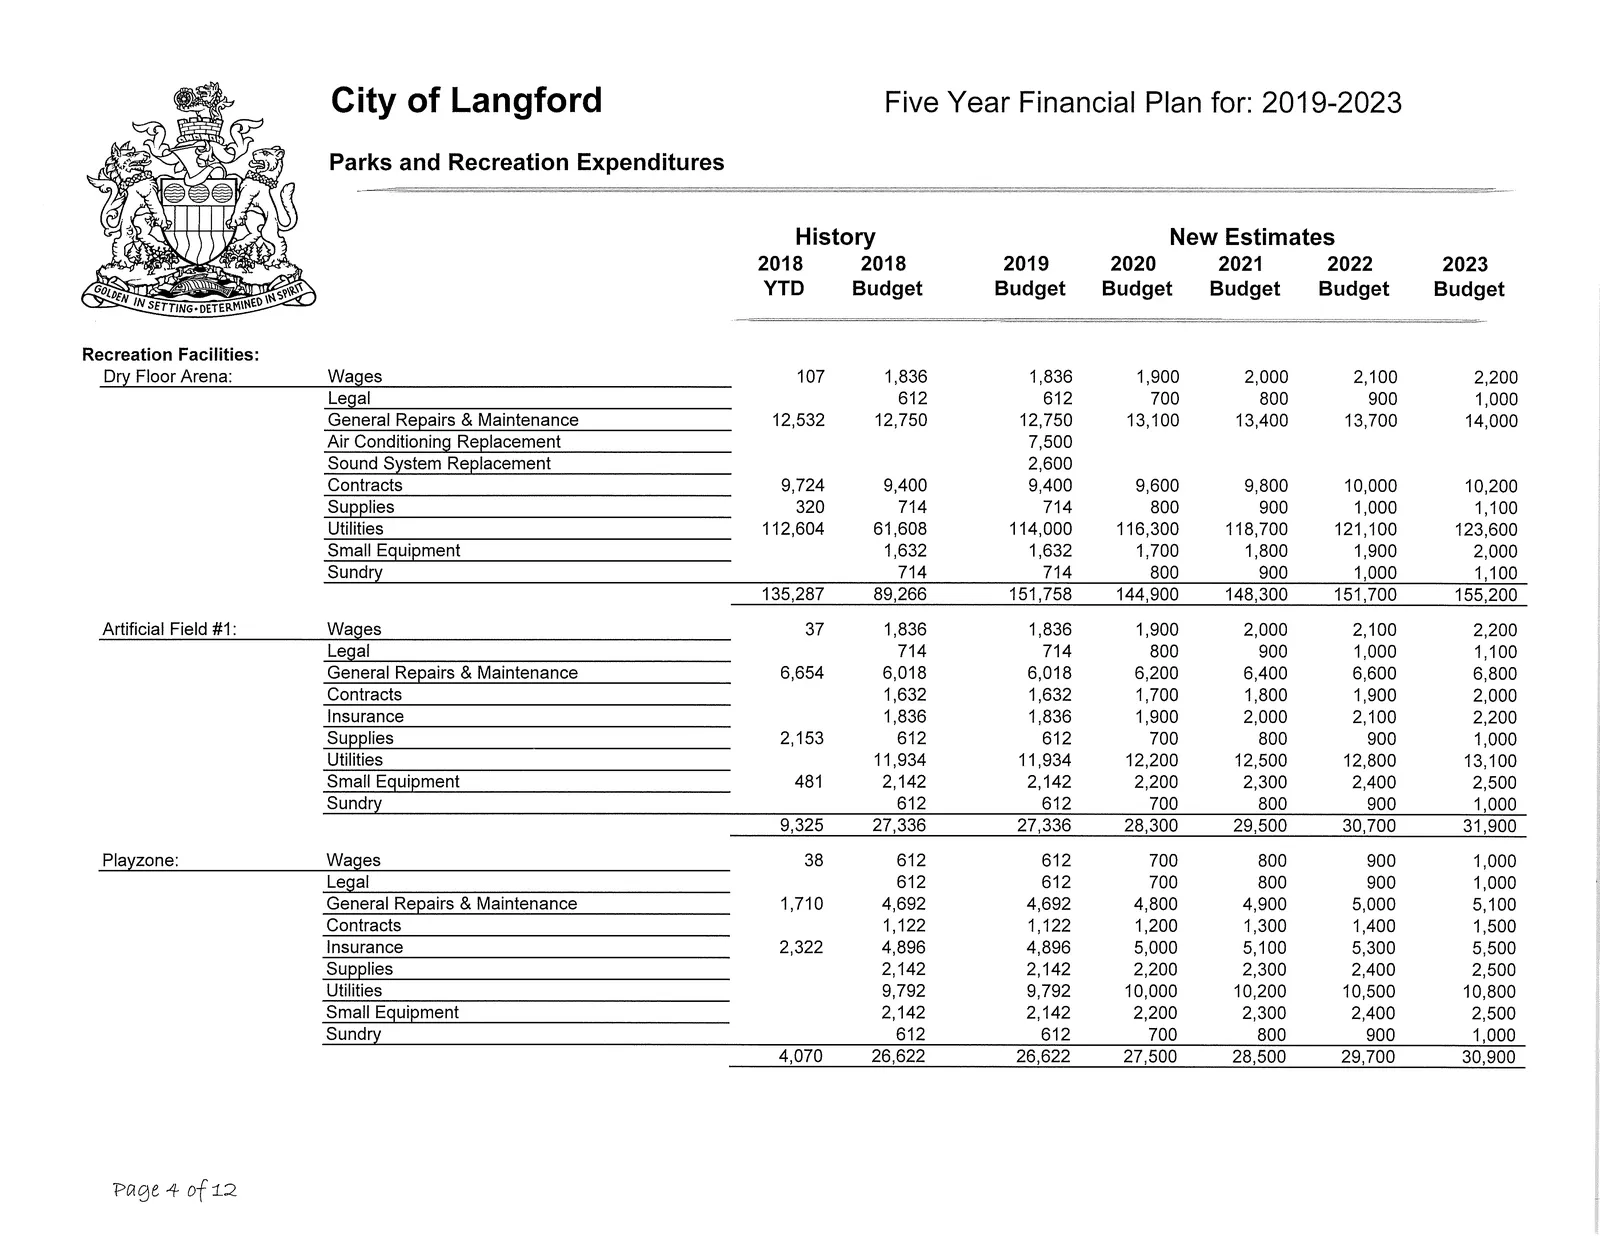
Recreation Facilities - Selected Facility Budgets
(Recreation Facilities total and per-facility operating lines are shown; selected items below.)
- Dry Floor Arena - Total: 135,287 (2018 YTD) → 155,200 (2023)
- Artificial Field #1 - Total: 9,325 (2018 YTD) → 31,900 (2023)
- Playzone - Total: 4,070 (2018 YTD) → 30,900 (2023)
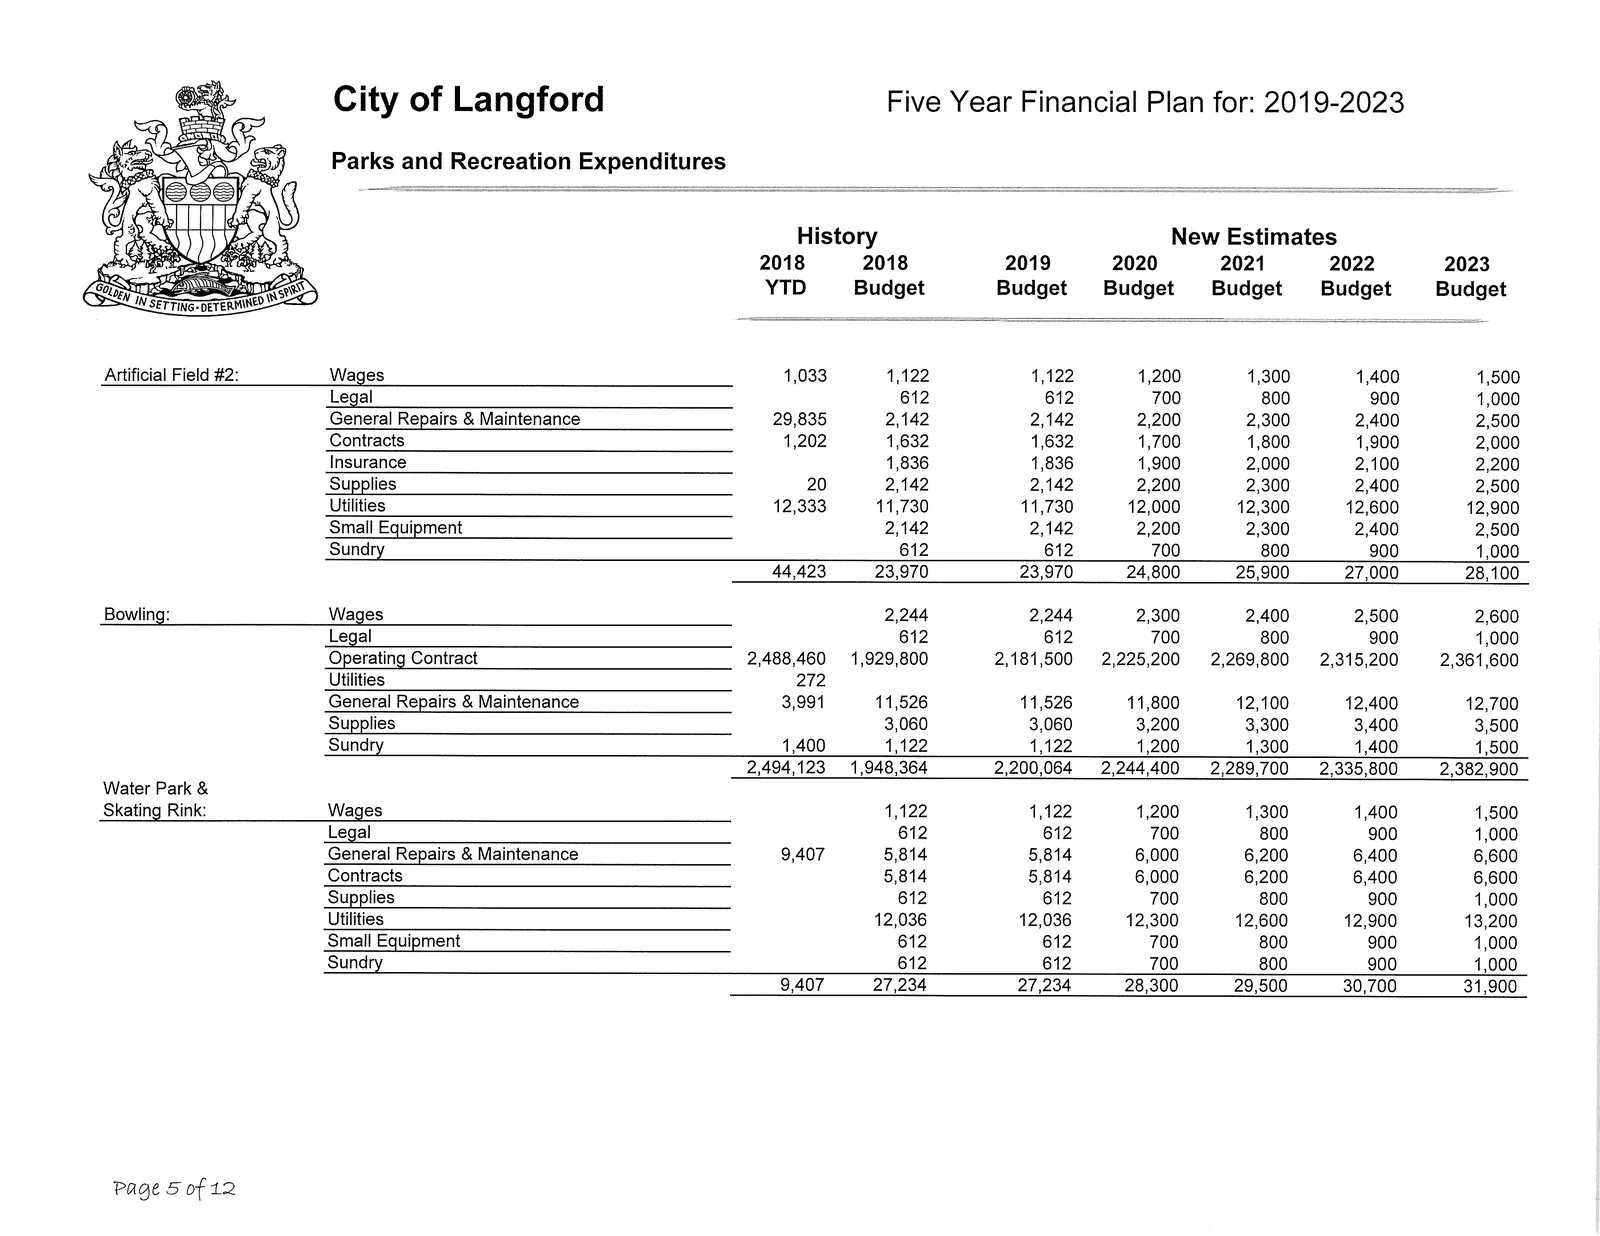
- Artificial Field #2 - Total: 44,423 (2018 YTD) → 28,100 (2023)
- Bowling (operating contract) - Operating Contract: 2,488,460 (2018 YTD); Bowling total 2,494,123 (2018 YTD) → 2,382,900 (2023)
- Water Park & Skating Rink - Total: 9,407 (2018 YTD) → 31,900 (2023)
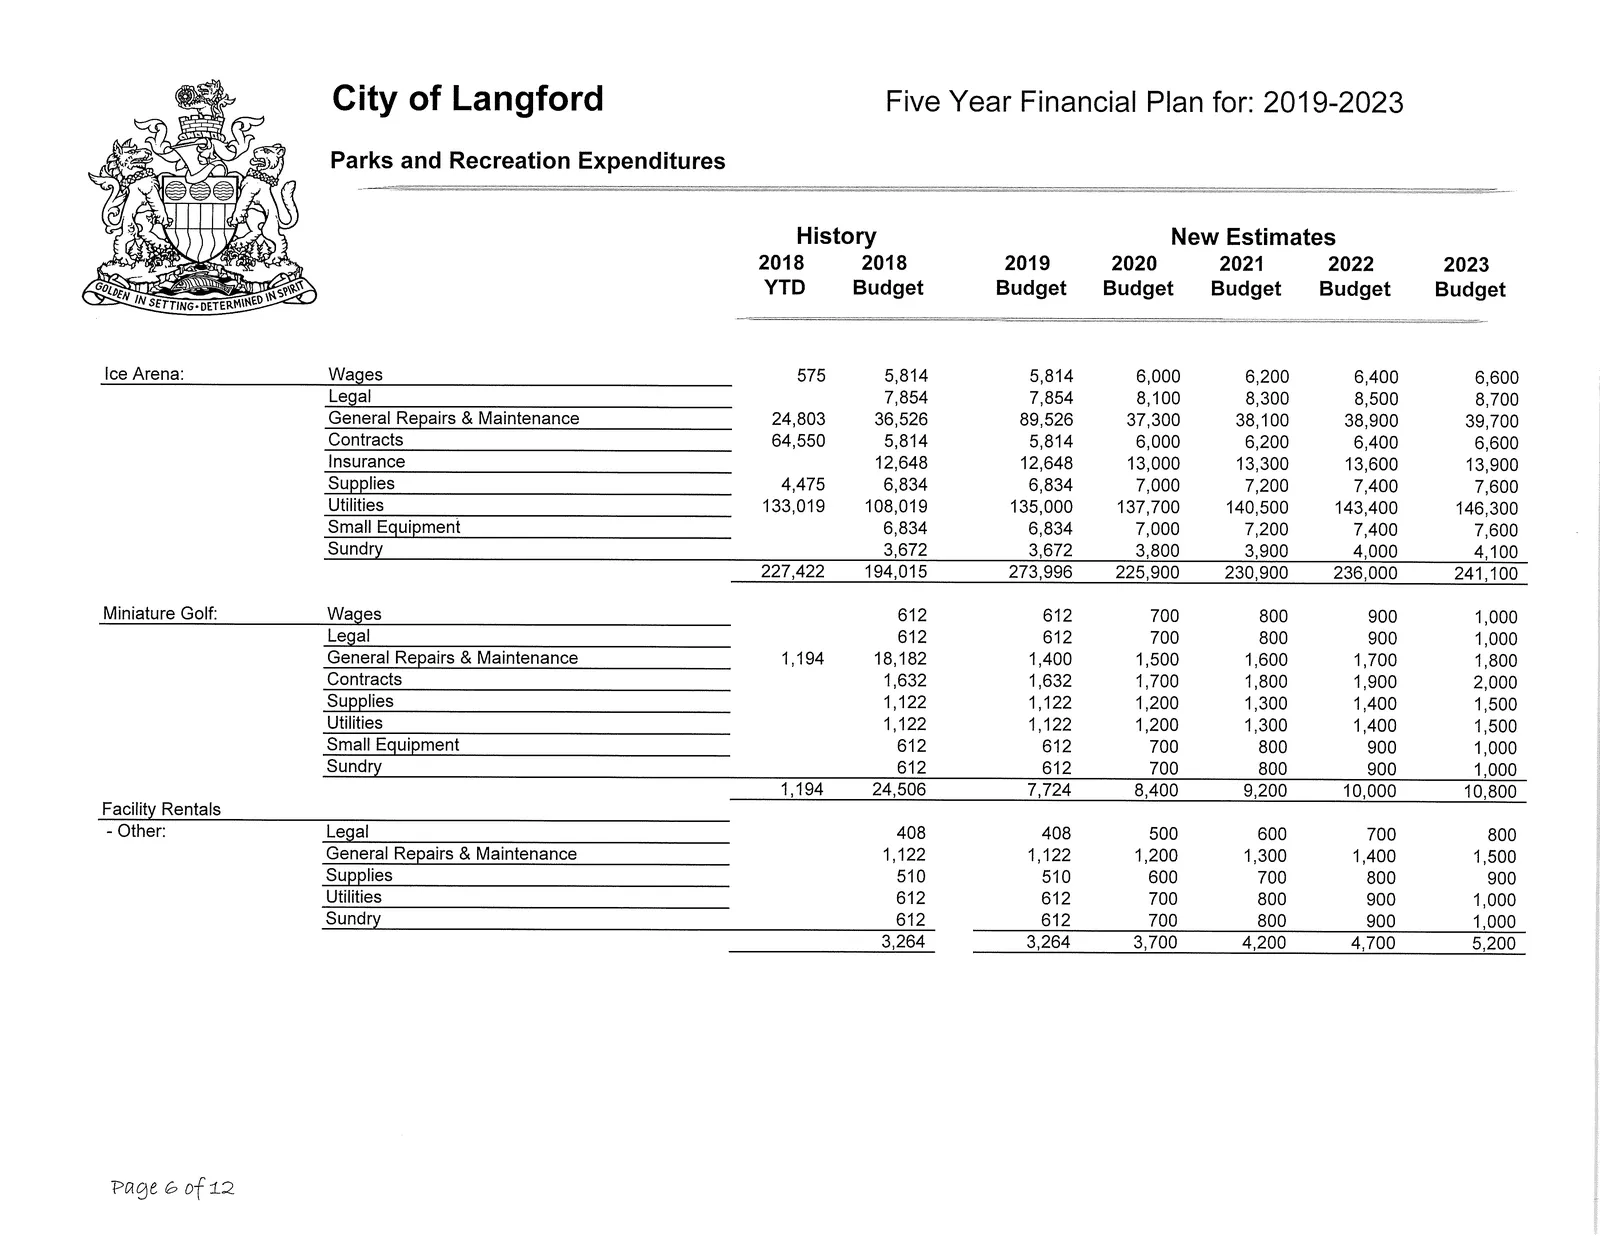
- Ice Arena - Total: 227,422 (2018 YTD) → 241,100 (2023)
- Miniature Golf - Total: 1,194 (2018 YTD) → 10,800 (2023)
- Facility Rentals - Other - Total: 3,264 (2018 YTD) → 5,200 (2023)
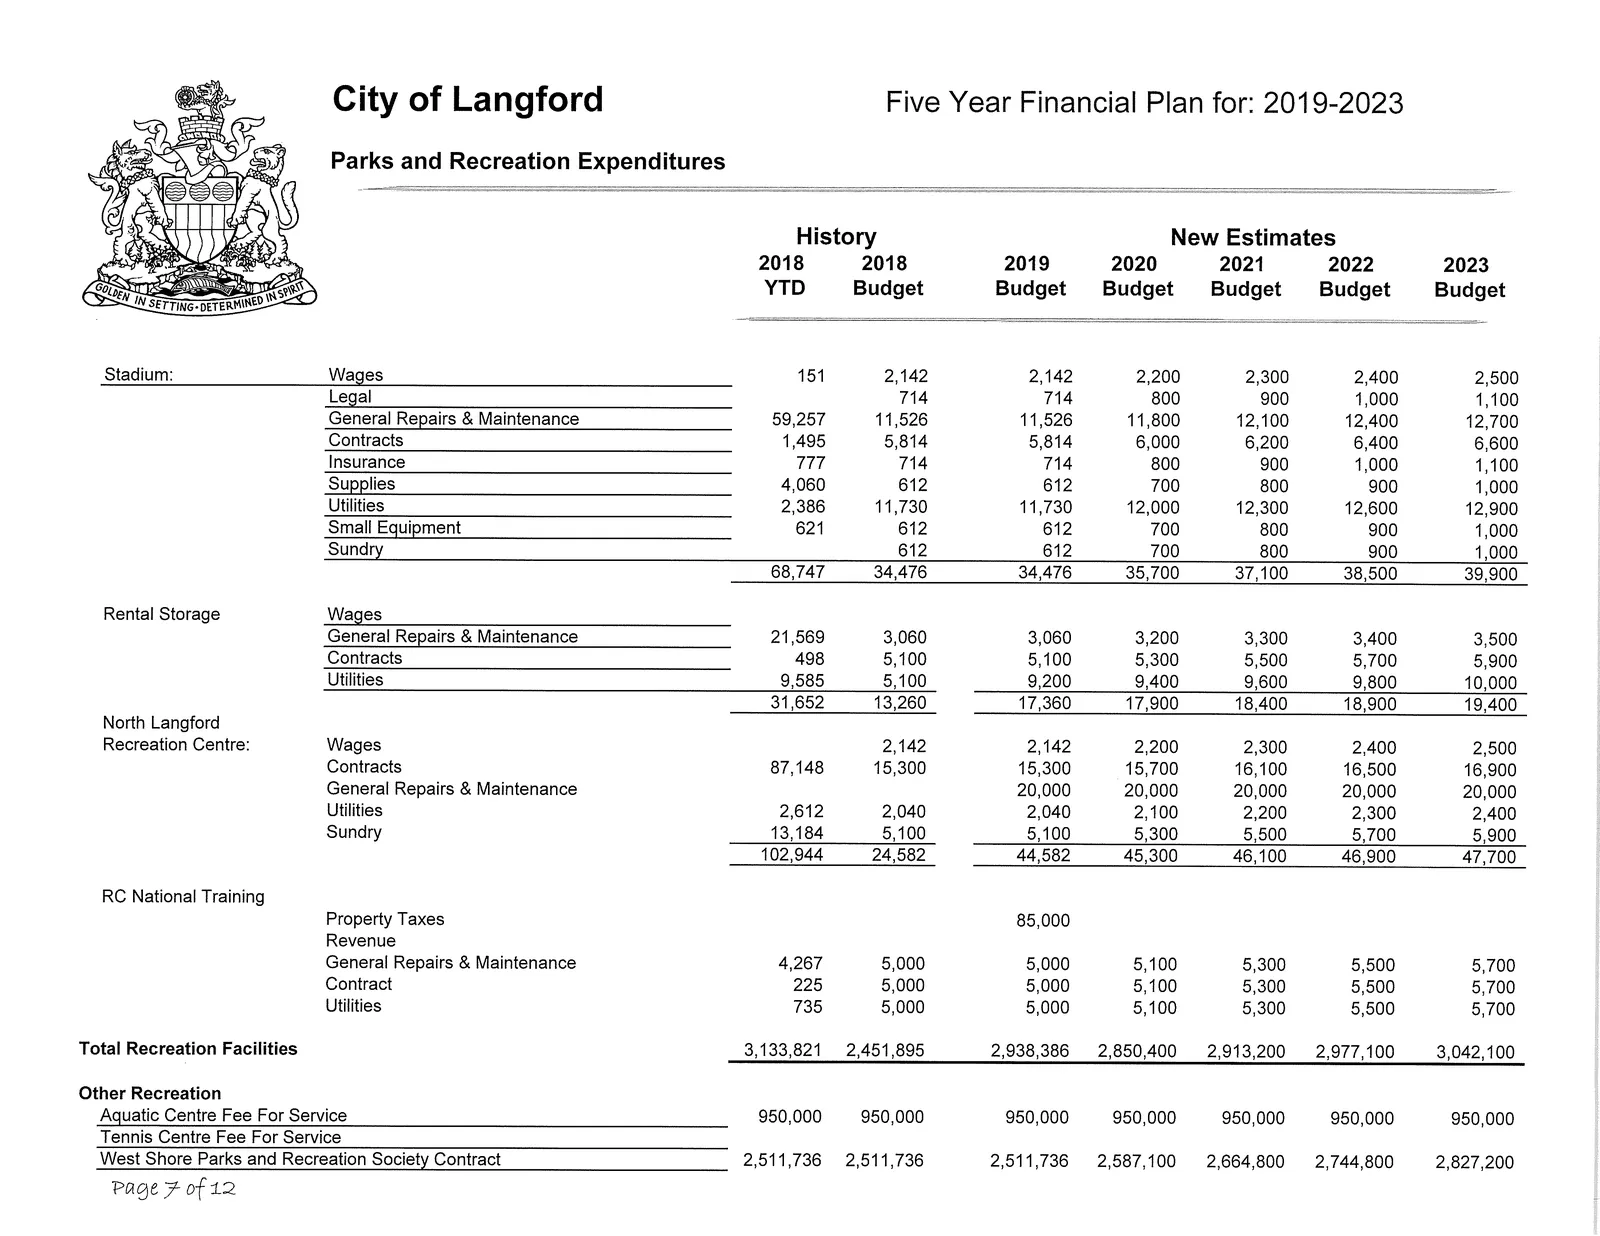
- Stadium - Total: 68,747 (2018 YTD) → 39,900 (2023)
- Rental Storage - Total: 31,652 (2018 YTD) → 19,400 (2023)
- North Langford Recreation Centre - Total: 102,944 (2018 YTD) → 47,700 (2023)
Total Recreation Facilities: 3,133,821 (2018 YTD) → 3,042,100 (2023)
Other Recreation (Fee for Service / Contracts)
- Aquatic Centre Fee For Service: 950,000 (annual)
- West Shore Parks and Recreation Society Contract: 2,511,736 (2018) rising to 2,827,200 (2023)
- Other total: 3,461,736 (2018 YTD) → 3,777,200 (2023)
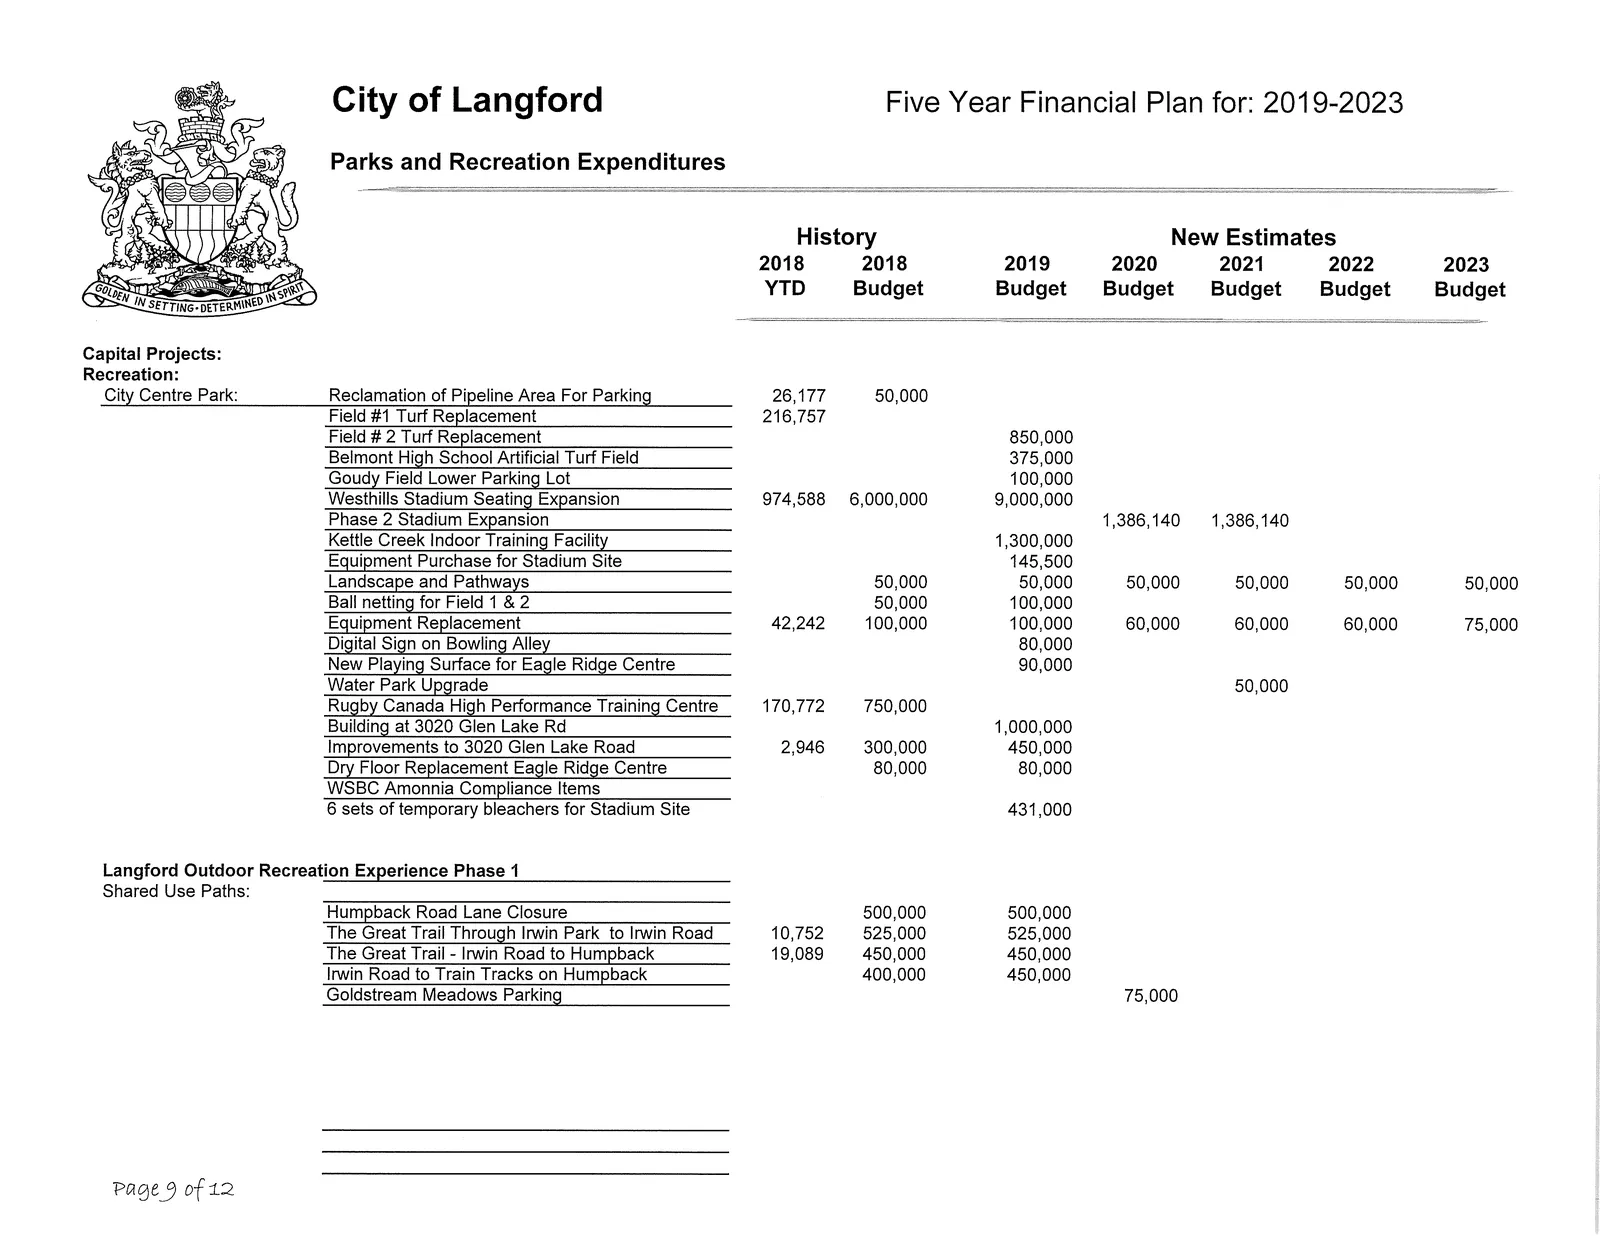
Parks Capital - Selected Projects (City Centre Park / CCP and Others)
Selected CCP and recreation capital projects and amounts:
- CCP - Reclamation of Pipeline Area For Parking: 26,177 (2018 YTD); 50,000 (2019)
- CCP - Field #1 Turf Replacement: 216,757
- CCP - Field #2 Turf Replacement: 850,000
- CCP - Belmont High School Artificial Turf Field: 375,000
- CCP - Goudy Field Lower Parking Lot: 100,000
- CCP - Westhills Stadium Seating Expansion: 974,588 (2018 YTD); 6,000,000 (2020); 9,000,000 (2021) (various phases)
- CCP - Phase 2 Stadium Expansion: 1,386,140
- CCP - Kettle Creek Indoor Training Facility: 1,300,000
- CCP - Equipment Purchase for Stadium Site: 145,500
- CCP - Ball netting for Field 1 & 2: 50,000 / 100,000
- CCP - Equipment Replacement: various (e.g., 42,242; 100,000)
- CCP - Digital Sign on Bowling Alley: 80,000
- New Playing Surface for Eagle Ridge Centre: 90,000
- Water Park Upgrade: 50,000
- Rugby Canada High Performance Training Centre: 170,772; 750,000 (phases)
- Building at 3020 Glen Lake Rd: 1,000,000
- Improvements to 3020 Glen Lake Road: 300,000 / 450,000
- Dry Floor Replacement Eagle Ridge Centre: 80,000
- 6 sets of temporary bleachers for Stadium Site: 431,000
Shared Use Paths and Trails projects (selected):
- Humpback Road Lane Closure: 500,000
- The Great Trail Through Irwin Park to Irwin Road: 525,000
- The Great Trail - Irwin Road to Humpback: 450,000
- Irwin Road to Train Tracks on Humpback: 400,000–450,000
- Goldstream Meadows Parking: 75,000
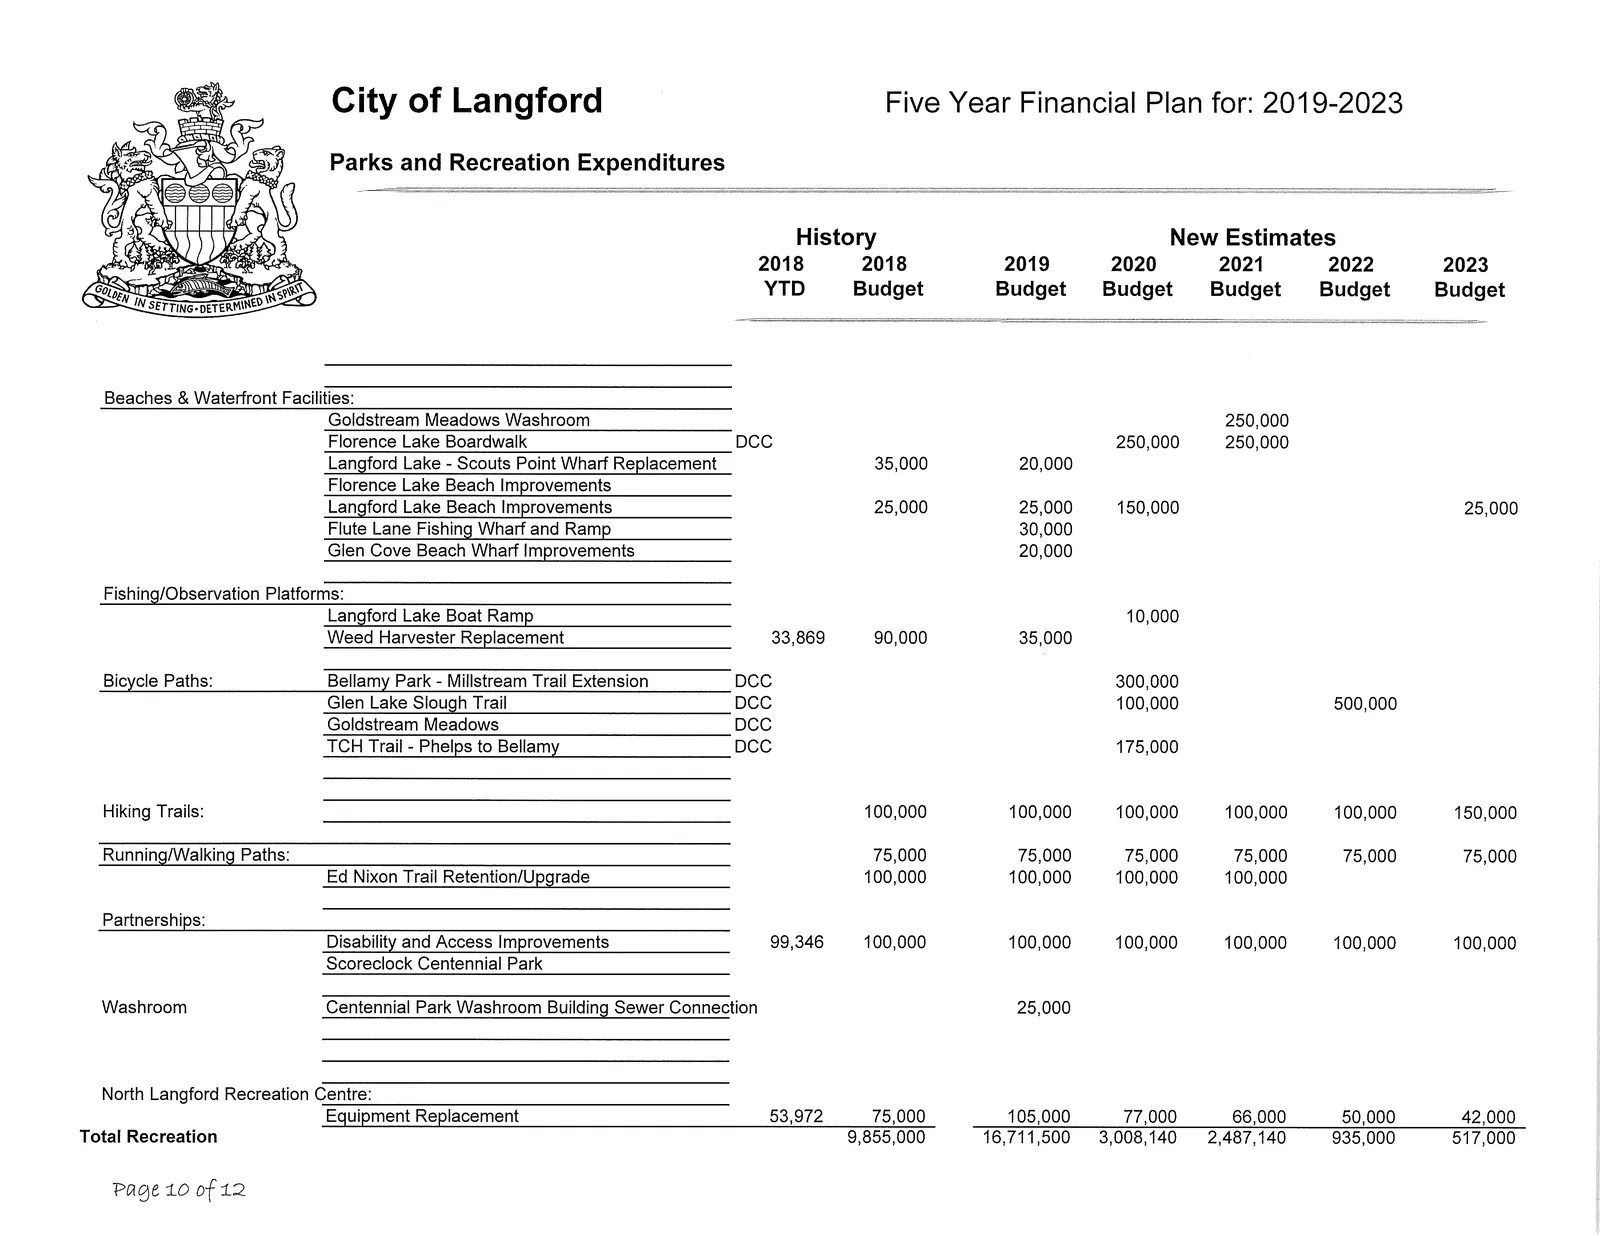
Beaches & Waterfront Facilities (selected):
- Goldstream Meadows Washroom: 250,000
- Florence Lake Boardwalk: 250,000
- Langford Lake - Scouts Point Wharf Replacement: 35,000
- Florence Lake Beach Improvements: amounts shown
- Langford Lake Beach Improvements: 150,000 (selected)
- Flute Lane Fishing Wharf and Ramp: 30,000
- Glen Cove Beach Wharf Improvements: 20,000
- Langford Lake Boat Ramp: 10,000
- Weed Harvester Replacement: 33,869 / 90,000 / 35,000 / 300,000 (various years)
Bicycle Paths and Trails (selected):
- Bellamy Park - Millstream Trail Extension: DCC amounts listed
- Glen Lake Slough Trail: DCC amounts
- Goldstream Meadows: DCC
- TCH Trail - Phelps to Bellamy: DCC; 175,000 (selected)
- Ed Nixon Trail Retention/Upgrade: 100,000 (selected annual amounts)
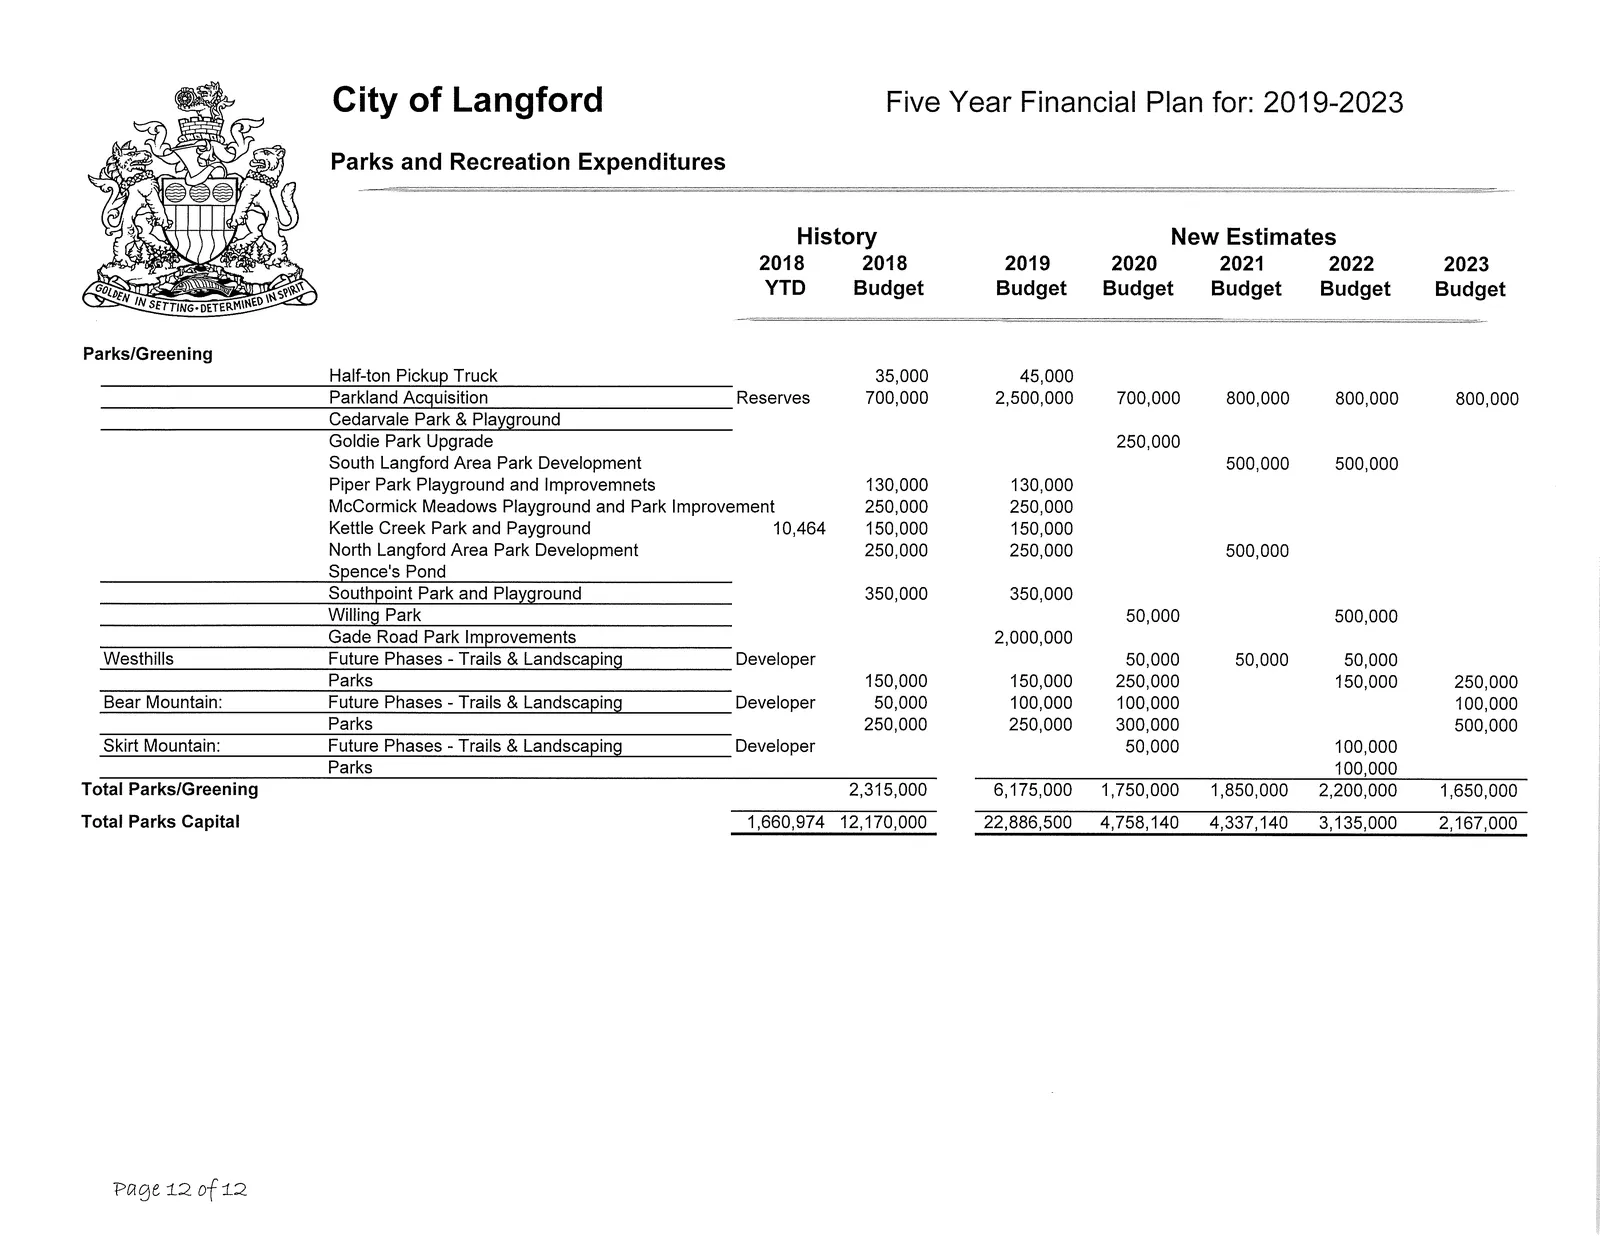
Parks/Greening and Parkland Acquisition:
- Half-ton Pickup Truck: 35,000 (2018 YTD) → 45,000 (2020)
- Parkland Acquisition - Reserves: 700,000 (2019), 2,500,000 (2020), 700,000 (2021), 800,000 (2022–2023)
- Cedarvale Park & Playground, Goldie Park Upgrade, South Langford Area Park Development, Piper Park Playground, McCormick Meadows Playground, Kettle Creek Park and Playground, North Langford Area Park Development, Spence's Pond, Southpoint Park and Playground, Willing Park, Gade Road Park Improvements, Westhills and Bear Mountain future phases: multiple amounts shown (selected totals)
- Total Parks/Greening: 2,315,000 (2019) → 1,650,000 (2023) across years
Total Parks Capital (aggregate): 1,660,974 (2018) → 12,170,000 (2019) → 22,886,500 (2020) → 4,758,140 (2021) → 4,337,140 (2022) → 3,135,000 (2023) → 2,167,000 (2024? shown)
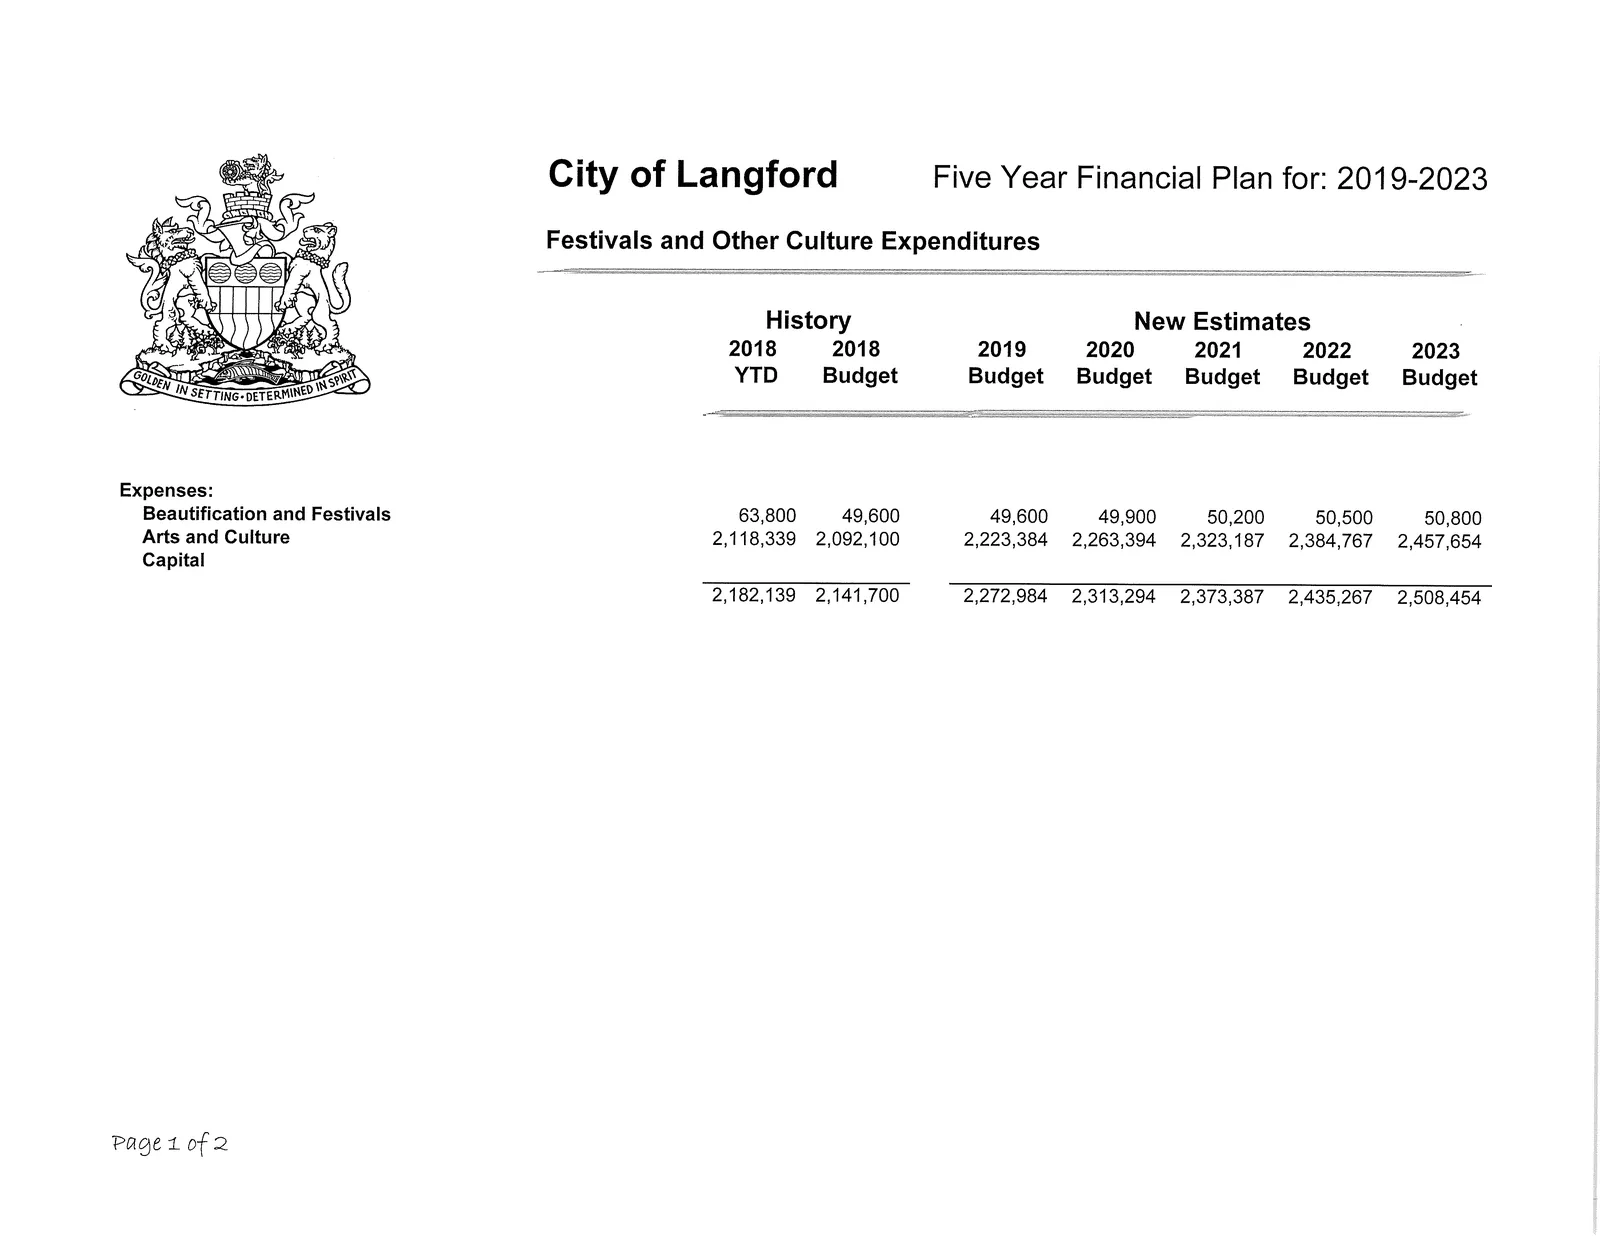
Festivals and Other Culture Expenditures
Summary (History / New Estimates)
| Category | 2018 YTD | 2018 Budget | 2019 Budget | 2020 Budget | 2021 Budget | 2022 Budget | 2023 Budget |
|---|---|---|---|---|---|---|---|
| Festivals | 63,800 | 49,600 | 49,600 | 49,900 | 50,200 | 50,500 | 50,800 |
| Arts and Culture (Total) | 2,118,339 | 2,092,100 | 2,223,384 | 2,263,394 | 2,323,187 | 2,384,767 | 2,457,654 |
| Festivals & Other Culture - Total | 2,182,139 | 2,141,700 | 2,272,984 | 2,313,294 | 2,373,387 | 2,435,267 | 2,508,454 |
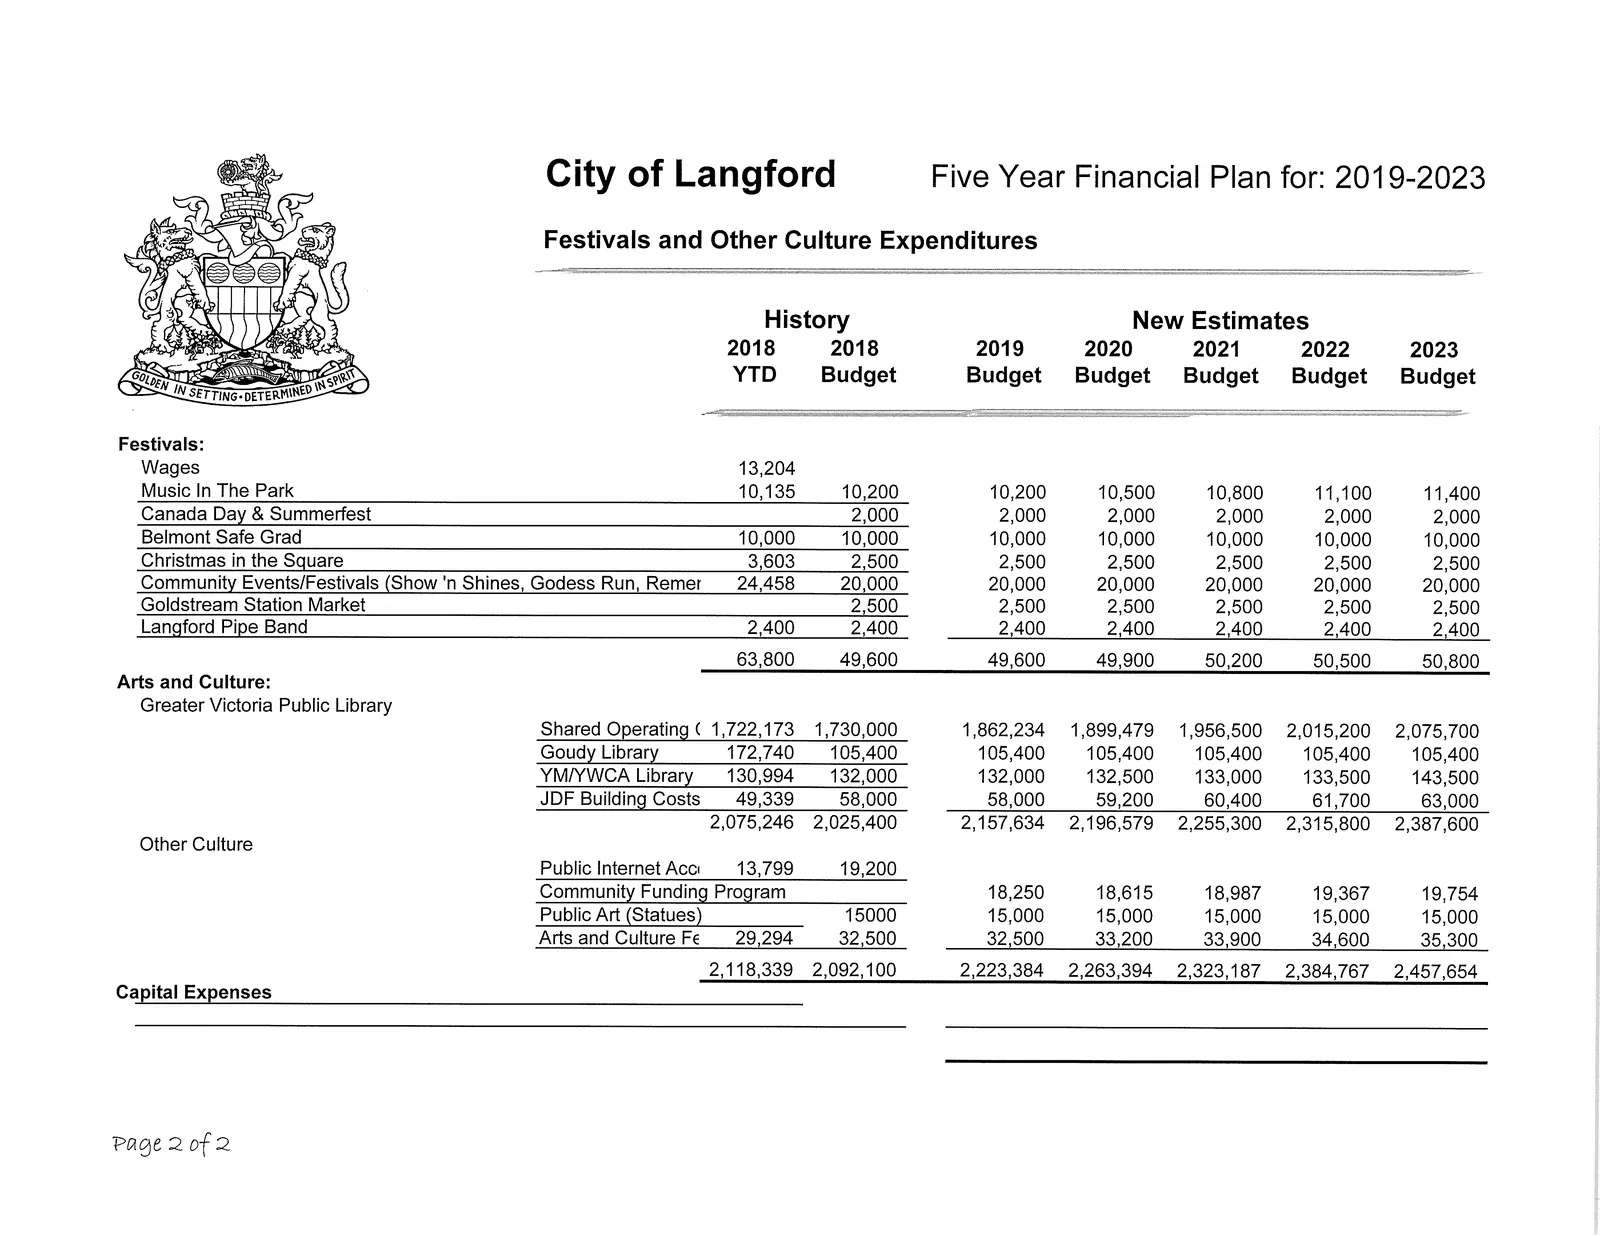
Festivals - Selected Items
- Music In The Park: 10,135 (2018 YTD) → 11,400 (2023)
- Canada Day & Summerfest: 2,000 annually
- Belmont Safe Grad: 10,000 annually
- Christmas in the Square: 3,603 (2018 YTD) → 2,500 annual allocs
- Community Events/Festivals (Show 'n Shines, Goddess Run, Remembrance events): 24,458 (2018 YTD) → 20,000 annual
- Goldstream Station Market: 2,500 annually
- Langford Pipe Band: 2,400 annually
Arts and Culture - Selected Items
- Greater Victoria Public Library (Shared Operating): 1,722,173 (2018 YTD) → 2,075,700 (2023)
- Goudy Library: 172,740 (2018) → 105,400 (2019–2023 shown)
- YMNWCA Library: 130,994 (2018) → 143,500 (2023)
- JDF Building Costs: 49,339 (2018) → 63,000 (2023)
- Community Funding Program, Public Art (Statues), Public Internet Aco and Arts and Culture FE: amounts shown; totals listed in table above
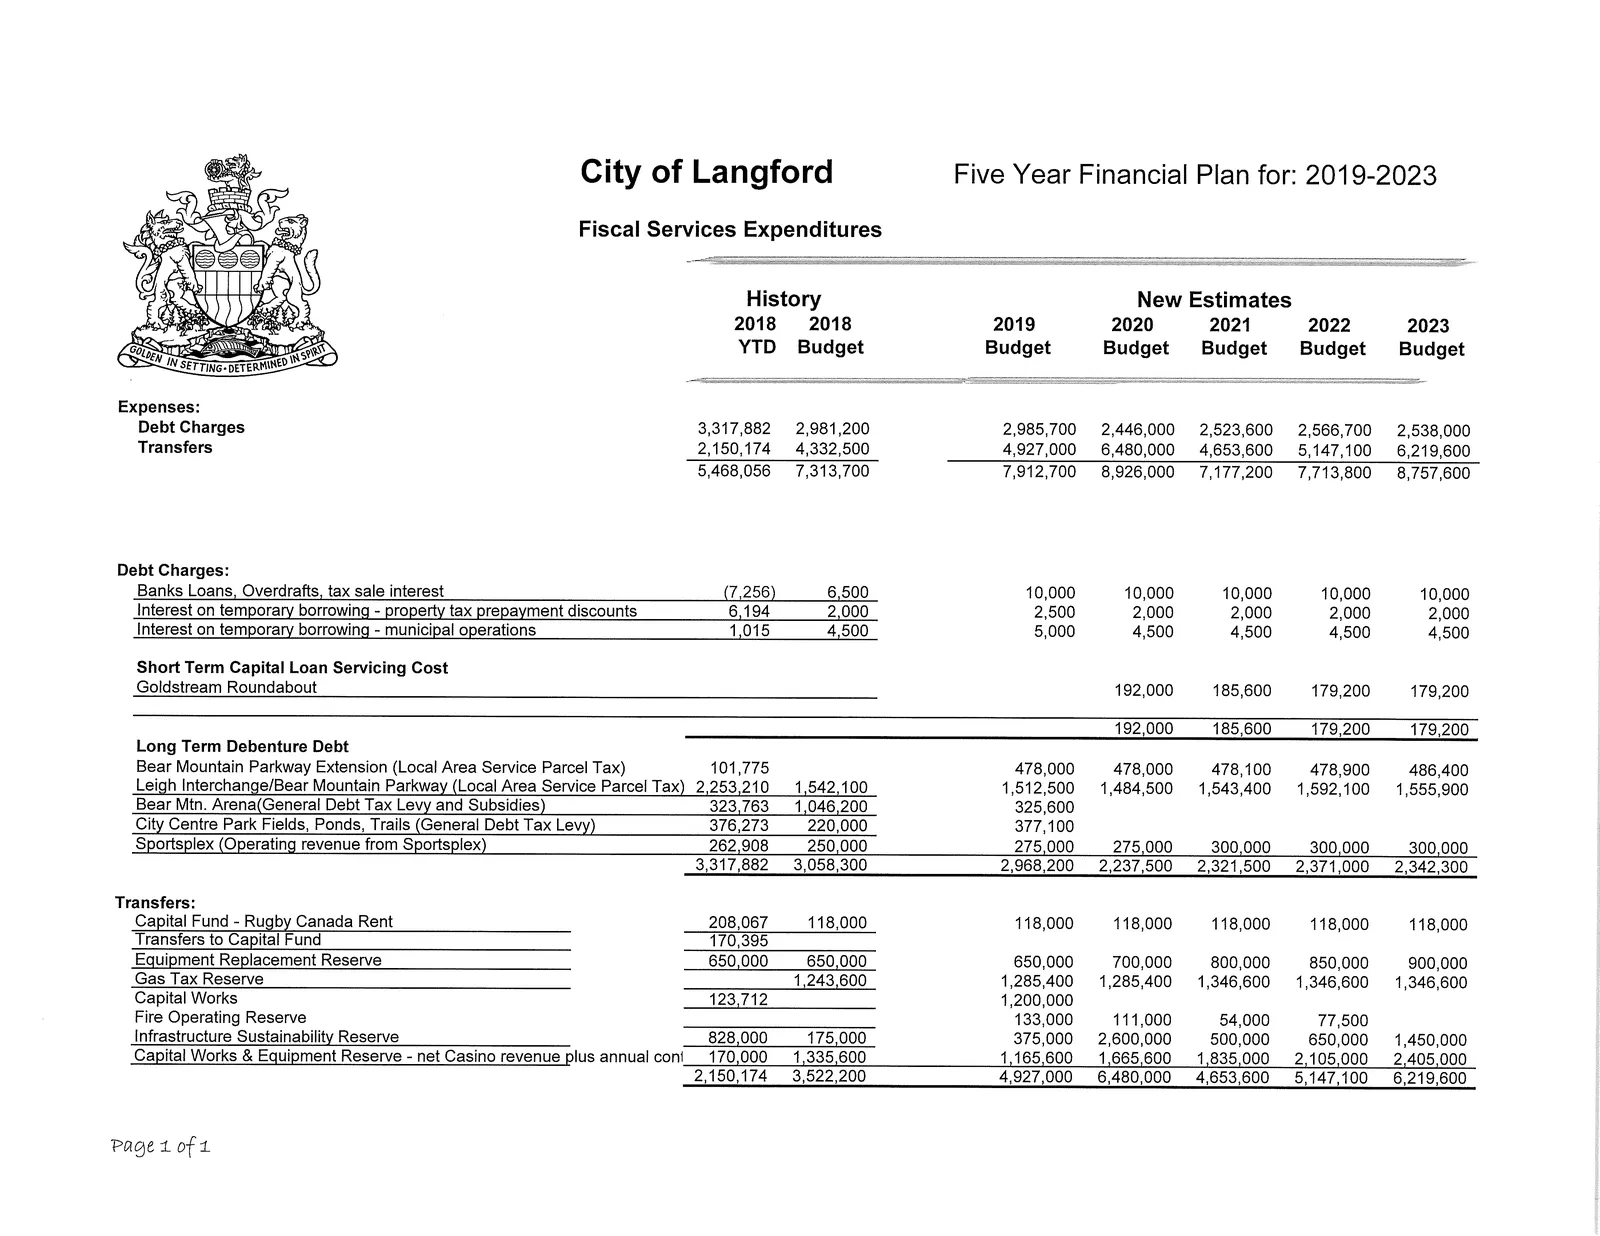
Fiscal Services Expenditures
Summary (History / New Estimates)
| Category | 2018 YTD | 2018 Budget | 2019 Budget | 2020 Budget | 2021 Budget | 2022 Budget | 2023 Budget |
|---|---|---|---|---|---|---|---|
| Debt Charges | 3,317,882 | 2,981,200 | 2,985,700 | 2,446,000 | 2,523,600 | 2,566,700 | 2,538,000 |
| Transfers | 2,150,174 | 4,332,500 | 4,927,000 | 6,480,000 | 4,653,600 | 5,147,100 | 6,219,600 |
| Total Fiscal Services | 5,468,056 | 7,313,700 | 7,912,700 | 8,926,000 | 7,177,200 | 7,713,800 | 8,757,600 |
Debt Charges - Selected Details
- Banks Loans, Overdrafts, tax sale interest: (7,256) (2018 YTD) → budgets: 6,500 / 10,000 etc.
- Interest on temporary borrowing - property tax prepayment discounts: 6,194 (2018 YTD) → budgets 2,000–2,500
- Interest on temporary borrowing - municipal operations: 1,015 (2018 YTD) → budgets 4,500–5,000
- Short Term Capital Loan Servicing Cost (Goldstream Roundabout): 192,000 (2018 YTD); then 185,600, 179,200 (budgeted amounts)
- Long Term Debenture Debt (selected):
- Bear Mountain Parkway Extension (Local Area Service Parcel Tax): 101,775 (2018 YTD) → 478,000 (2019) etc.
- Leigh Interchange/Bear Mountain Parkway (Local Area Service Parcel Tax): 2,253,210 (2018 YTD) → 1,542,100 (2019) etc.
- Bear Mountain Arena (General Debt Tax Levy and Subsidies): 323,763 (2018 YTD) etc.
- City Centre Park Fields, Ponds, Trails (General Debt Tax Levy): 376,273 (2018 YTD) etc.
- Sportsplex (Operating revenue from Sportsplex): 262,908 (2018 YTD) and budgeted repayments
Transfers - Selected Details
- Capital Fund - Rugby Canada Rent: 208,067 (2018 YTD) → 118,000 annually
- Transfers to Capital Fund: 170,395 (2018 YTD)
- Equipment Replacement Reserve: 650,000 (2018) → increases to 900,000 (2023)
- Gas Tax Reserve transfers: 1,243,600 (2018) → 1,346,600 (2023)
- Capital Works contributions: 123,712 (2018 YTD) etc.
- Fire Operating Reserve contributions: 133,000 (2018 YTD) and subsequent smaller amounts
- Infrastructure Sustainability Reserve: 828,000 (2018) and planned contributions in later years
- Capital Works & Equipment Reserve net Casino revenue plus annual contributions: totals shown (e.g., 1,335,600 etc.)
Transfers total by year: 2,150,174 (2018 YTD) → up to 6,219,600 (2023)
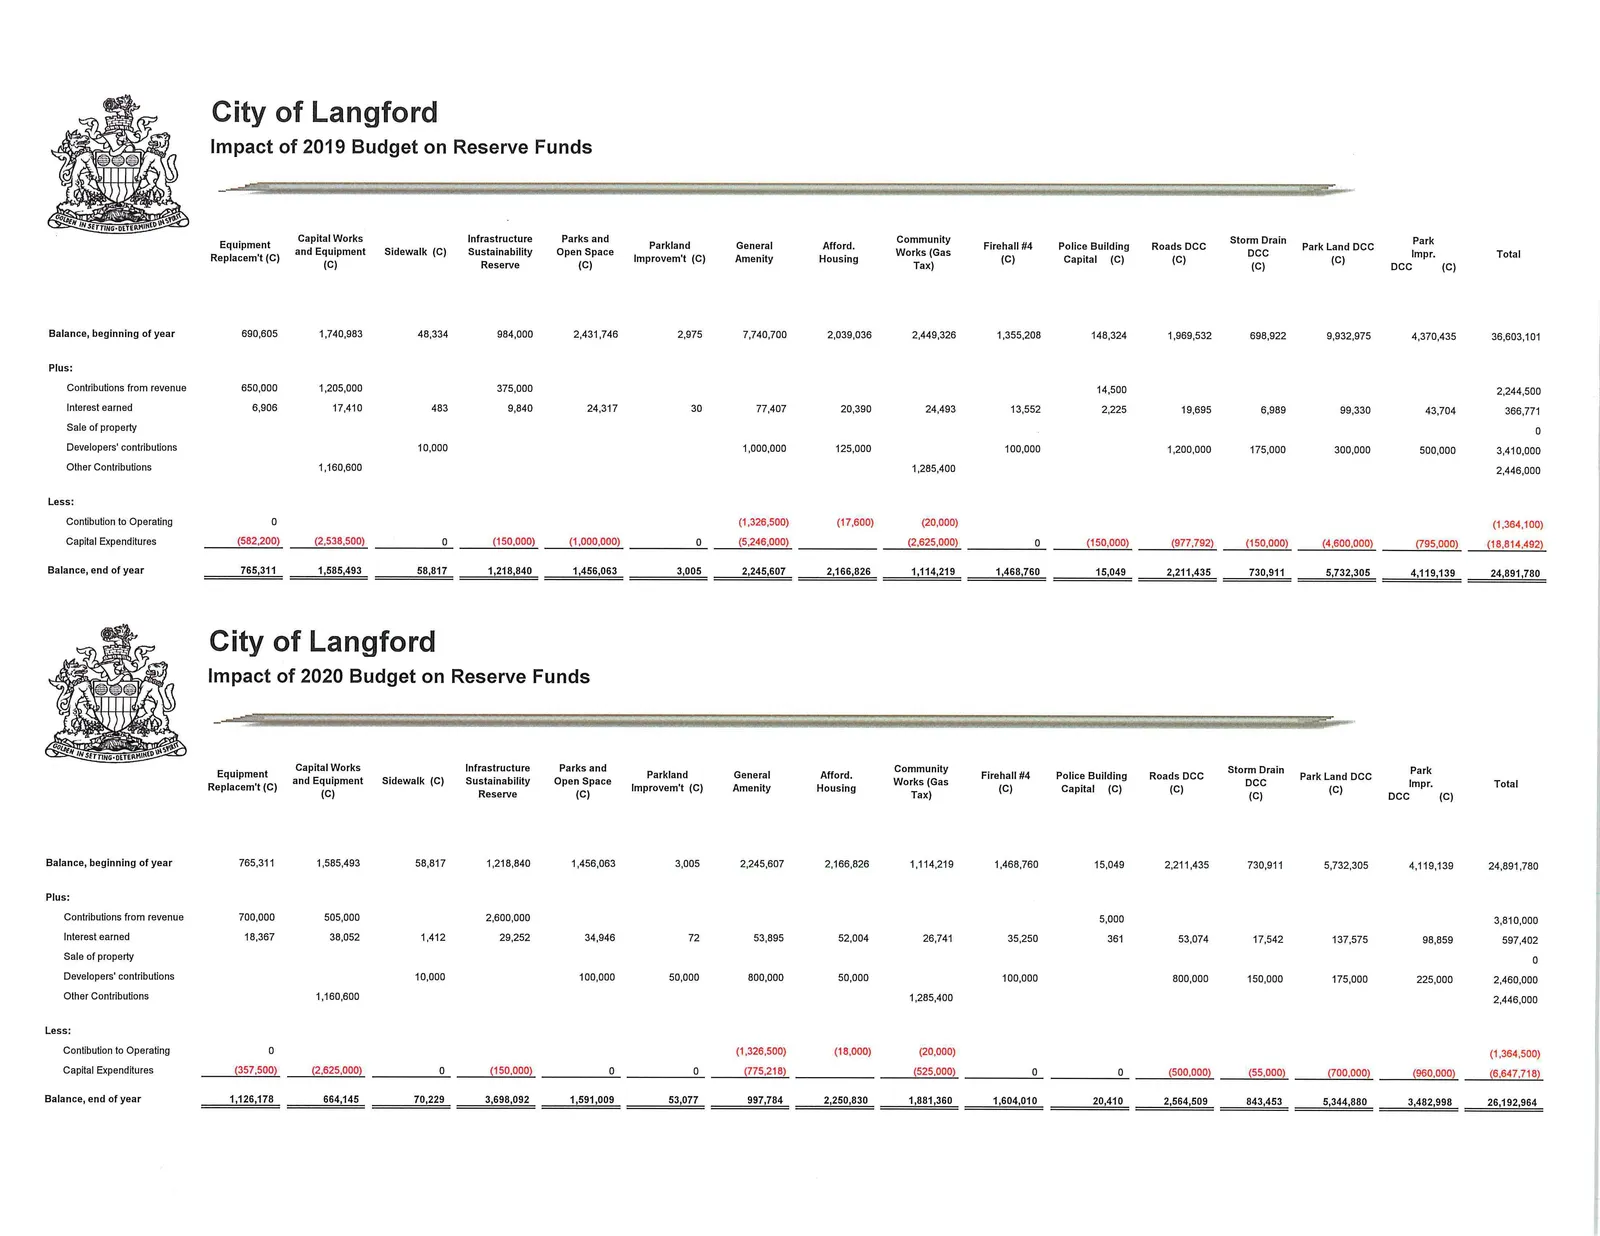
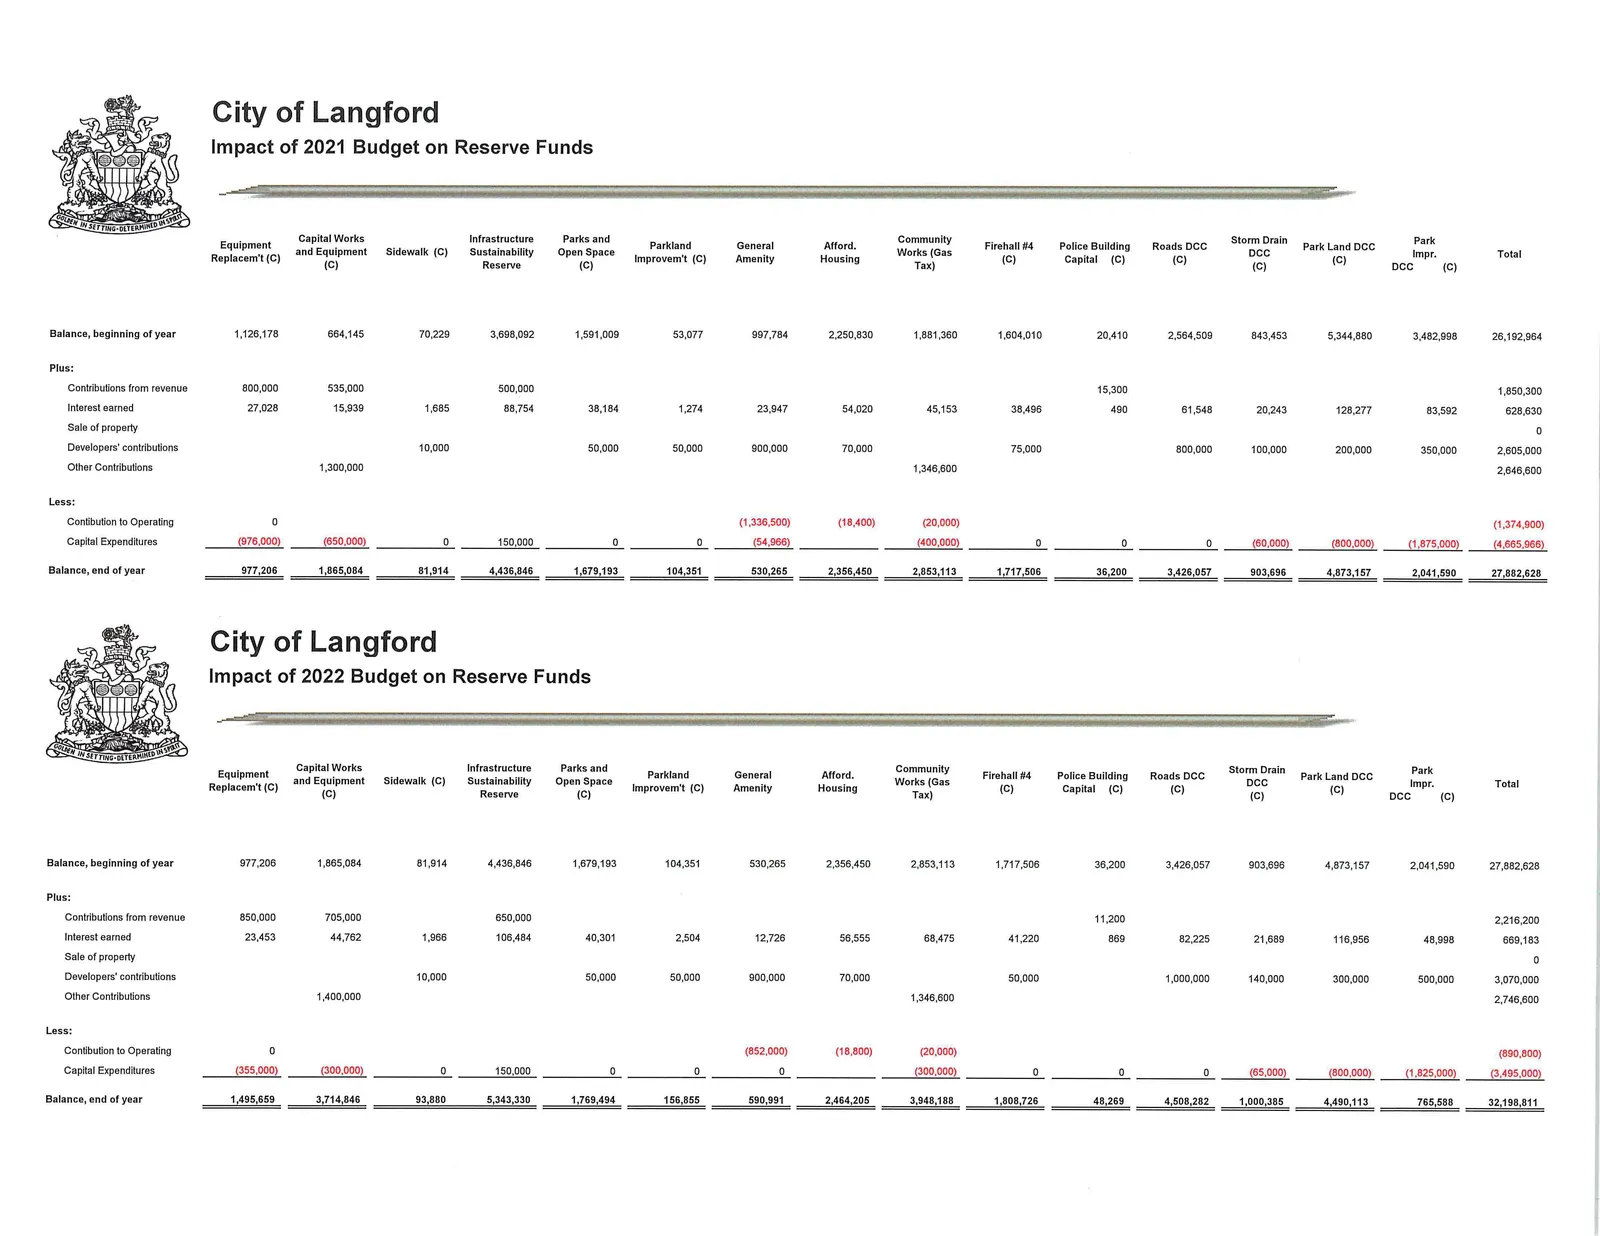
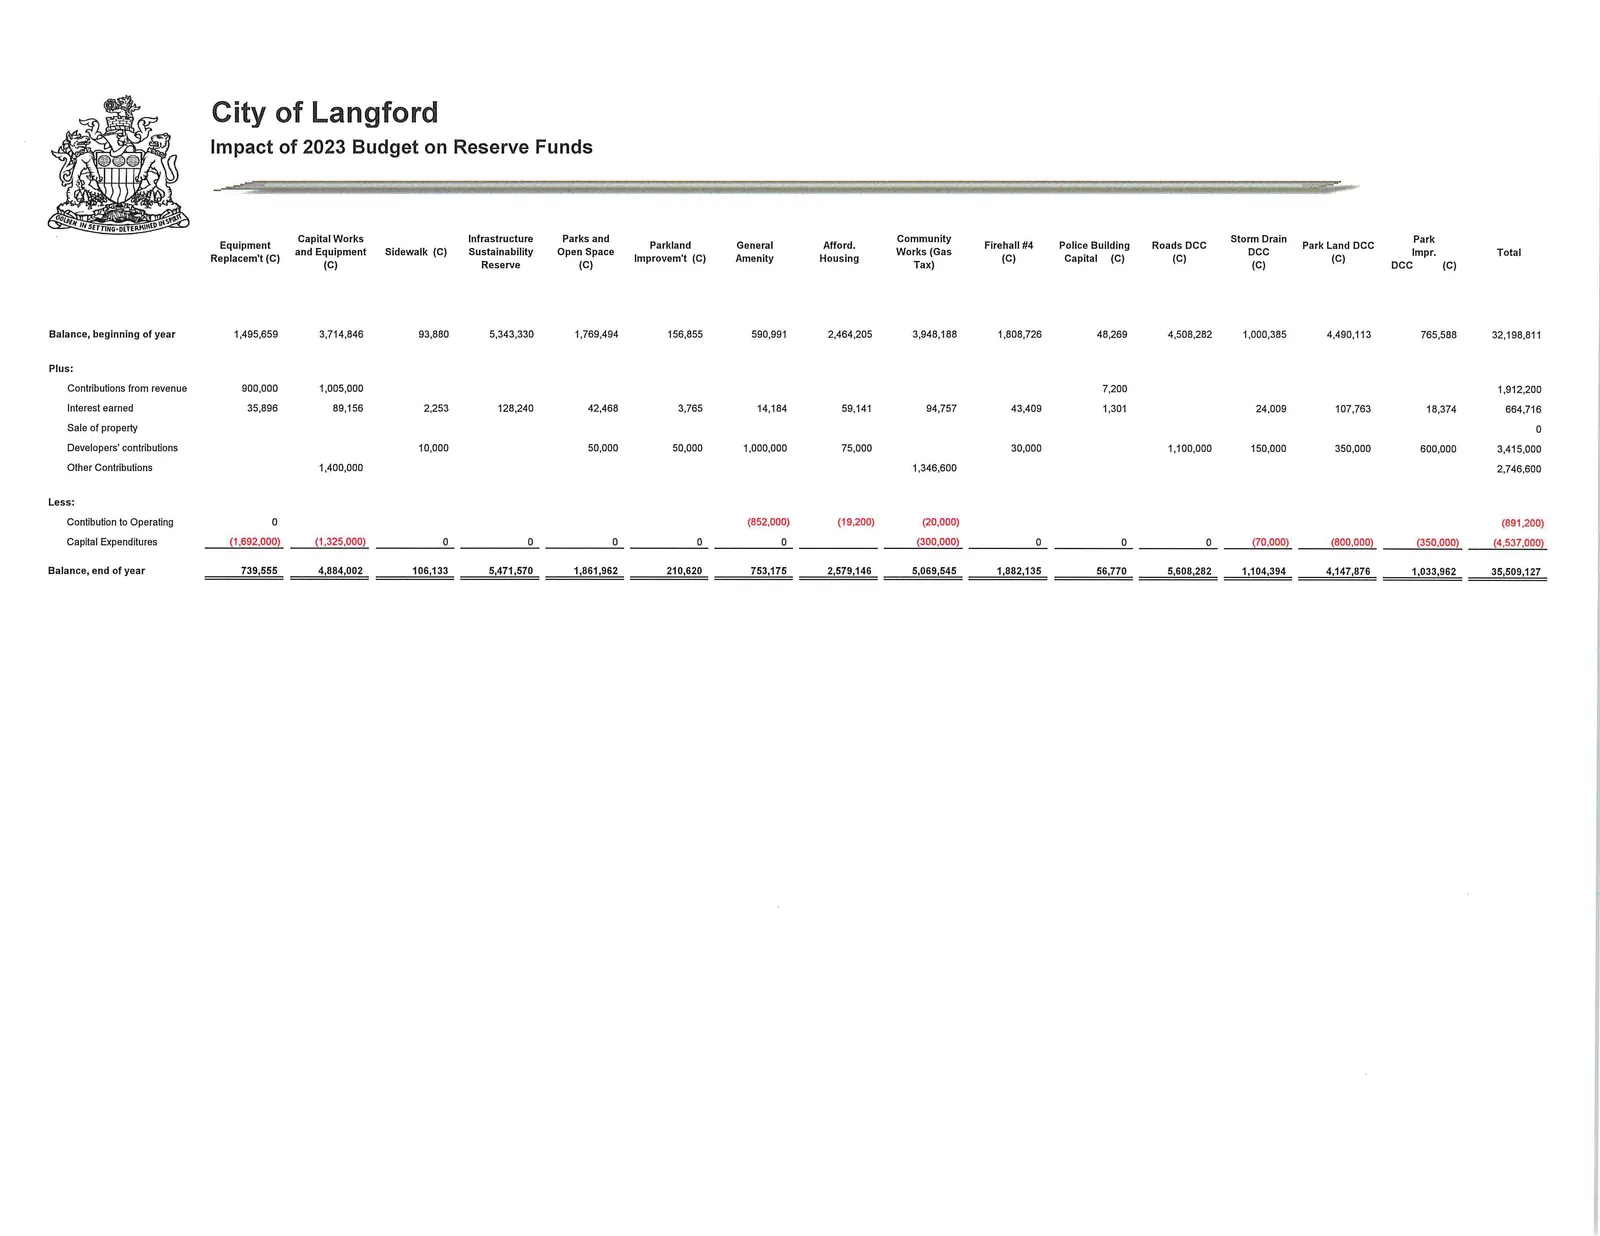
Impact of Budget on Reserve Funds
Note: The document provides multi-year "Impact of Budget on Reserve Funds" tables for years 2019 through 2023 showing beginning balances, contributions, interest, sales, developers' contributions, other contributions, contributions to operating, capital expenditures, and ending balances for multiple reserve funds. Selected extracts are presented below. (Values are presented exactly as in source.)
Impact of 2019 Budget on Reserve Funds - Selected (values as provided)
Balance, beginning of year (selected funds):
- Equipment Replacem't (C): 690,605
- Capital Works (C): 1,740,983
- Infrastructure Impr. (C): 48,334
- Parks and Equipment Replacem't (C): 984,000
- Parkland DCC (C): 2,431,746
- Park and Equipment (Gas Tax) DCC (C): 2,975
- Sidewalk (C): 7,740,700
- Sustainability Reserve (C): 2,039,036
- Open Space (C): 2,449,326
- Works (Gas Tax) (C): 1,355,208
- Other notable balances: 9,932,975; 4,370,435; Total 36,603,101
Plus contributions (selected):
- Contributions from revenue shown totaling: 650,000; 1,205,000; 375,000; 14,500; 2,244,500 (various funds)
- Interest earned (selected) totals: 6,906; 17,410; 483; 9,840; etc.
- Sale of property: 0 for many funds; Developers' contributions: some funds: 10,000; 1,000,000; etc.
- Other Contributions: 3,410,000 (selected)
Less (selected):
- Contribution to Operating: various negative amounts (e.g., (1,326,500))
- Capital Expenditures (selected): (5,246,000); (2,625,000); (150,000); (1,000,000); etc.
Balance, end of year (selected totals):
- Equipment Replacem't (C): 765,311
- Capital Works (C): 1,585,493
- Infrastructure Impr. (C): 58,817
- Parks and Equipment Replacem't (C): 1,218,840
- Parkland DCC (C): 1,456,063
- Sidewalk (C): 2,245,607
- Sustainability Reserve (C): 2,166,826
- Total (selected) = 24,891,780
Impact of 2020 Budget on Reserve Funds - Selected (values as provided)
Balance, beginning of year (from 2019 end):
- Equipment Replacem't (C): 765,311
- Capital Works (C): 1,585,493
- Infrastructure Impr. (C): 58,817
- Parks and Equipment Replacem't (C): 1,218,840
- Parkland DCC (C): 1,456,063
- etc. (full table contains all funds)
Plus contributions and interest (selected):
- Contributions from revenue: 700,000; 505,000; 2,600,000; etc.
- Interest earned: 18,367; 38,052; 1,412; etc.
- Sale of property: 0
- Developers' contributions: 10,000; 100,000; 50,000; 800,000; etc.
- Other Contributions: 2,460,000 (selected)
Less (selected):
- Contribution to Operating: (1,326,500) and similar
- Capital Expenditures: (775,218); (525,000); (500,000); etc.
Balance, end of year (selected totals):
- Equipment Replacem't (C): 1,126,178
- Capital Works (C): 664,145
- Infrastructure Impr. (C): 70,229
- Parks and Equipment Replacem't (C): 3,698,092
- Parkland DCC (C): 1,591,009
- Total (selected) = 26,192,964
Impact of 2021 Budget on Reserve Funds - Selected (values as provided)
Balance, beginning of year (from 2020 end):
- Equipment Replacem't (C): 1,126,178
- Capital Works (C): 664,145
- Infrastructure Impr. (C): 70,229
- Parks and Equipment Replacem't (C): 3,698,092
- Parkland DCC (C): 1,591,009
- etc.
Plus contributions (selected):
- Contributions from revenue: 800,000; 535,000; 500,000; 15,300; etc.
- Interest earned: 27,028; 15,939; 1,685; etc.
- Developers' contributions: 10,000; 50,000; 50,000; 900,000; 70,000; etc.
- Other Contributions: 2,605,000; 1,300,000; 1,346,600; etc.
Less (selected):
- Contribution to Operating: (1,336,500); (18,400); (20,000); etc.
- Capital Expenditures: (4,665,966) (selected aggregate)
Balance, end of year (selected totals):
- Equipment Replacem't (C): 977,206
- Capital Works (C): 1,865,084
- Infrastructure Impr. (C): 81,914
- Parks and Equipment Replacem't (C): 4,436,846
- Parkland DCC (C): 1,679,193
- Total (selected) = 27,882,628
Impact of 2022 Budget on Reserve Funds - Selected (values as provided)
Balance, beginning of year (from 2021 end):
- Equipment Replacem't (C): 977,206
- Capital Works (C): 1,865,084
- Infrastructure Impr. (C): 81,914
- Parks and Equipment Replacem't (C): 4,436,846
- Parkland DCC (C): 1,679,193
- etc.
Plus contributions and interest (selected):
- Contributions from revenue: 850,000; 705,000; 650,000; 11,200; 2,216,200 (selected)
- Interest earned: 23,453; 44,762; 1,966; 106,484; etc.
- Developers' contributions: 10,000; 50,000; 50,000; 900,000; 70,000; etc.
- Other Contributions: 1,400,000; 1,346,600; 2,746,600 (selected)
Less (selected):
- Contribution to Operating: (852,000); (18,800); (20,000); etc.
- Capital Expenditures: (3,495,000) (selected aggregate)
Balance, end of year (selected totals):
- Equipment Replacem't (C): 1,495,659
- Capital Works (C): 3,714,846
- Infrastructure Impr. (C): 93,880
- Parks and Equipment Replacem't (C): 5,343,330
- Parkland DCC (C): 1,769,494
- Total (selected) = 32,198,811
Impact of 2023 Budget on Reserve Funds - Selected (values as provided)
Balance, beginning of year (from 2022 end):
- Equipment Replacem't (C): 1,495,659
- Capital Works (C): 3,714,846
- Infrastructure Impr. (C): 93,880
- Parks and Equipment Replacem't (C): 5,343,330
- Parkland DCC (C): 1,769,494
- etc.
Plus contributions and interest (selected):
- Contributions from revenue: 900,000; 1,005,000; 7,200 (selected)
- Interest earned: 35,896; 89,156; 2,253; etc.
- Developers' contributions: 10,000; 50,000; 50,000; 1,000,000; 75,000; etc.
- Other Contributions: 1,400,000; 1,346,600; 2,746,600 (selected)
Less (selected):
- Contribution to Operating: (852,000); (19,200); (20,000); etc.
- Capital Expenditures: (4,537,000) (selected aggregate)
Balance, end of year (selected totals):
- Equipment Replacem't (C): 739,555
- Capital Works (C): 4,884,002
- Infrastructure Impr. (C): 106,133
- Parks and Equipment Replacem't (C): 5,471,570
- Parkland DCC (C): 1,861,962
- Total (selected) = 35,509,127
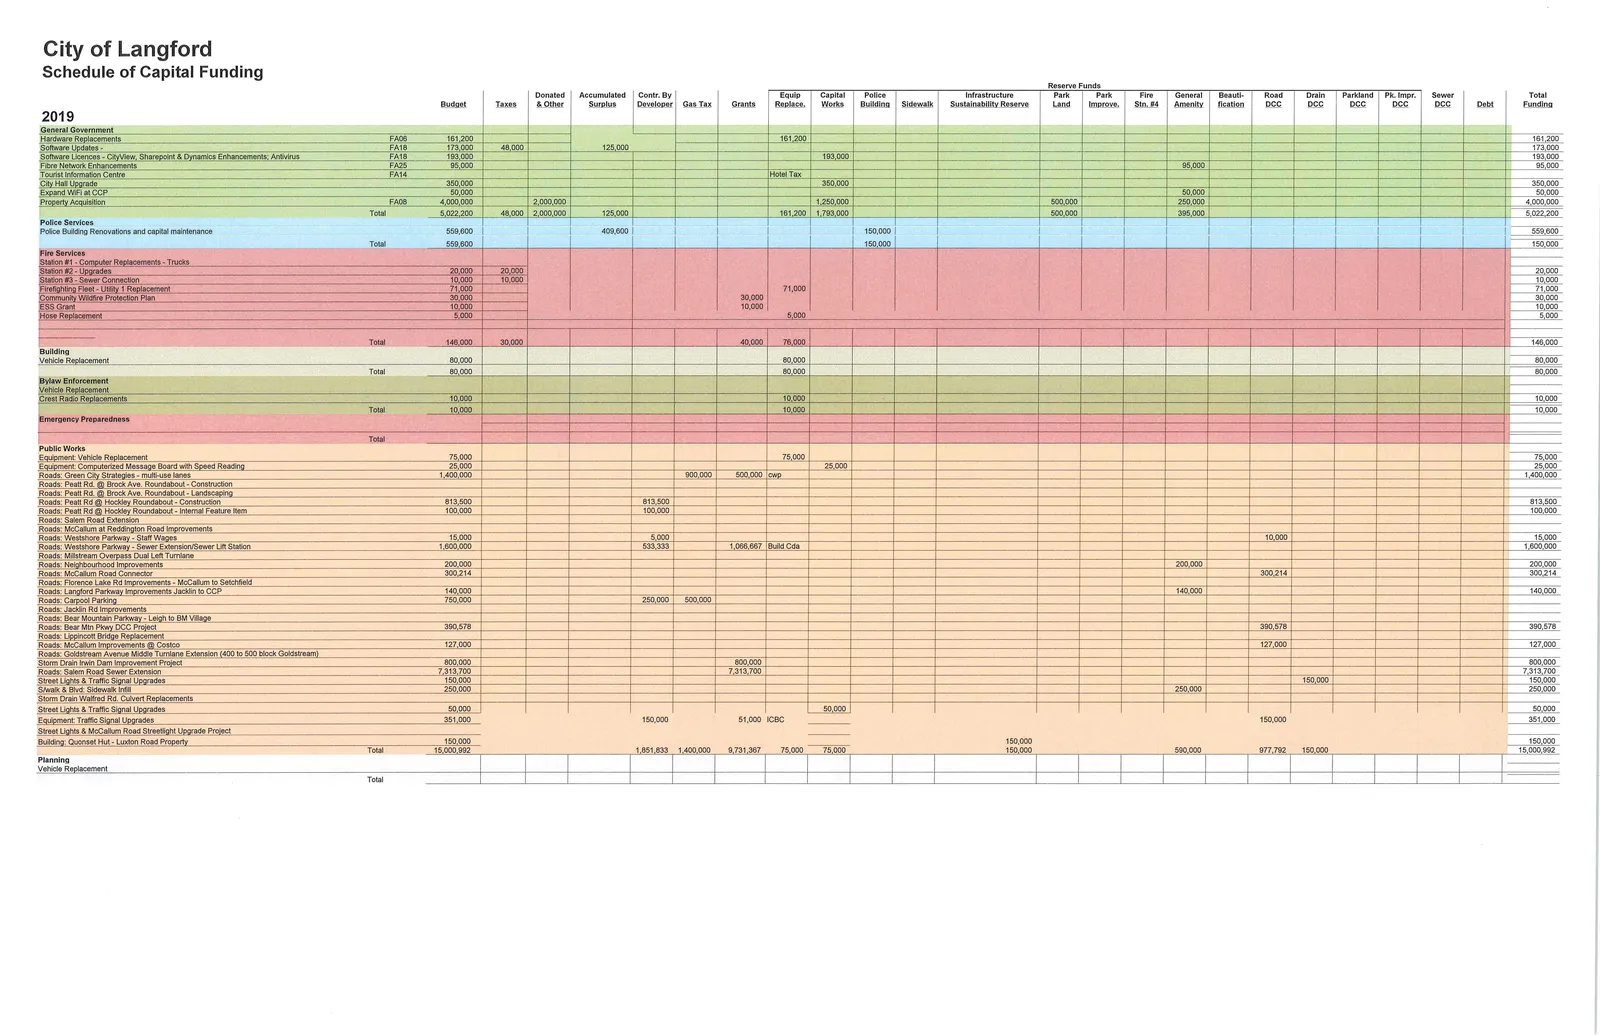
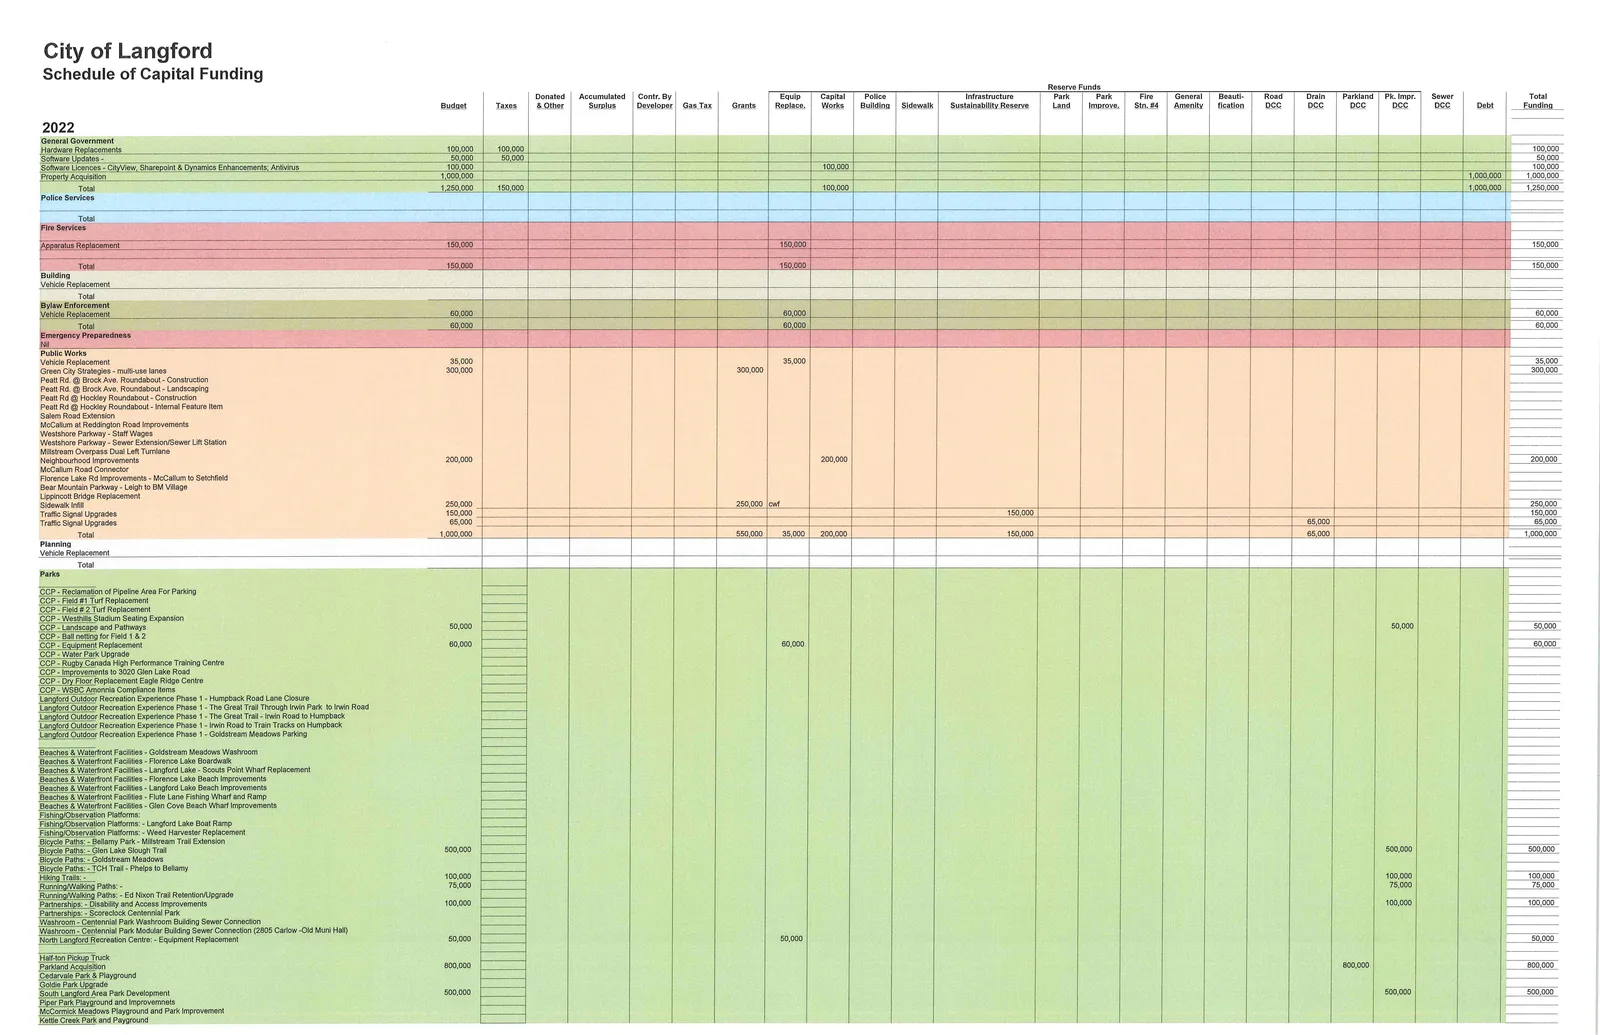
Schedule of Capital Funding (Selected extracts by year / project)
The Schedule of Capital Funding lists projects, codes (FA06, FA18, FA25, FA14, FA08 etc.), budgets, funding sources (Taxes, Donated & Other, Accumulated Surplus, Contr. By Developer, Gas Tax, Grants, Equip Replace., Capital Works, Police Building, Sidewalk, Infrastructure, Sustainability Reserve, Park Land DCC, Park Improve DCC, Fire Stn. #4, General Amenity, Beautification, Road DCC, Drain DCC, Parkland DCC, Pk. Impr. DCC, Sewer DCC, Debt) and totals. Selected projects and funding splits are shown below exactly as recorded.
2019 - Selected Projects and Funding
General Government
- Hardware Replacements (FA06): 161,200 (Total) — funding: 161,200
- Software Updates - (FA18): 173,000 — funding split: 48,000; 125,000
- Software Licences - CityView, Sharepoint & Dynamics Enhancements; Antivirus (FA18): 193,000 — funding: 193,000
- Fibre Network Enhancements (FA25): 95,000 — funding: 95,000
- City Hall Upgrade: 350,000 — funding: 350,000
- Expand WiFi at CCP: 50,000 — funding: 50,000
- Property Acquisition (FA08): 4,000,000 — funding split: 2,000,000; 1,250,000; 500,000; 250,000
- Total (General Government): 5,022,200 — funding split recorded in table
Police Services
- Police Building Renovations and capital maintenance: 559,600 — funding split recorded (150,000 etc.)
Fire Services (selected)
- Station #1 - Computer Replacements - Trucks: amounts and funding lines provided (e.g., 30,000 etc.)
- Apparatus Replacement: listed as budget lines under Fire Services; totals recorded
Building
- Vehicle Replacement: 80,000
Bylaw Enforcement
- Vehicle Replacement: 80,000
- Crest Radio Replacements: 10,000
Public Works (selected)
- Equipment: Vehicle Replacement; Equipment: Computerized Message Board with Speed Reading
- Roads: Green City Strategies - multi-use lanes: 1,400,000 (funding splits indicated: 900,000; 500,000 cwp)
- Peatt Rd. @ Brock Ave. Roundabout - Construction: 850,000
- Peatt Rd @ Hockley Roundabout - Construction: 813,500
- Salem Road Extension: included in larger Roads Capital list
- McCallum at Reddington Road Improvements: 500,000
- Westshore Parkway - Sewer Extension/Sewer Lift Station: 1,600,000 — funding split: 533,333; 1,066,667 Build Cda
- Millstream Overpass Dual Left Turnlane: 2,110,219 (selected)
- Neighbourhood Improvements: 200,000
- McCallum Road Connector: 300,214
- Florence Lake Rd Improvements - McCallum to Setchfield: 740,000
- Sidewalk lnfill: 250,000
- Traffic Signal Upgrades: 55,000 (2019)
Planning
- Vehicle Replacement: 15,000,992 (note: planning table shows a large total/placeholder)
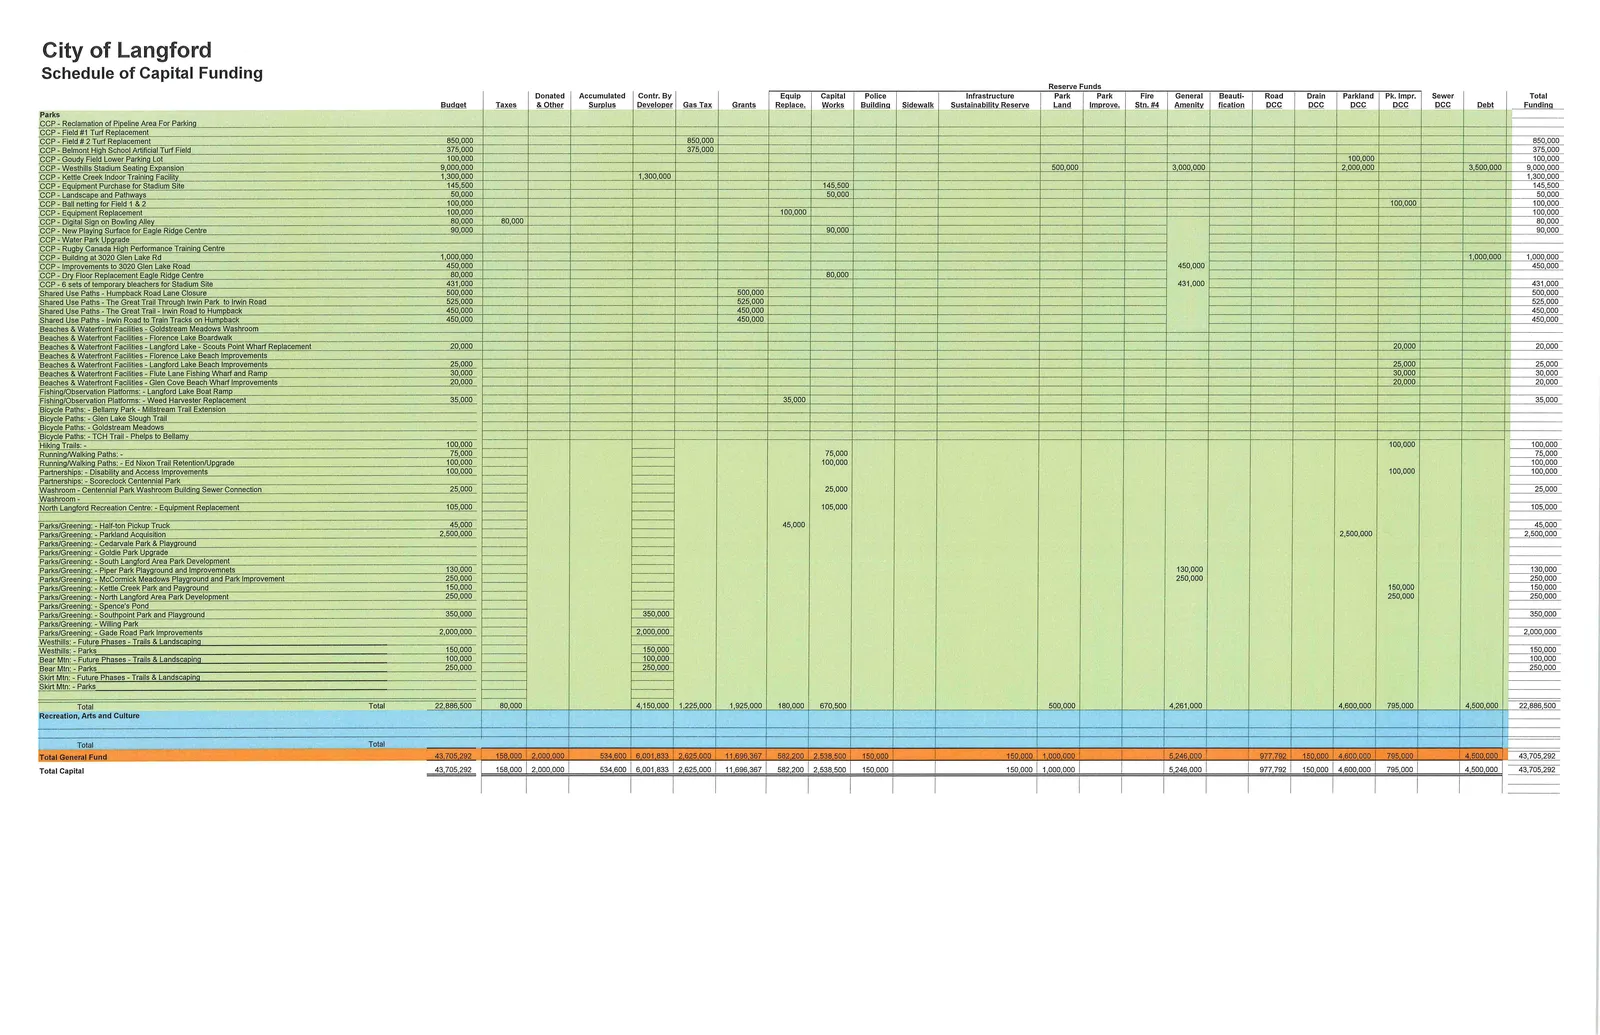
Parks / Recreation / Arts & Culture - Selected funding lines:
- CCP - Reclamation of Pipeline Area For Parking: 50,000 (2019)
- CCP - Field #1 Turf Replacement: 216,757
- CCP - Field #2 Turf Replacement: 850,000
- CCP - Belmont High School Artificial Turf Field: 375,000
- CCP - Westhills Stadium Seating Expansion: 9,000,000 (funding split shown: 500,000; 3,000,000; 2,000,000; 3,500,000)
- CCP - Kettle Creek Indoor Training Facility: 1,300,000
- CCP - Equipment Purchase for Stadium Site: 145,500
- CCP - Ball netting for Field 1 & 2: 100,000
- CCP - Equipment Replacement: 100,000
- CCP - Digital Sign on Bowling Alley: 80,000
- Goldstream Meadows Washroom: funding lines included
- Florence Lake Boardwalk: funding lines included
- Langford Lake - Scouts Point Wharf Replacement: 20,000
- Langford Lake Beach Improvements: 25,000
- Flute Lane Fishing Wharf and Ramp: 30,000
- Glen Cove Beach Wharf Improvements: 20,000
- Weed Harvester Replacement: 35,000 / 90,000 / 300,000 (various)
- Bicycle / Trail projects: various DCC-funded and grant portions
- Parkland Acquisition: 2,500,000 (2019 shown in Parks schedule)
- Total (Recreation, Arts and Culture) for 2019: 22,886,500 (selected)
Total General Fund / Total Capital (summary lines)
- Total capital programs and funding sources are aggregated to totals such as 43,705,292 (grand total across schedules), with funding splits across reserve funds and debt lines as shown.
Note: The Schedule of Capital Funding includes detailed funding source columns for each project; the above captures selected projects and funding splits exactly as presented in the extracted text. For full row-by-row funding splits, please refer to the original schedule table entries.
Schedule of Capital Funding - Selected Yearly Extracts (2020–2023)
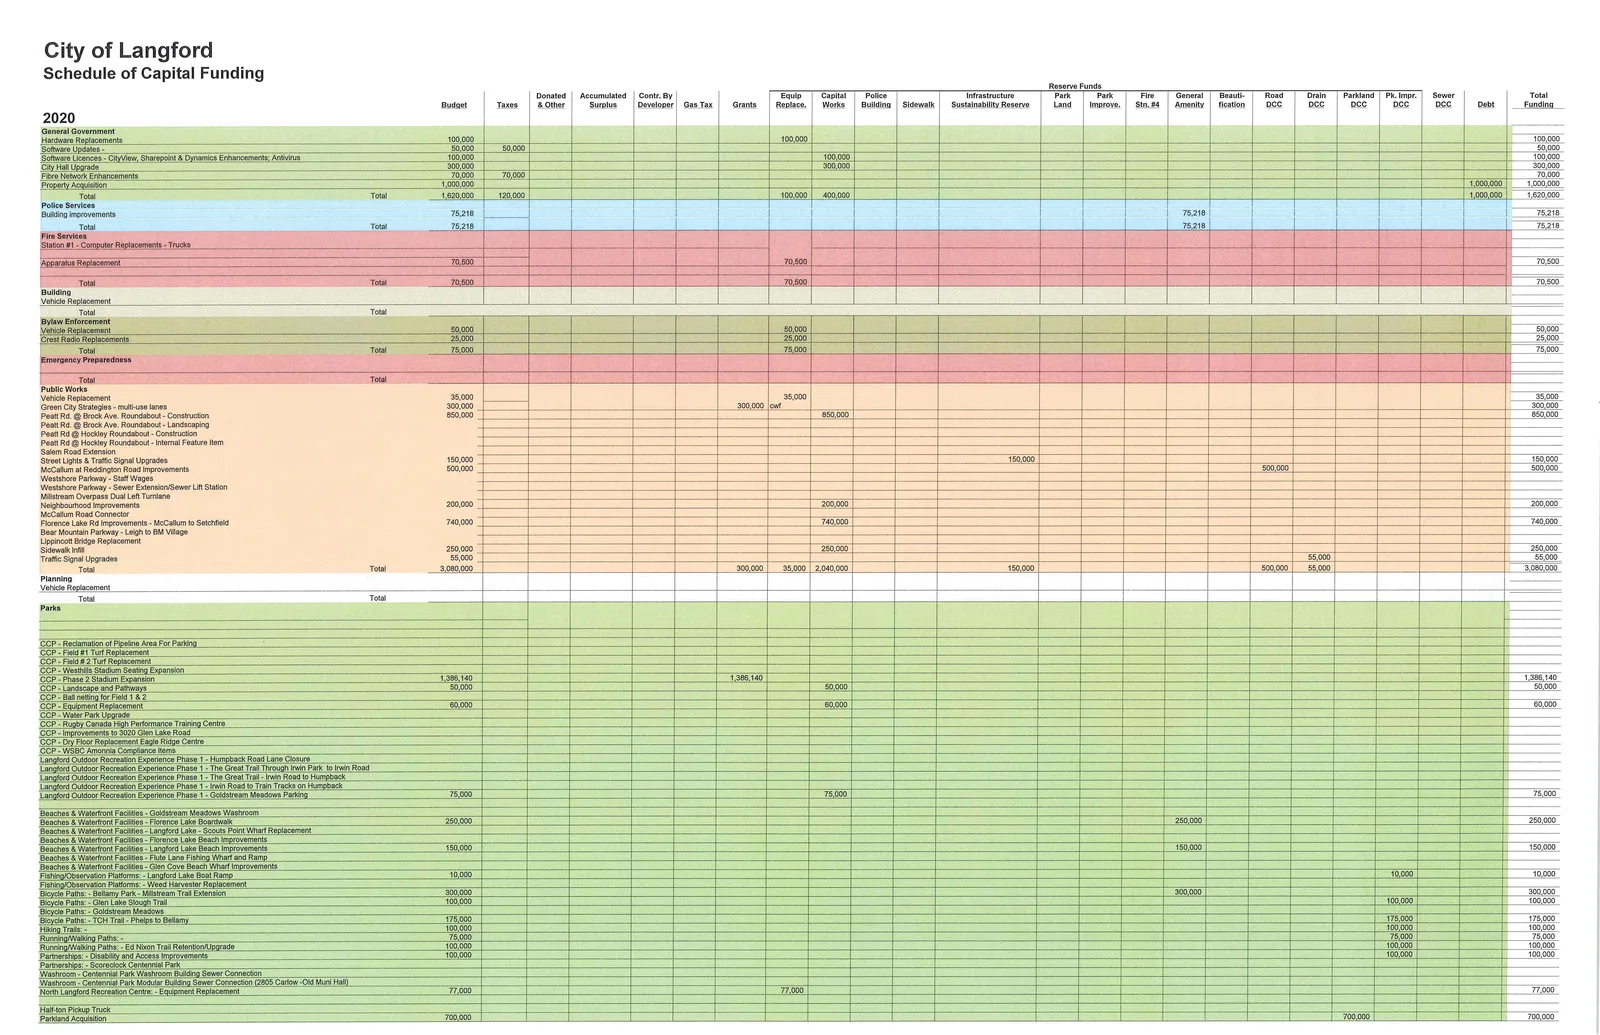
2020 - Selected Projects and Funding
General Government:
- Hardware Replacements: 100,000
- Software Updates: 50,000
- Software Licences: 100,000
- City Hall Upgrade: 300,000
- Fibre Network Enhancements: 70,000
- Property Acquisition: 1,000,000
- Total (selected): 1,620,000 (with detailed funding splits)
Police Services:
- Building improvements: 75,218 (line item shown)
Fire Services:
- Station #1 - Computer Replacements - Trucks: 70,500
- Apparatus Replacement: 70,500
- Total Fire: 70,500 (selected)
Bylaw Enforcement:
- Vehicle Replacement: 50,000
- Crest Radio Replacements: 25,000
- Total: 75,000
Public Works (selected):
- Vehicle Replacement: 35,000
- Green City Strategies - multi-use lanes: 300,000 (cwf)
- Peatt Rd. @ Brock Ave. Roundabout - Construction: 850,000
- Florence Lake Rd Improvements - McCallum to Setchfield: 740,000
- Sidewalk Infill: 250,000
- Traffic Signal Upgrades: 55,000
- Total Public Works (selected): 3,080,000
Parks / Recreation (selected):
- CCP - Phase 2 Stadium Expansion: 1,386,140 (2019–2020 phasing)
- CCP - Landscape and Pathways: 50,000
- CCP - Equipment Replacement: 60,000
- Langford Outdoor Recreation Experience Phase 1 - multiple shared use path items each: 75,000 to 525,000 as shown
- Beaches & Waterfront and Bicycle Paths: selected amounts (e.g., 75,000; 300,000; 100,000)
- North Langford Recreation Centre - Equipment Replacement: 105,000
- Half-ton Pickup Truck: 45,000
- Parkland Acquisition: 700,000
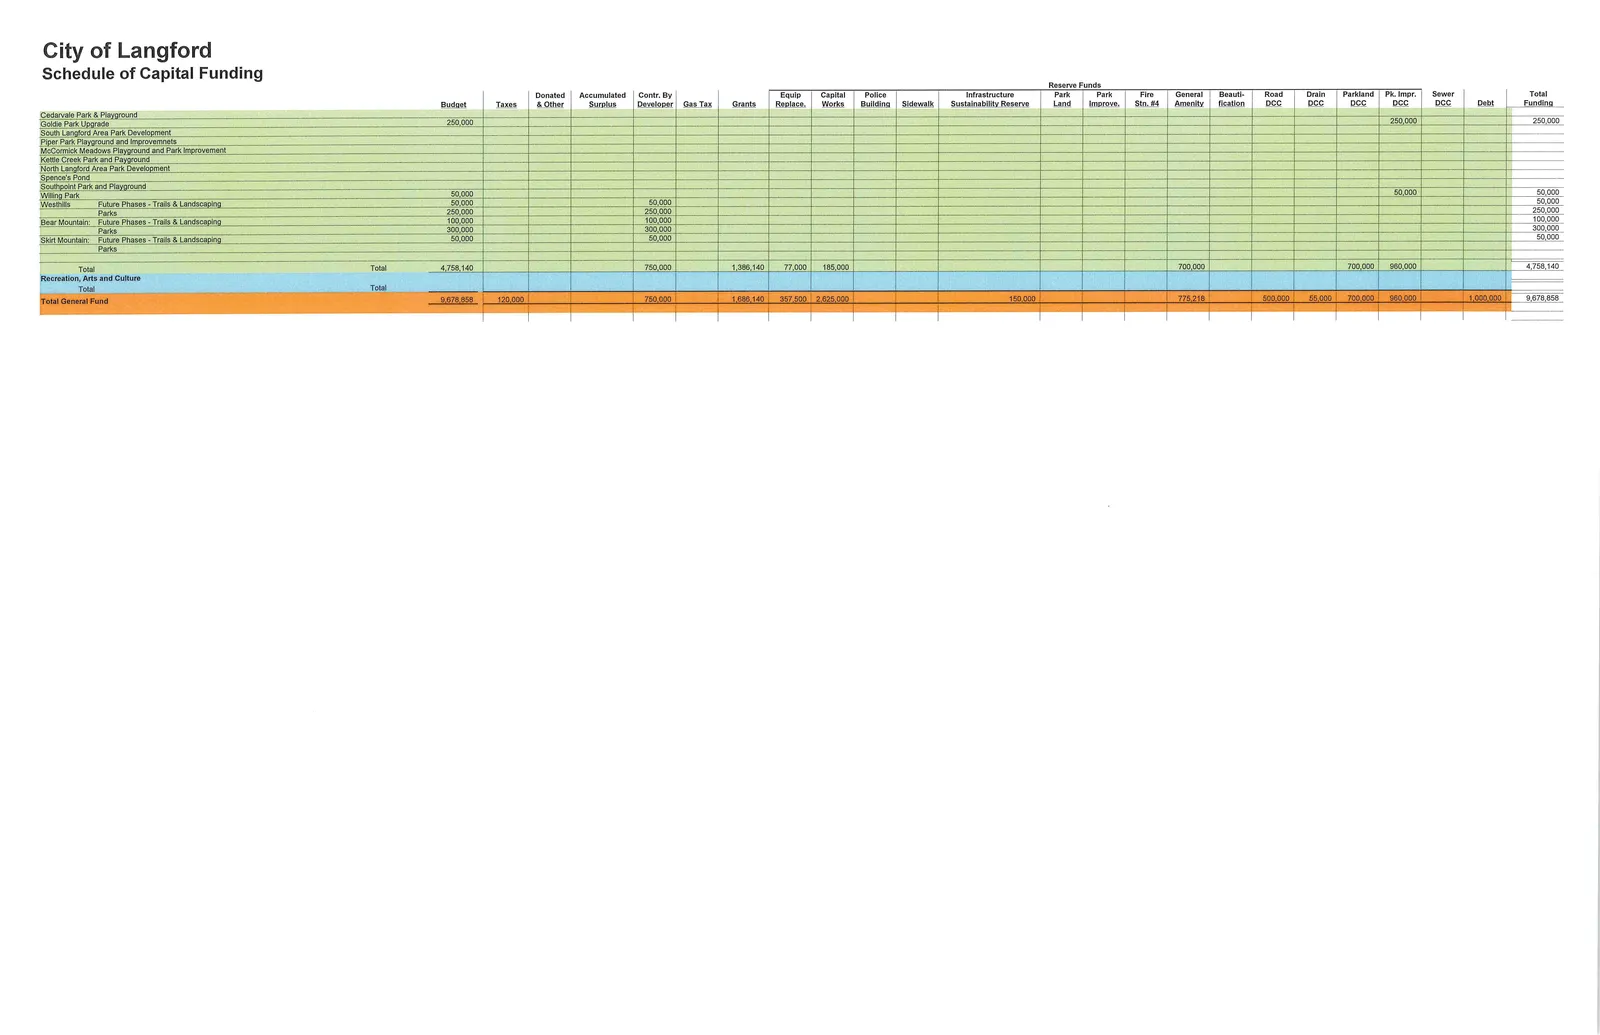
Total Recreation, Arts and Culture: 9,678,858 (selected total)
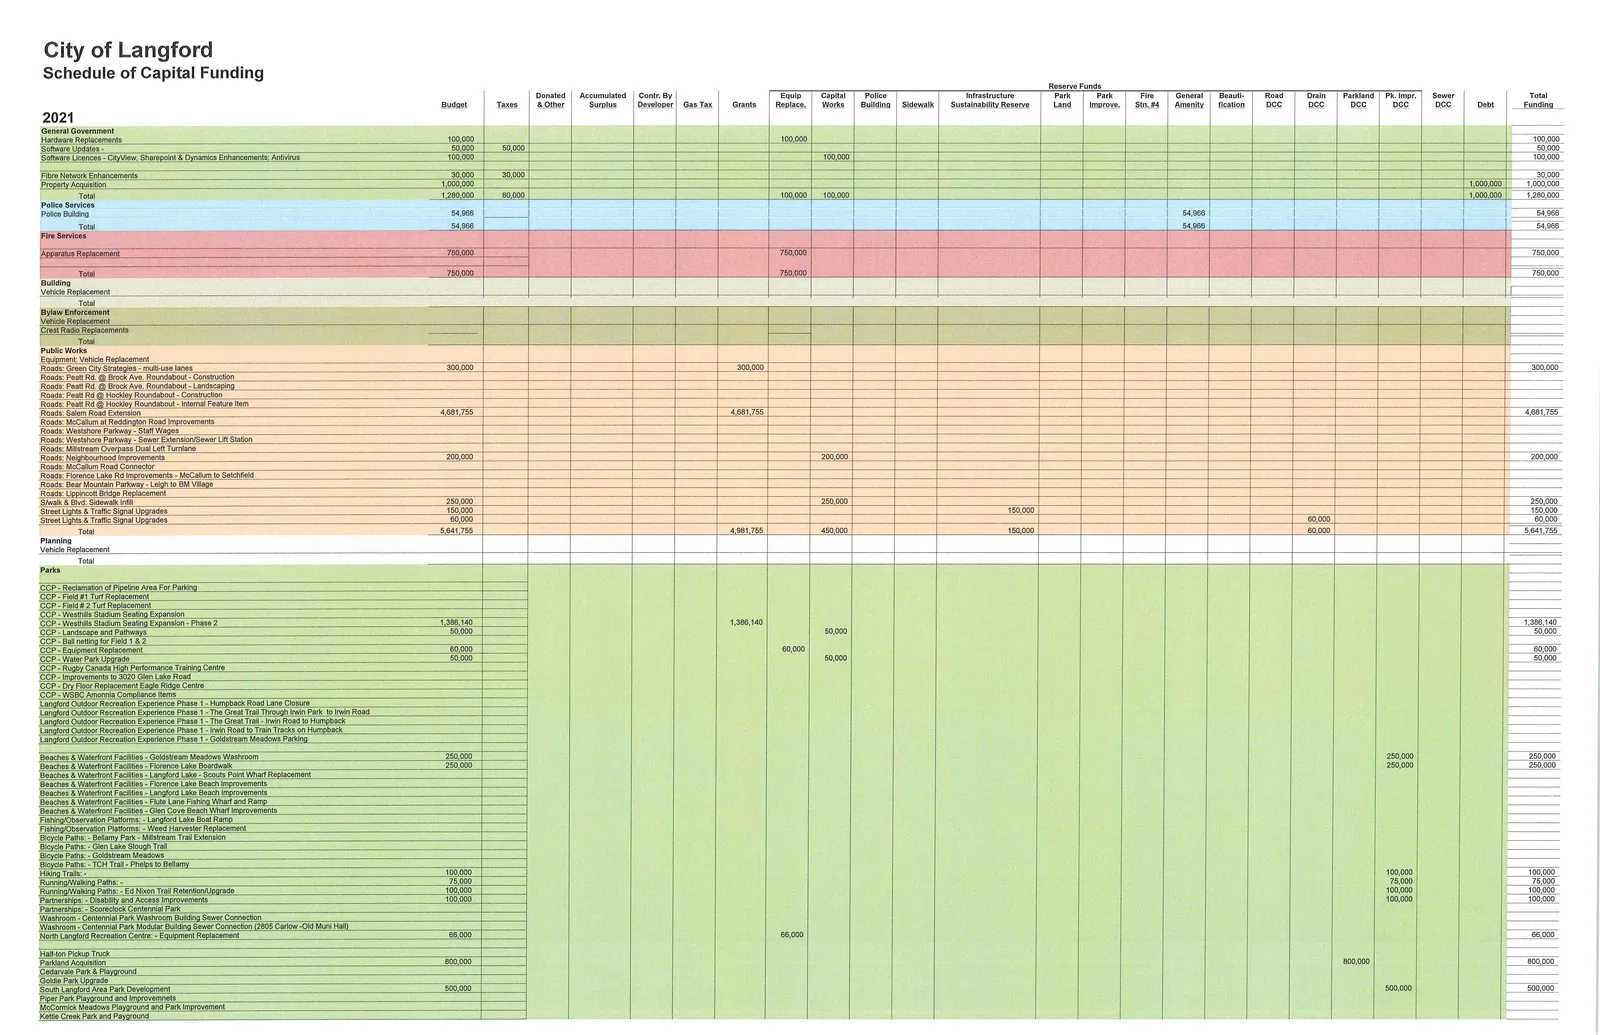
2021 - Selected Projects and Funding
General Government:
- Hardware Replacements: 100,000
- Software Updates: 50,000
- Software Licences: 100,000
- Fibre Network Enhancements: 30,000
- Property Acquisition: 1,000,000
- Total: 1,280,000
Fire Services:
- Apparatus Replacement: 750,000
Public Works:
- Salem Road Extension: 4,681,755 (major project)
- Sidewalk lnfill: 250,000
- Street Lights & Traffic Signal Upgrades: 150,000
- Street Lights & Traffic Signal Upgrades (additional): 60,000
- Total Public Works: 5,641,755 (selected)
Parks:
- CCP - Westhills Stadium Seating Expansion - Phase 2: 1,386,140
- CCP - Equipment Replacement / Water Park Upgrade / other project lines: various (60,000; 50,000 etc.)
- Langford Outdoor Recreation Experience and Beaches/Paths items: multiple items with amounts
- Parkland Acquisition: 800,000
- Half-ton Pickup Truck: 75,000
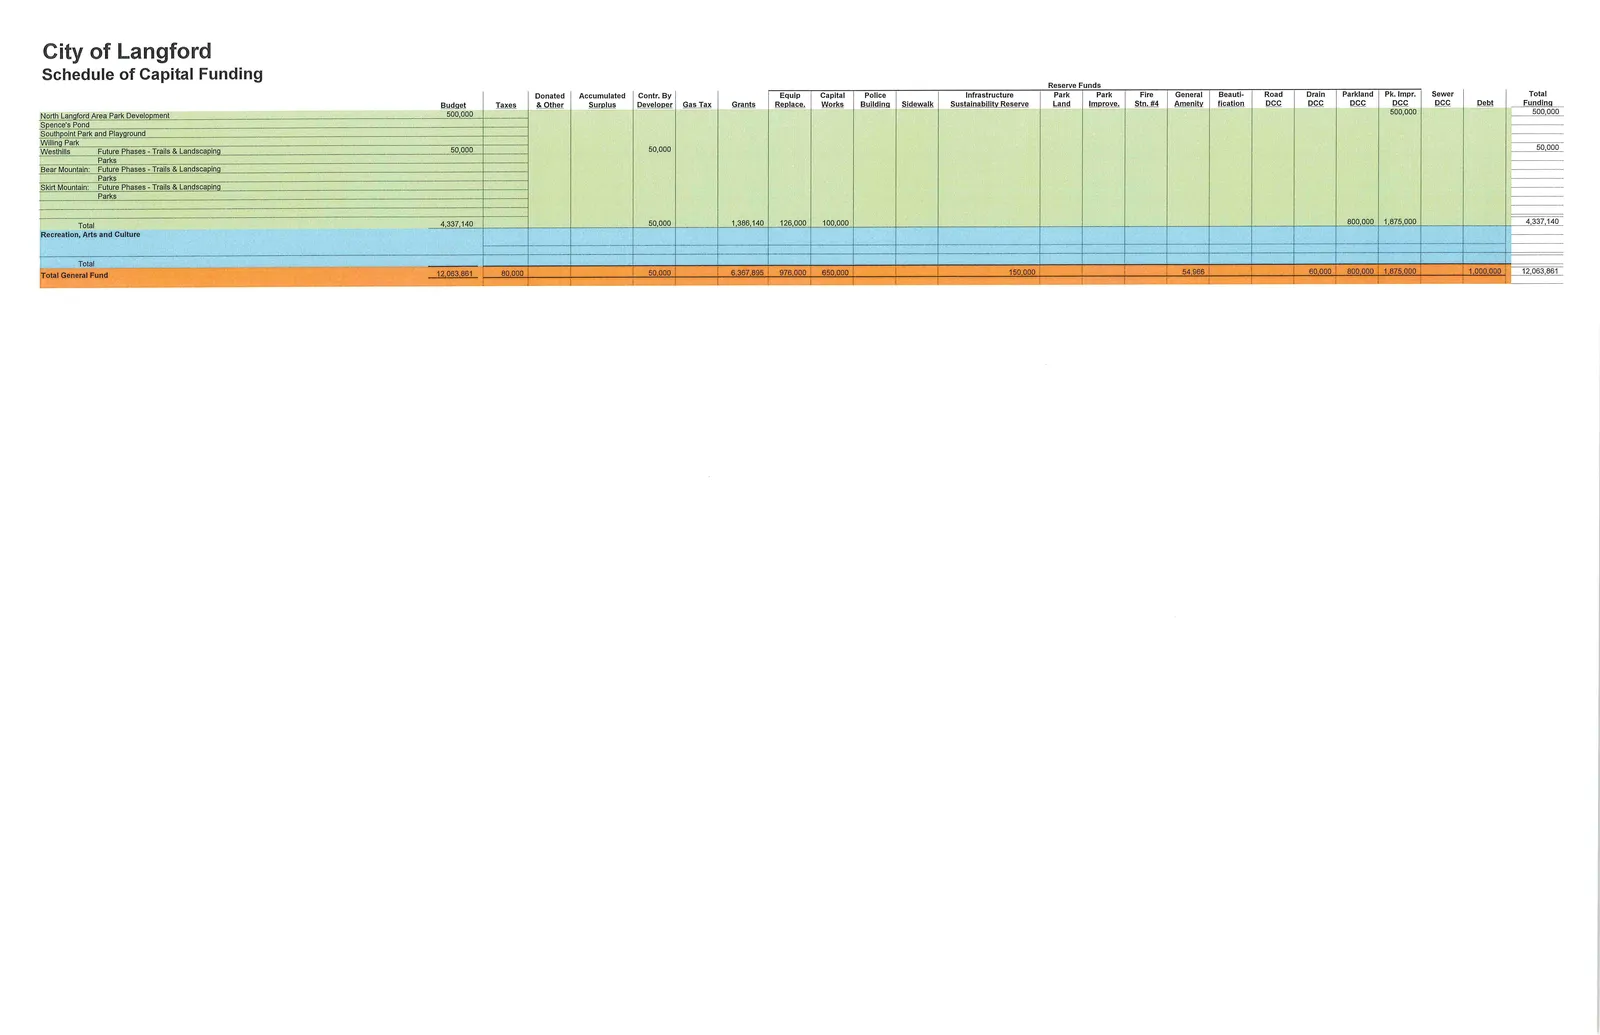
- Total Parks (selected): 4,337,140 (as shown in table)
2022 - Selected Projects and Funding
General Government:
- Hardware Replacements: 100,000
- Software Updates: 50,000
- Software Licences: 100,000
- Property Acquisition: 1,000,000
- Total General Government: 1,250,000 (selected)
Fire Services:
- Apparatus Replacement: 150,000
Bylaw Enforcement:
- Vehicle Replacement: 60,000
Public Works:
- Vehicle Replacement: 35,000
- Green City Strategies - multi-use lanes: 300,000
- Sidewalk lnfill: 250,000
- Street Lights & Traffic Signal Upgrades: 150,000
- Traffic Signal Upgrades: 65,000
- Total Public Works: 1,000,000 (selected)
Parks:
- CCP and other parks items (selected): CCP - Equipment Replacement 60,000; Water Park Upgrade 50,000; Stadium items; trail projects (500,000; 525,000; 450,000); Goldstream Meadows Parking 75,000
- Beaches & Waterfront Facilities: multiple lines (e.g., Goldstream Meadows Washroom 250,000; Florence Lake Boardwalk 250,000)
- North Langford Recreation Centre Equipment Replacement: 50,000
- Parkland Acquisition: 800,000
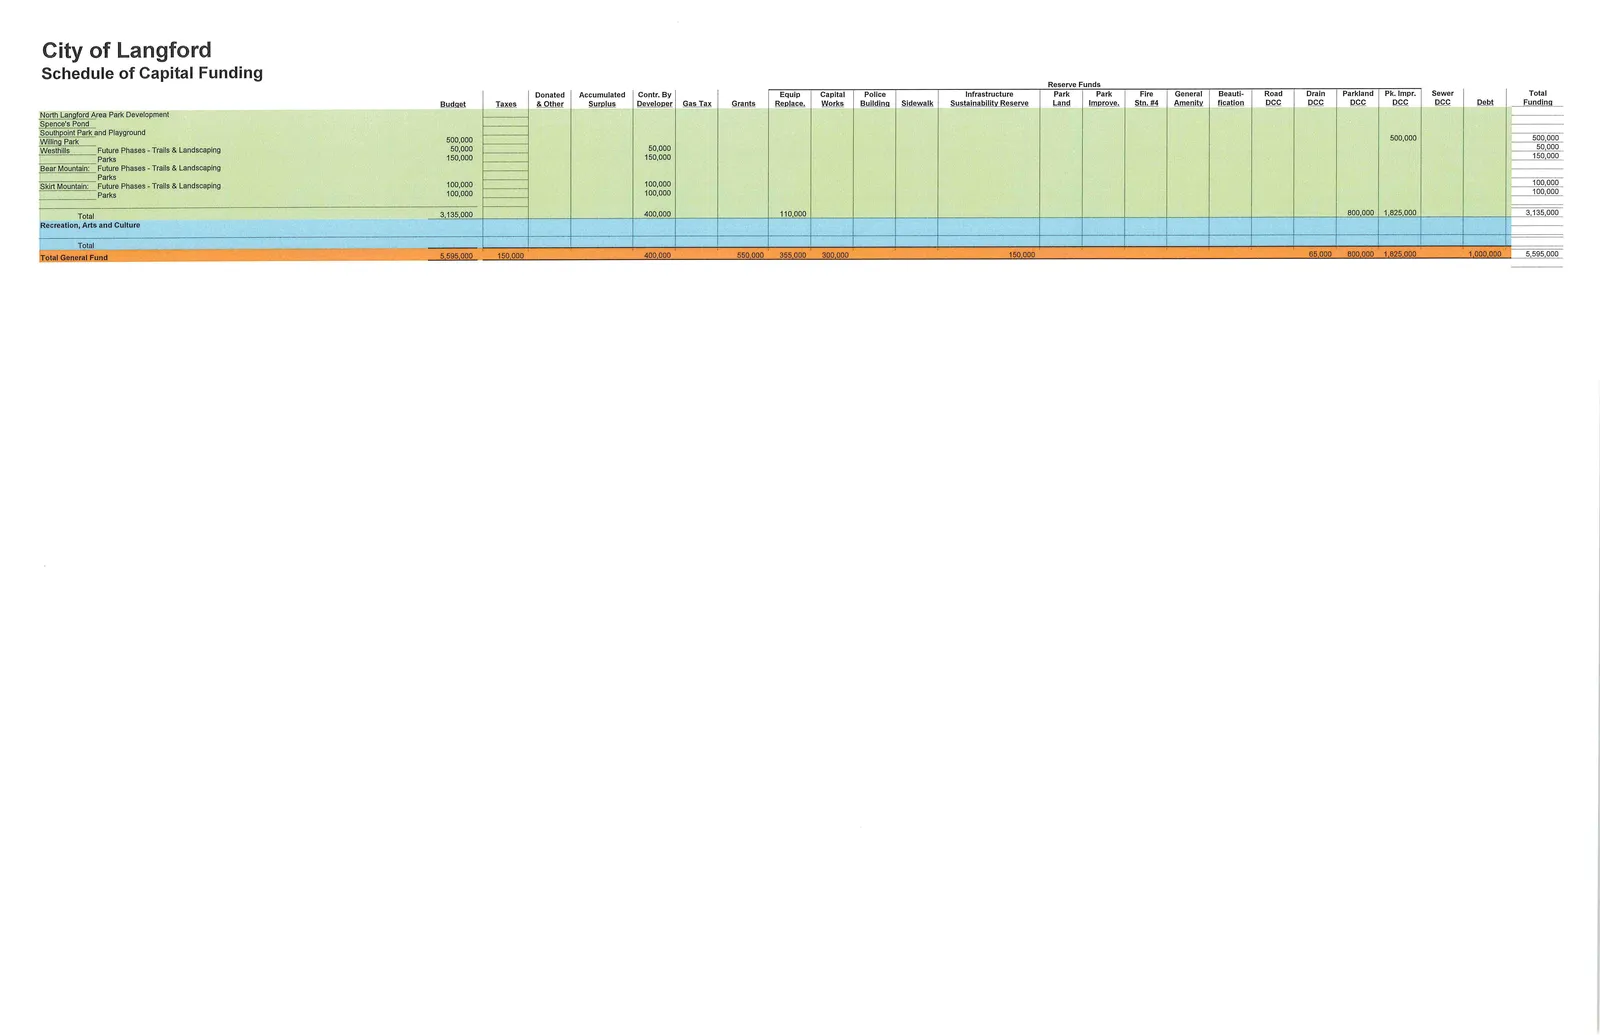
- Total Parks (selected): 3,135,000 (selected)
2023 - Selected Projects and Funding
- General Government / Public Works / Parks: selected totals and project lines continue with smaller capital programs:
- Half-ton Pickup Truck: 50,000
- Parkland Acquisition: 1,825,000 (selected as a multi-year program)
- Various parks and trails projects: 500,000; 500,000; 150,000; 100,000; etc.
- Total (selected): 3,135,000 (Parks total) and overall capital totals shown as 5,595,000 (Total Recreation, Arts and Culture aggregated line), and grand totals for total general fund and total capital as recorded.
End of converted pages 59–96 content (extracted tables and text converted to Markdown).
Document Images
(38)