DocumentsStaff ReportMar 4, 2019Pages 34–58
Staff Report (Finance) – 2019-2023 Five-Year Financial Plan Approval
Finance department report presenting the proposed Five-Year Financial Plan 2019–2023, summarizing operating and capital budgets, major capital projects and the recommended tax impact for 2019.
Key facts
- 2019 capital spending: $44,093,292 (99% funded from non-tax sources)
- Proposed tax increase in 2019: 2.49% (2% for public safety — 1% fire, 1% police; additional 0.49% inflation/growth)
- Major capital projects: Westhills Stadium seating expansion; City Centre Park expansion; West Shore Parkway sewer extension; Peatt Rd @ Hockley roundabout; additional turf field at Belmont High School
- Revenue and expense summaries and detailed five-year projections included (Exhibit A and supporting tables)
Staff Report (Finance) – 2019-2023 Five-Year Financial Plan Approval
Date: 04/03/2019
Department: Finance
Background
The Community Charter requires council to adopt a Five-Year Financial Plan (the Plan) each year and, after the adoption of the Plan but before May 15th, to adopt a tax rate bylaw. As the final assessment information from BC Assessment that is required for final approval of the tax rate bylaw, each of the bylaws will come forward in April and then for adoption at the first Council meeting in May. This year, the financial plan is before Council for approval earlier in the year. This additional time allows for a longer construction window for many projects and provides additional time for departments to implement work plans for the remainder of the year once the budget is approved.
Commentary
Each departmental budget has been presented at an open meeting of the relevant committee, which fulfills the statutory requirement for a public financial planning process.
The 2019 budget provides for the maintenance of all service levels across departments as the City continues to grow. Council’s priority of public safety and parks and recreation highlight the 2019 – 2023 Financial Plan. 2019 is the second year of a five-year program to increase fire department and police resources to meet the needs of growth within the City.
The capital budget provides for spending of $44,093,292 in 2019, with 99% funded from non-tax sources such as contributions, grants, short-term debt financing and reserves.
Major components of the capital budget include:
- Westhills Stadium Seating Expansion
- City Centre Park expansion including additional playground and plaza area
- Additional turf field at Belmont Highschool
- Expansion renovations at Westshore RCMP detachment
- Peatt Rd @ Hockley roundabout construction
- Salem Road Sewer Extension
- West Shore Parkway, Sewer Extension and Sewer Lift station
- Traffic Signal computer upgrades
- Langford Outdoor experience bike trails
- Gade Rd park improvements
- Additional Park land acquisition and improvements
A summary of the Five-Year Financial Plan is attached as Exhibit “A”.
Taxation Implications
The proposed 2019 – 2023 Five Year Financial Plan will result in a tax increase of 2.49% in 2019. Council’s priority of public safety services make up 2% of the tax increase this year, the second of a five-year plan, with 1% to fire and 1% to police for additional resources to meet the requirements of growth within in the City. The additional 0.49% is to cover increased costs of service due to inflation and growth of the City.
Options
That Council approve the 2019 – 2023 Five Year Financial Plan and direct staff to bring forward the Five Year Financial Plan Bylaw, 2019 and the 2019 Tax Rate Bylaw.
Respectfully Submitted,
Submitted by:
Michael Dillabaugh, CPA, CA, Director of Finance
Concurrence:
Matthew Baldwin, MCIP, RPP Director of Planning
Concurrence:
Michelle Mahovlich, P.Eng, P.Geo, Director of Engineering
Concurrence:
Braden Hutchins, Director of Corporate Services
Concurrence:
Darren Kiedyk, Chief Administrative Officer
Exhibit A — Revenue Summary (Five Year Financial Plan for: 2019-2023)
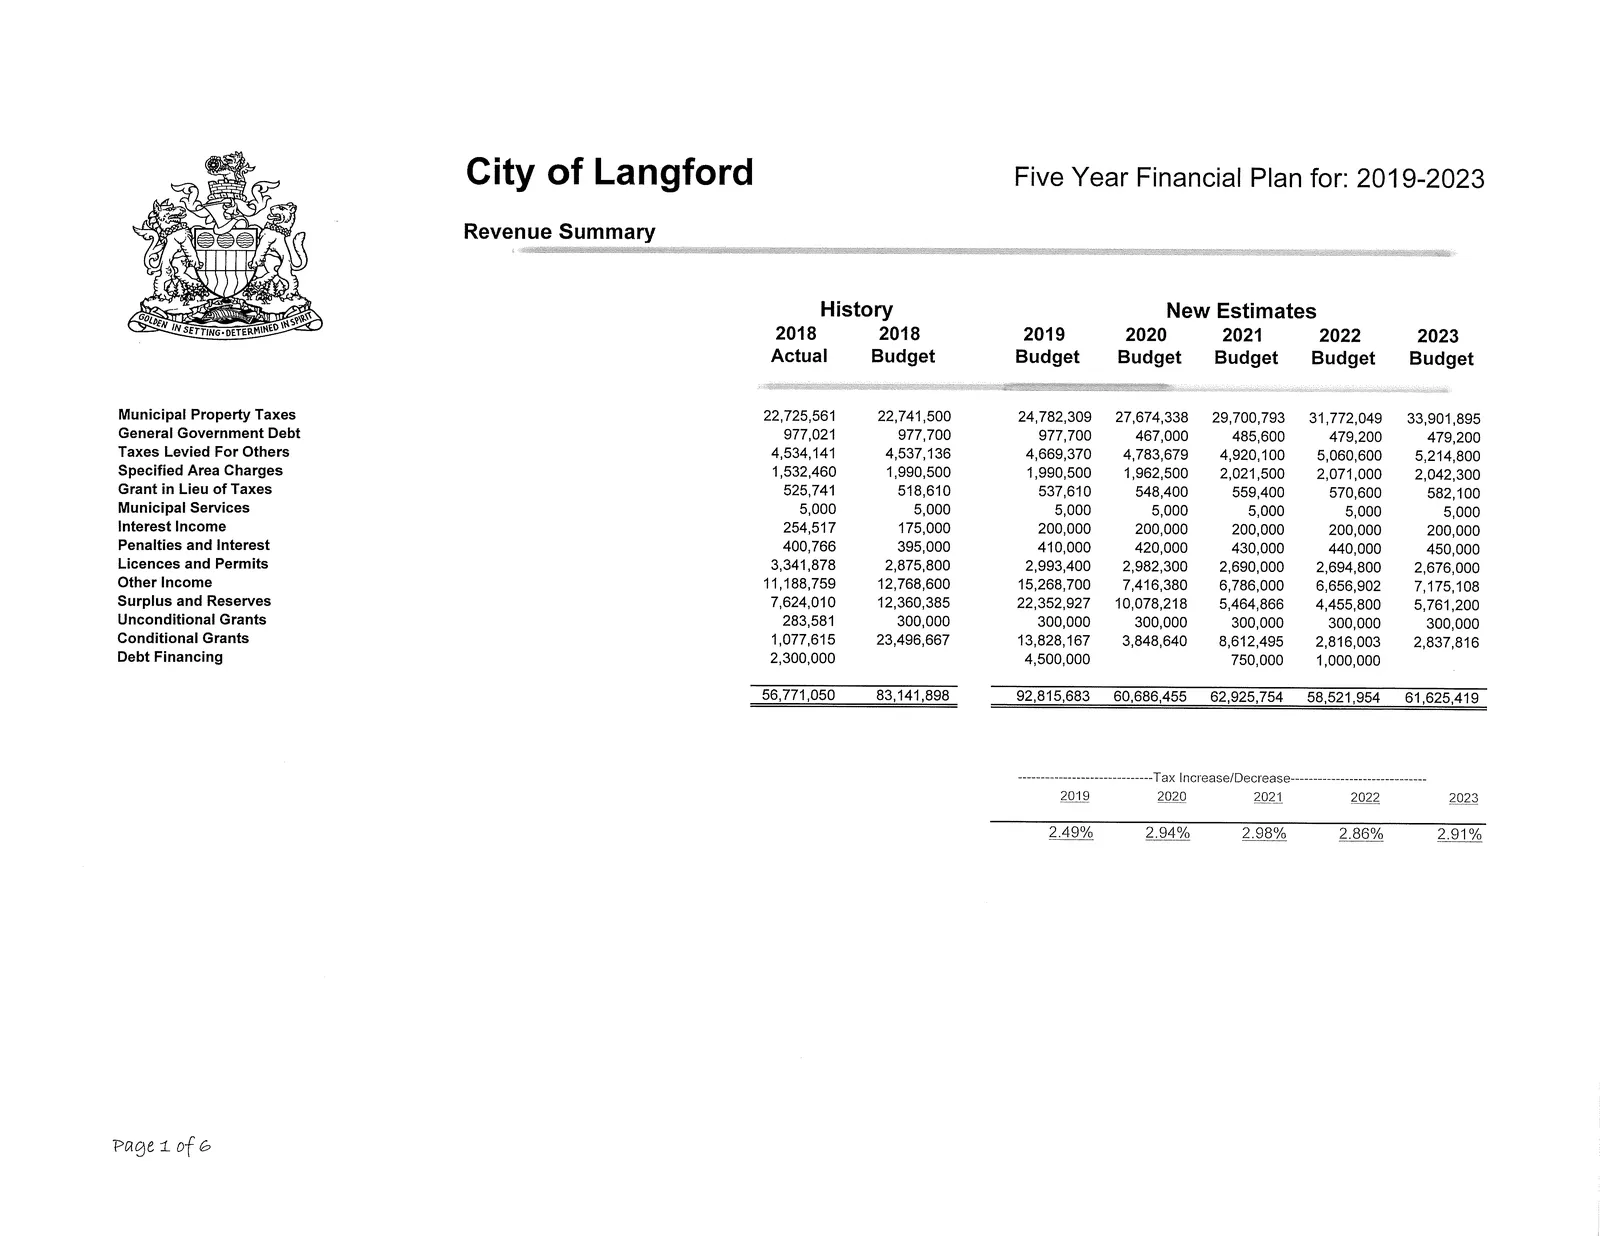
Revenue Summary (Amounts by Year)
| Revenue Source | 2018 Actual | 2018 Budget | 2019 Budget | 2020 Budget | 2021 Budget | 2022 Budget | 2023 Budget |
|---|---|---|---|---|---|---|---|
| Municipal Property Taxes | 22,725,561 | 22,741,500 | 24,782,309 | 27,674,338 | 29,700,793 | 31,772,049 | 33,901,895 |
| General Government Debt | 977,021 | 977,700 | 977,700 | 467,000 | 485,600 | 479,200 | 479,200 |
| Taxes Levied For Others | 4,534,141 | 4,537,136 | 4,669,370 | 4,783,679 | 4,920,100 | 5,060,600 | 5,214,800 |
| Specified Area Charges | 1,532,460 | 1,990,500 | 1,990,500 | 1,962,500 | 2,021,500 | 2,071,000 | 2,042,300 |
| Grant in Lieu of Taxes | 525,741 | 518,610 | 537,610 | 548,400 | 559,400 | 570,600 | 582,100 |
| Municipal Services | 5,000 | 5,000 | 5,000 | 5,000 | 5,000 | 5,000 | 5,000 |
| Interest Income | 254,517 | 175,000 | 200,000 | 200,000 | 200,000 | 200,000 | 200,000 |
| Penalties and Interest | 400,766 | 395,000 | 410,000 | 420,000 | 430,000 | 440,000 | 450,000 |
| Licences and Permits | 3,341,878 | 2,875,800 | 2,993,400 | 2,982,300 | 2,690,000 | 2,694,800 | 2,676,000 |
| Other Income | 11,188,759 | 12,768,600 | 15,268,700 | 7,416,380 | 6,786,000 | 6,656,902 | 7,175,108 |
| Surplus and Reserves | 7,624,010 | 12,360,385 | 22,352,927 | 10,078,218 | 5,464,866 | 4,455,800 | 5,761,200 |
| Unconditional Grants | 283,581 | 300,000 | 300,000 | 300,000 | 300,000 | 300,000 | 300,000 |
| Conditional Grants | 1,077,615 | 23,496,667 | 13,828,167 | 3,848,640 | 8,612,495 | 2,816,003 | 2,837,816 |
| Debt Financing | 2,300,000 | 4,500,000 | 750,000 | 1,000,000 | — | — | — |
| Total | 56,771,050 | 83,141,898 | 92,815,683 | 60,686,455 | 62,925,754 | 58,521,954 | 61,625,419 |
Tax Increase/Decrease:
- 2019: 2.49%
- 2020: 2.94%
- 2021: 2.98%
- 2022: 2.86%
- 2023: 2.91%
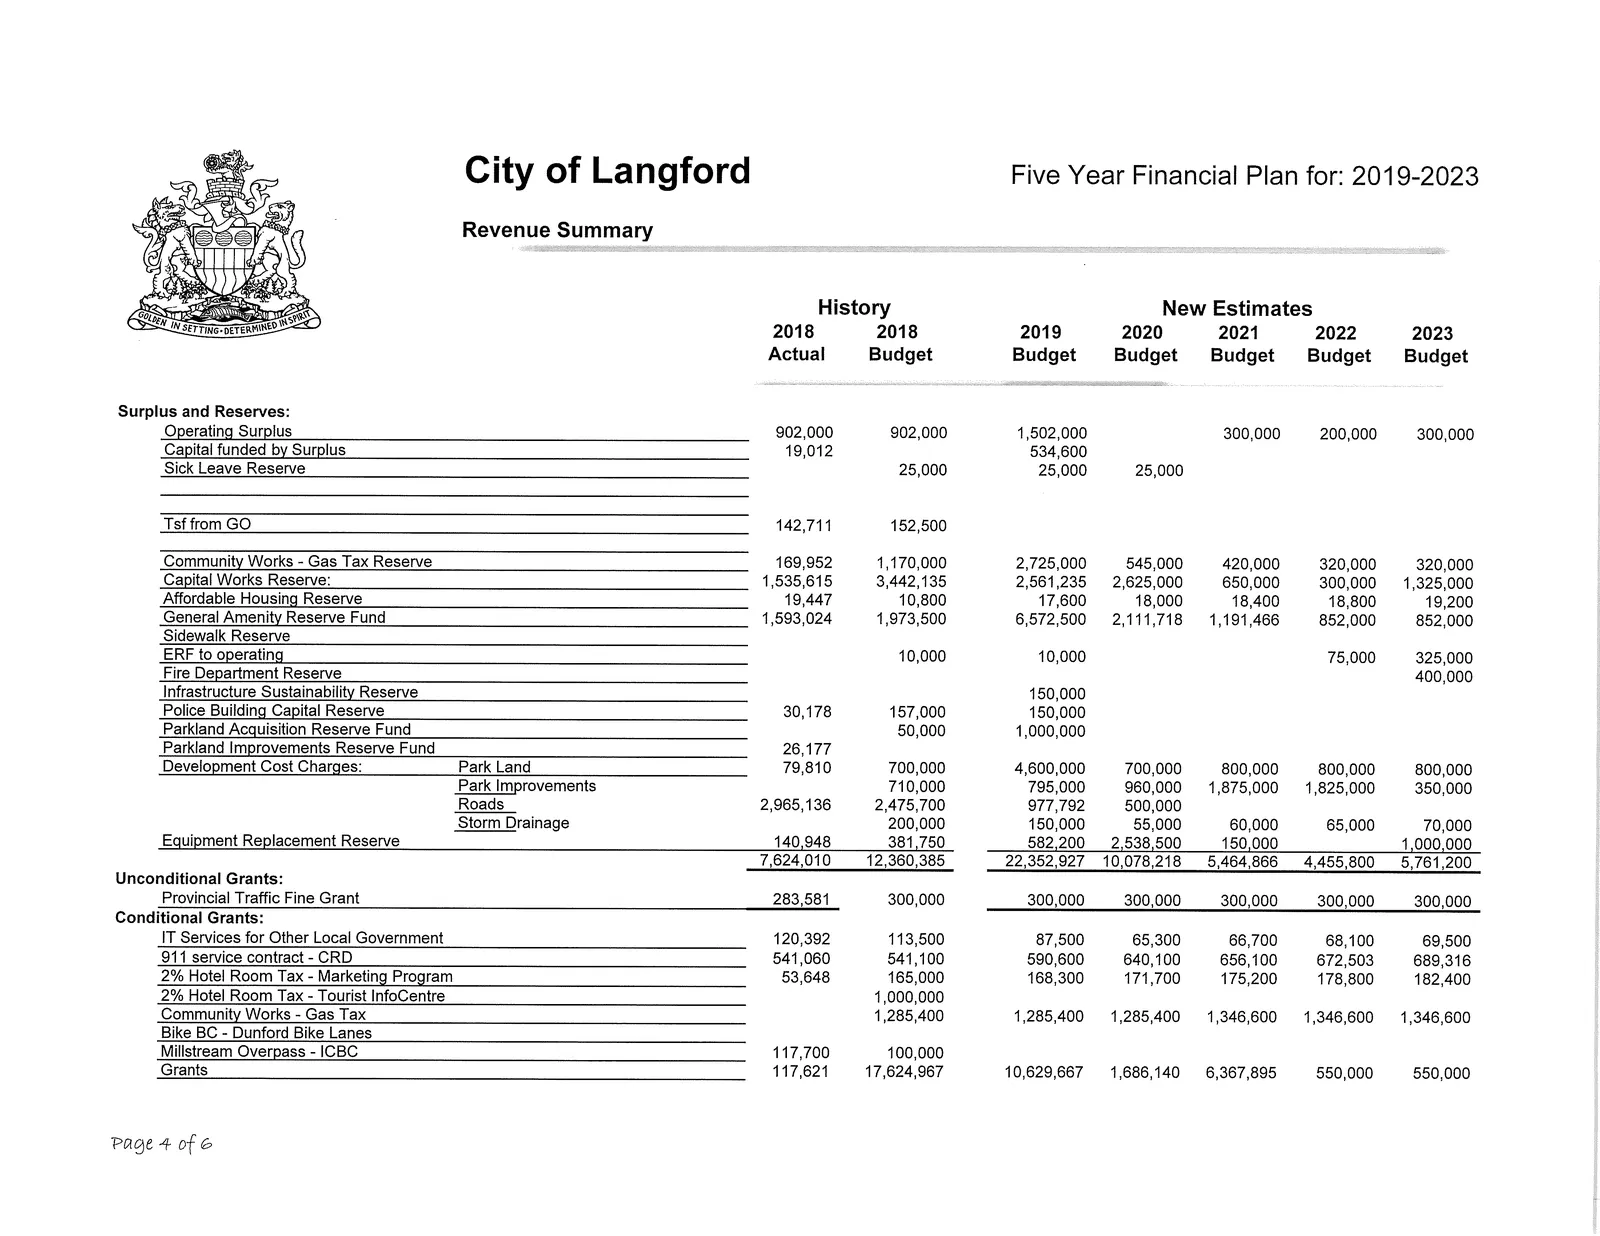
Surplus and Reserves / Grants (Selected entries)
| Reserve / Grant | 2018 Actual | 2018 Budget | 2019 Budget | 2020 Budget | 2021 Budget | 2022 Budget | 2023 Budget |
|---|---|---|---|---|---|---|---|
| Operating Surplus | 902,000 | 902,000 | 1,502,000 | 300,000 | 200,000 | 300,000 | — |
| Capital funded by Surplus | 19,012 | 534,600 | — | — | — | — | — |
| Sick Leave Reserve | 25,000 | 25,000 | 25,000 | — | 152,500 | — | — |
| Tsf from GO | 142,711 | 1,170,000 | 2,725,000 | 545,000 | 420,000 | 320,000 | 320,000 |
| Community Works - Gas Tax Reserve | 169,952 | — | — | — | — | — | — |
| Capital Works Reserve | 1,535,615 | 3,442,135 | 2,561,235 | 2,625,000 | 650,000 | 300,000 | 1,325,000 |
| General Amenity Reserve Fund | 1,593,024 | 1,973,500 | 6,572,500 | 2,111,718 | 1,191,466 | 852,000 | 852,000 |
| Parkland Acquisition Reserve Fund | — | 50,000 | 1,000,000 | — | — | — | — |
| Parkland Improvements Reserve Fund | 26,177 | — | — | — | — | — | — |
| Development Cost Charges - Park Land | 79,810 | 700,000 | 4,600,000 | 700,000 | 800,000 | 800,000 | 800,000 |
| Equipment Replacement Reserve | 140,948 | 381,750 | 582,200 | 2,538,500 | 150,000 | 1,000,000 | — |
| Total Surplus & Reserves | 7,624,010 | 12,360,385 | 22,352,927 | 10,078,218 | 5,464,866 | 4,455,800 | 5,761,200 |
Grants (Selected)
| Grant / Program | 2018 Actual | 2018 Budget | 2019 Budget | 2020 Budget | 2021 Budget | 2022 Budget | 2023 Budget |
|---|---|---|---|---|---|---|---|
| Provincial Traffic Fine Grant | 283,581 | 300,000 | 300,000 | 300,000 | 300,000 | 300,000 | 300,000 |
| 911 service contract - CRD | 541,060 | 541,100 | 590,600 | 640,100 | 656,100 | 672,503 | 689,316 |
| 2% Hotel Room Tax - Marketing Program | 53,648 | 165,000 | 168,300 | 171,700 | 175,200 | 178,800 | 182,400 |
| Community Works - Gas Tax | 1,285,400 | 1,285,400 | 1,285,400 | 1,346,600 | 1,346,600 | 1,346,600 | — |
| Grants (other) | 117,621 | 17,624,967 | 10,629,667 | 1,686,140 | 6,367,895 | 550,000 | 550,000 |
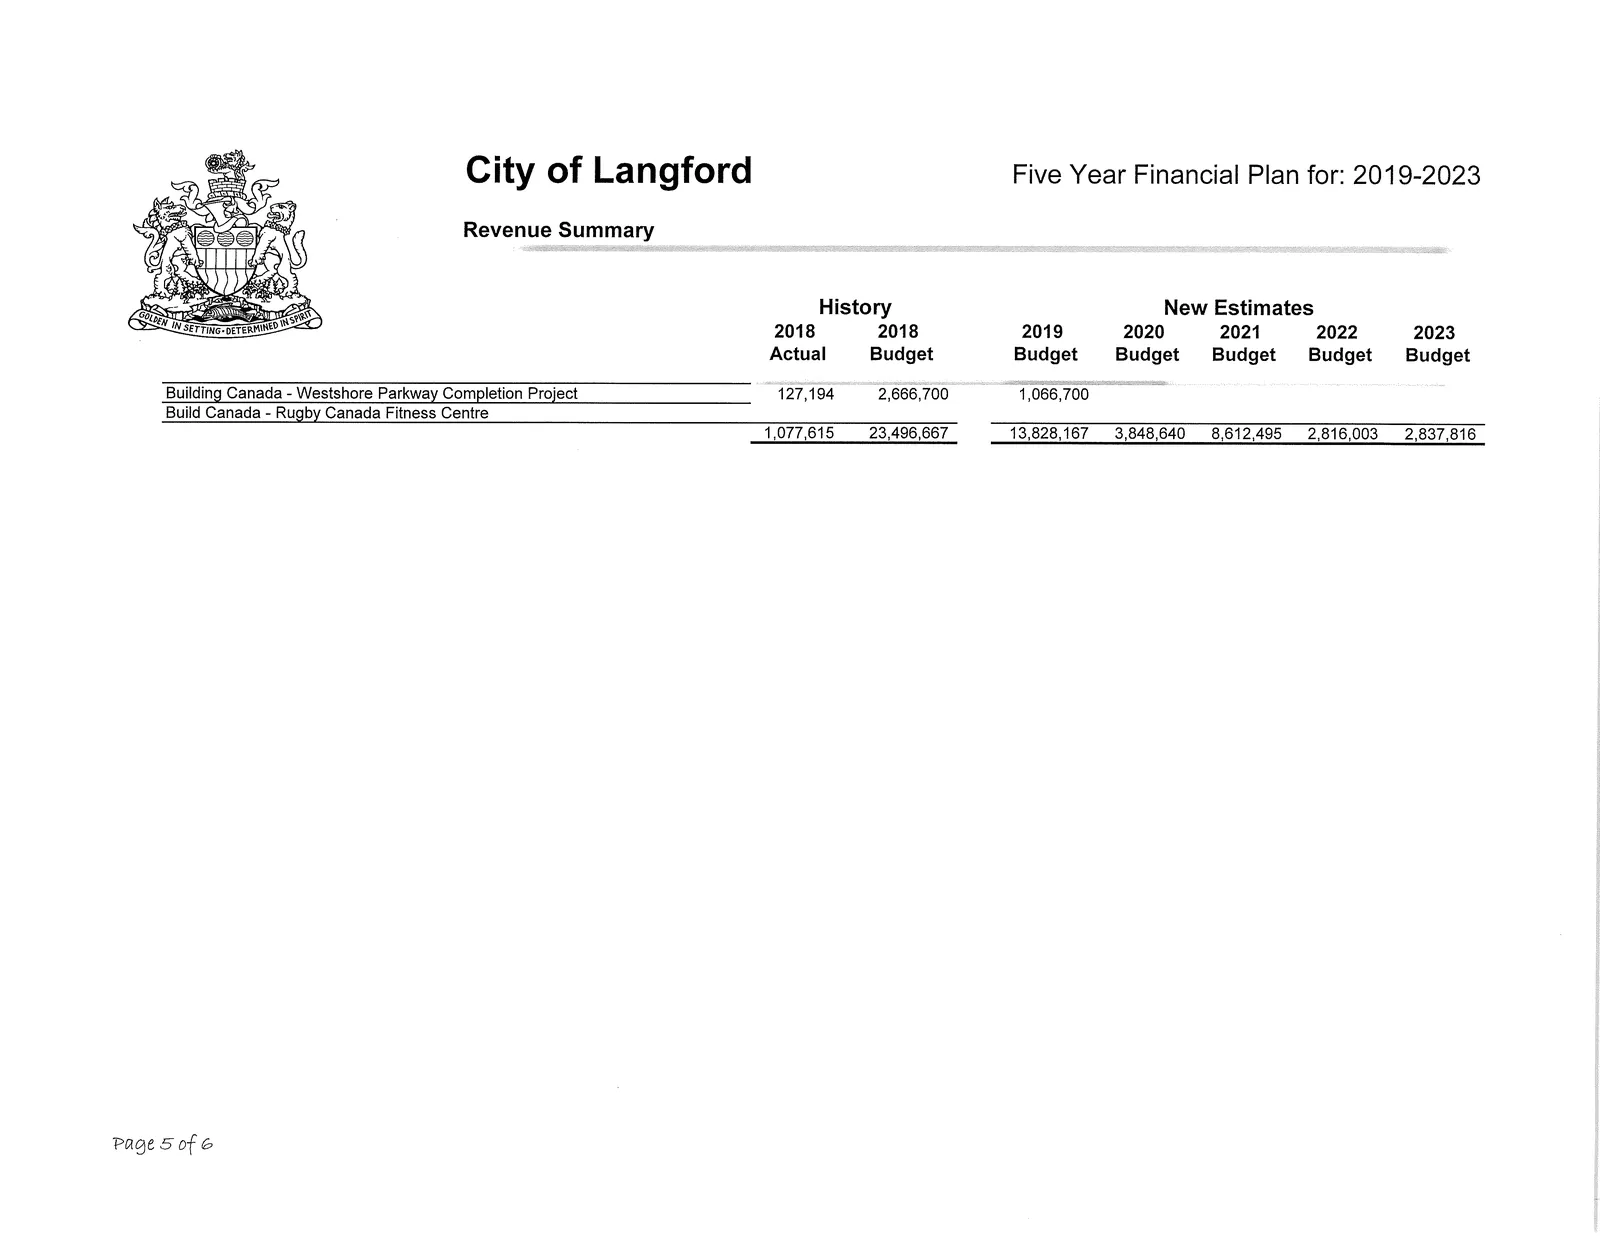
Building Canada / Major Grants
| Project | 2018 Actual | 2018 Budget | 2019 Budget | 2020 Budget | 2021 Budget | 2022 Budget | 2023 Budget |
|---|---|---|---|---|---|---|---|
| Building Canada - Westshore Parkway Completion Project | 127,194 | 2,666,700 | 1,066,700 | — | — | — | — |
| Build Canada - Rugby Canada Fitness Centre | 1,077,615 | — | 23,496,667 | 13,828,167 | 3,848,640 | 8,612,495 | 2,816,003 |
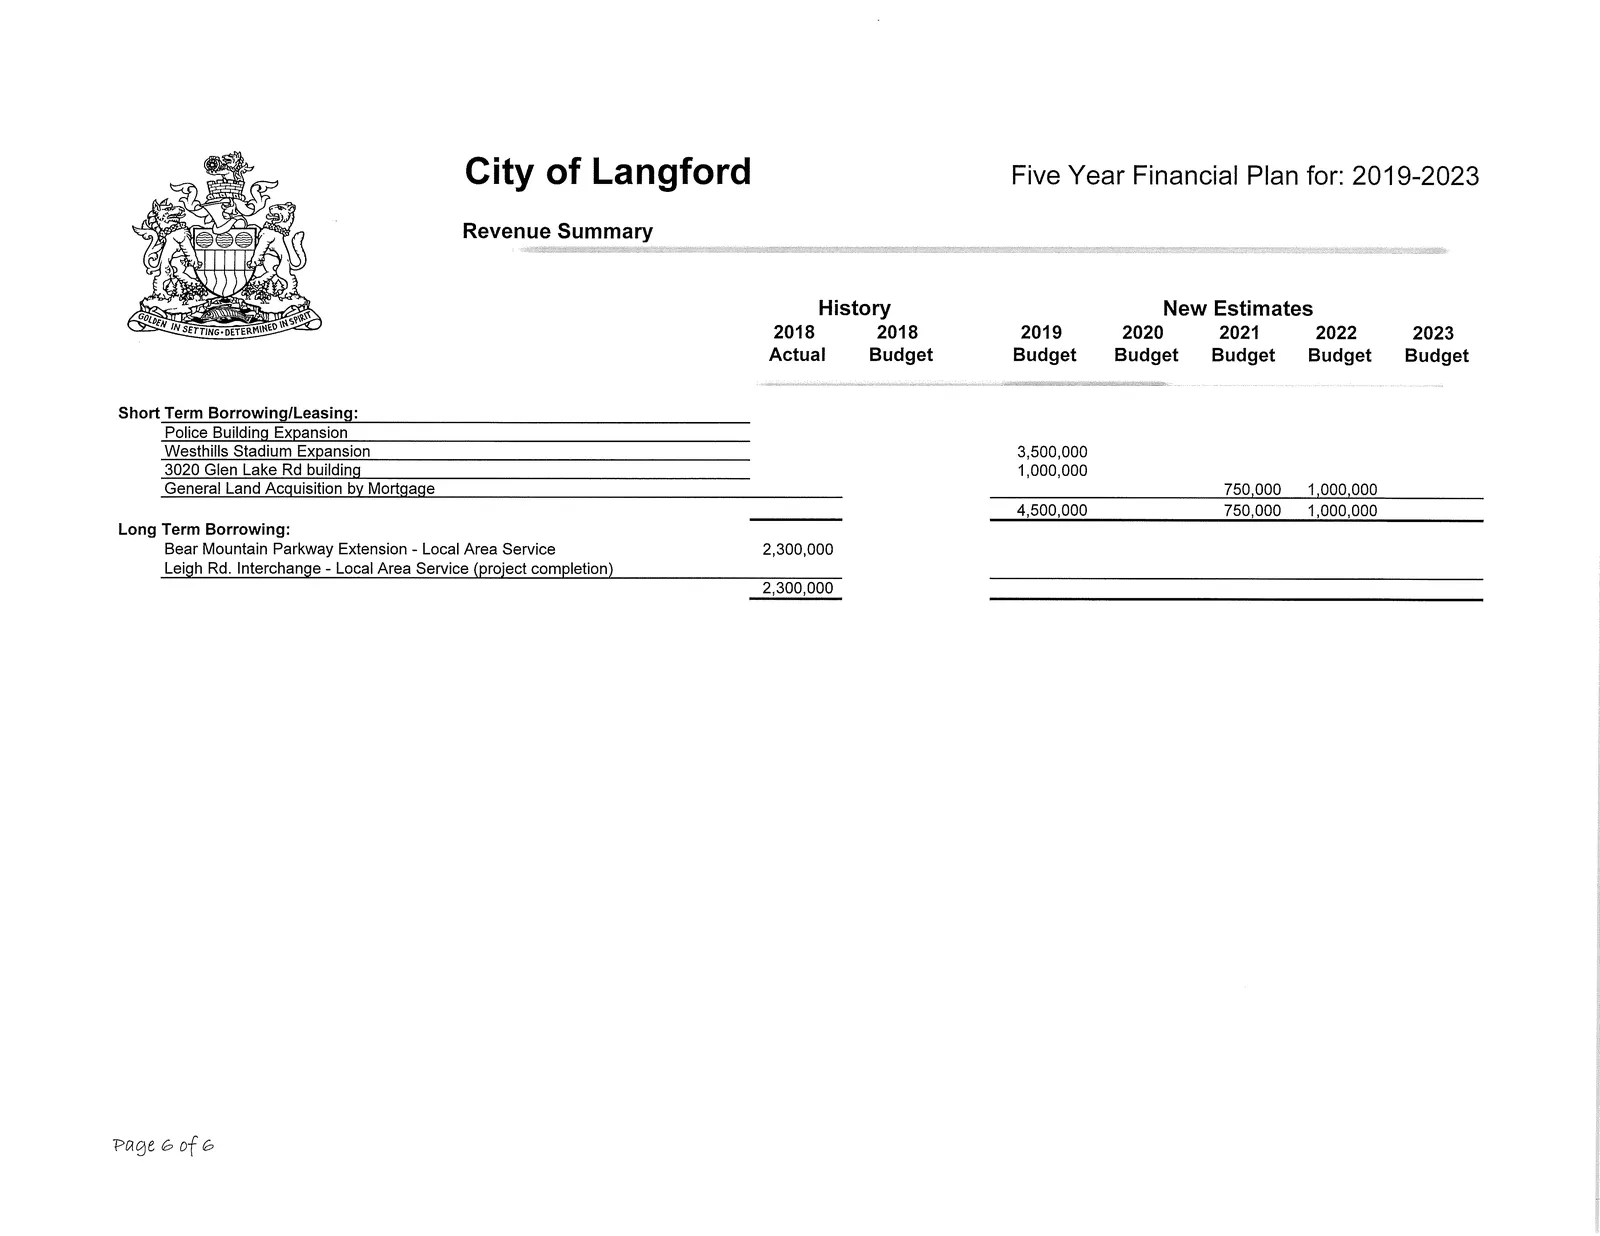
Borrowing (Selected)
- Short Term Borrowing / Leasing planned:
- 2019: 750,000
- 2020: 1,000,000
- Police Building Expansion, Westhills Stadium Expansion: 3,500,000 (future)
- 3020 Glen Lake Rd building: 1,000,000
- General Land Acquisition by Mortgage: 4,500,000
- Long Term Borrowing:
- Bear Mountain Parkway Extension - Local Area Service (completion): 2,300,000
- Leigh Rd. Interchange - Local Area Service (project completion): 2,300,000
Expense Summary (Five Year Financial Plan for: 2019-2023)
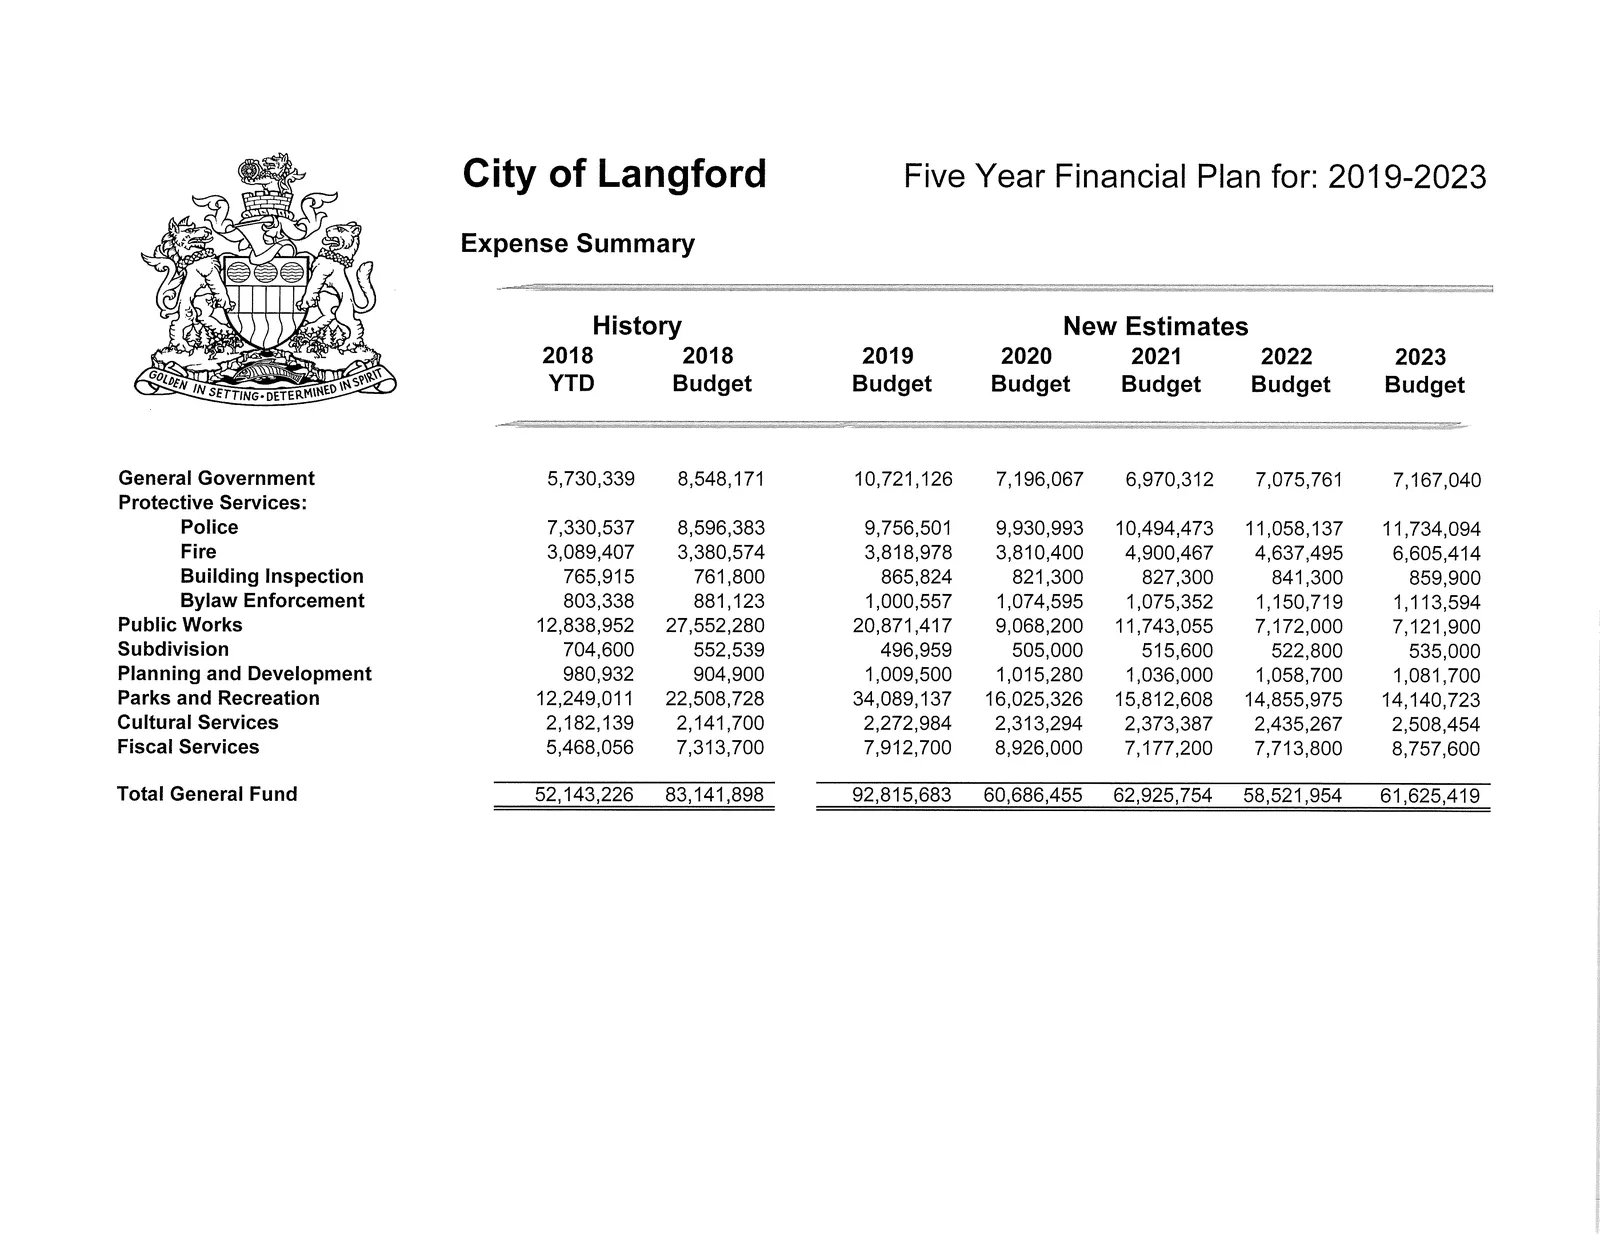
Expense Summary (Selected totals)
| Department / Area | 2018 Actual | 2018 Budget | 2019 Budget | 2020 Budget | 2021 Budget | 2022 Budget | 2023 Budget |
|---|---|---|---|---|---|---|---|
| General Government | 5,730,339 | 8,548,171 | 10,721,126 | 7,196,067 | 6,970,312 | 7,075,761 | 7,167,040 |
| Protective Services - Police | 7,330,537 | 8,596,383 | 9,756,501 | 9,930,993 | 10,494,473 | 11,058,137 | 11,734,094 |
| Protective Services - Fire | 3,089,407 | 3,380,574 | 3,818,978 | 3,810,400 | 4,900,467 | 4,637,495 | 6,605,414 |
| Building Inspection | 765,915 | 761,800 | 865,824 | 821,300 | 827,300 | 841,300 | 859,900 |
| Bylaw Enforcement | 803,338 | 881,123 | 1,000,557 | 1,074,595 | 1,075,352 | 1,150,719 | 1,113,594 |
| Public Works | 12,838,952 | 27,552,280 | 20,871,417 | 9,068,200 | 11,743,055 | 7,172,000 | 7,121,900 |
| Subdivision | 704,600 | 552,539 | 496,959 | 505,000 | 515,600 | 522,800 | 535,000 |
| Planning and Development | 980,932 | 904,900 | 1,009,500 | 1,015,280 | 1,036,000 | 1,058,700 | 1,081,700 |
| Parks and Recreation | 12,249,011 | 22,508,728 | 34,089,137 | 16,025,326 | 15,812,608 | 14,855,975 | 14,140,723 |
| Cultural Services | 2,182,139 | 2,141,700 | 2,272,984 | 2,313,294 | 2,373,387 | 2,435,267 | 2,508,454 |
| Fiscal Services | 5,468,056 | 7,313,700 | 7,912,700 | 8,926,000 | 7,177,200 | 7,713,800 | 8,757,600 |
| Total General Fund | 52,143,226 | 83,141,898 | 92,815,683 | 60,686,455 | 62,925,754 | 58,521,954 | 61,625,419 |
General Government Expenditures
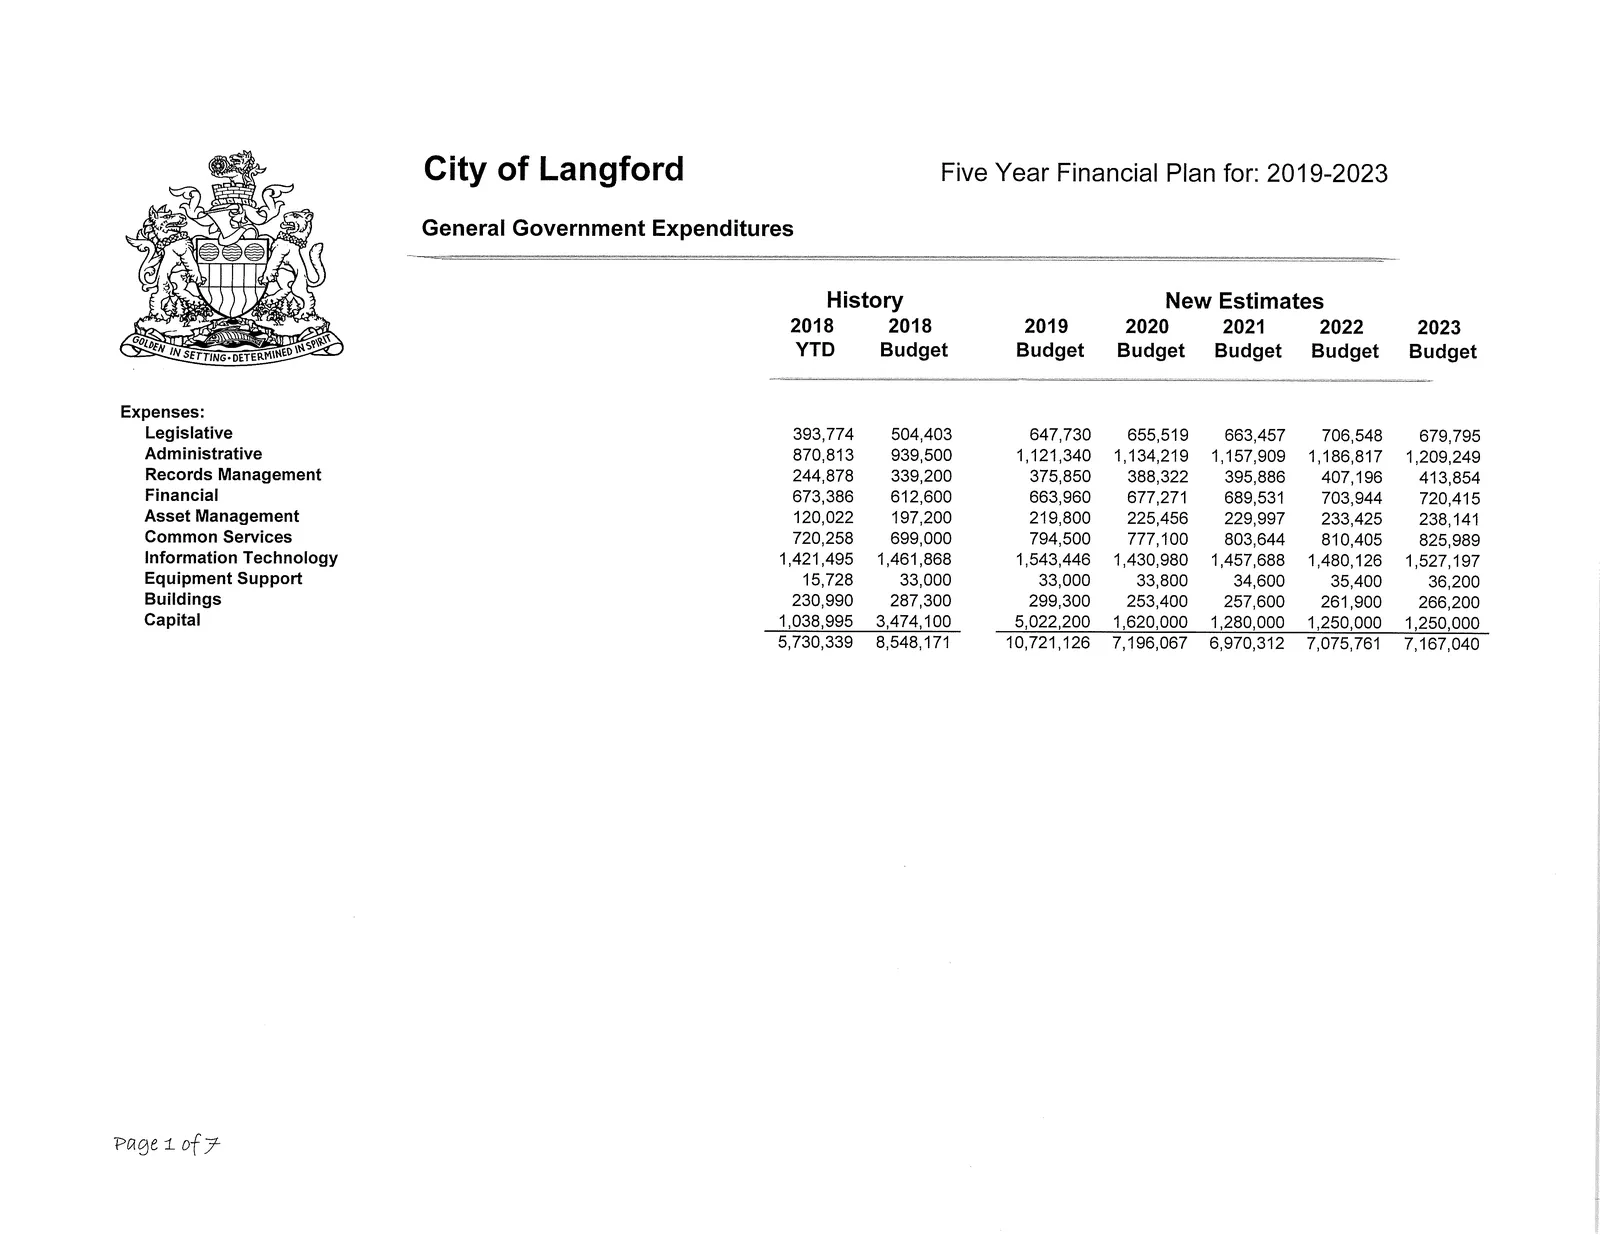
General Government — Summary by Category
| Category | 2018 Actual | 2018 Budget | 2019 Budget | 2020 Budget | 2021 Budget | 2022 Budget | 2023 Budget |
|---|---|---|---|---|---|---|---|
| Legislative | 393,774 | 504,403 | 647,730 | 655,519 | 663,457 | 706,548 | 679,795 |
| Administrative | 870,813 | 939,500 | 1,121,340 | 1,134,219 | 1,157,909 | 1,186,817 | 1,209,249 |
| Records Management | 244,878 | 339,200 | 375,850 | 388,322 | 395,886 | 407,196 | 413,854 |
| Financial | 673,386 | 612,600 | 663,960 | 677,271 | 689,531 | 703,944 | 720,415 |
| Asset Management | 120,022 | 197,200 | 219,800 | 225,456 | 229,997 | 233,425 | 238,141 |
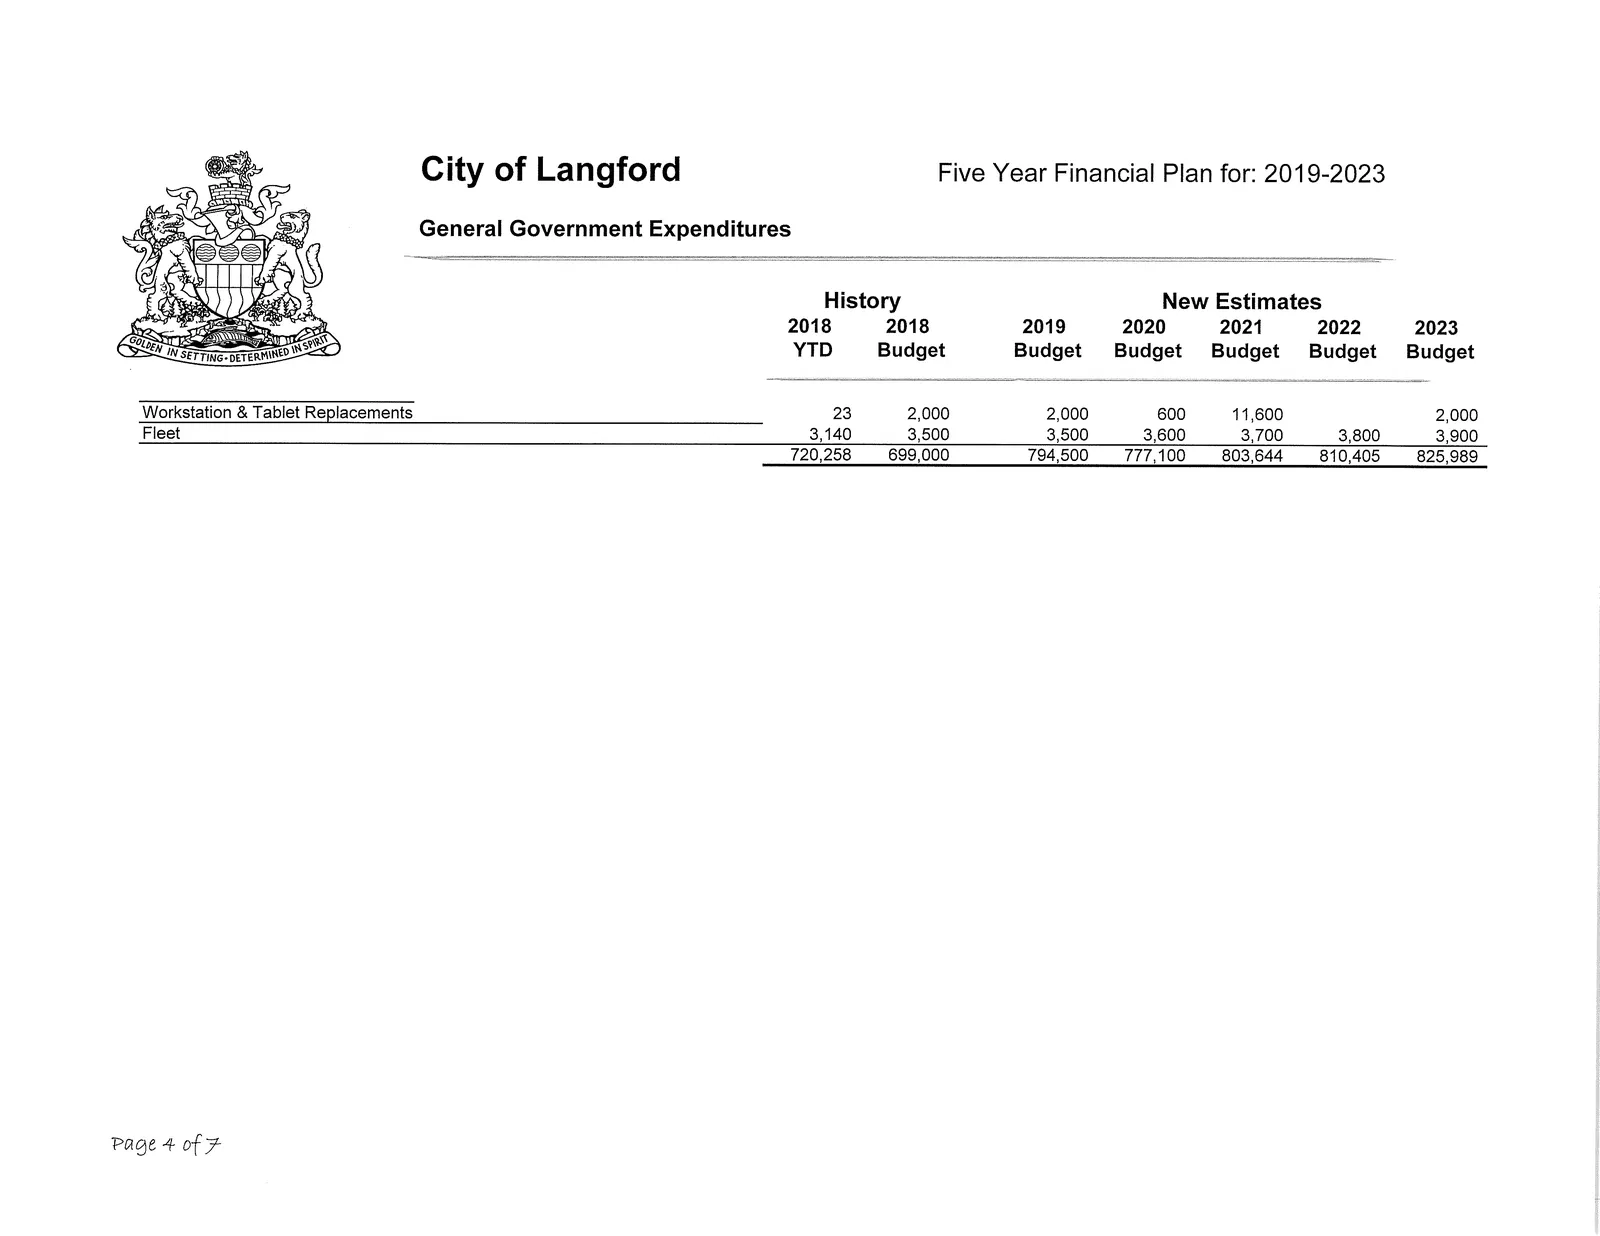
| Common Services | 720,258 | 699,000 | 794,500 | 777,100 | 803,644 | 810,405 | 825,989 |
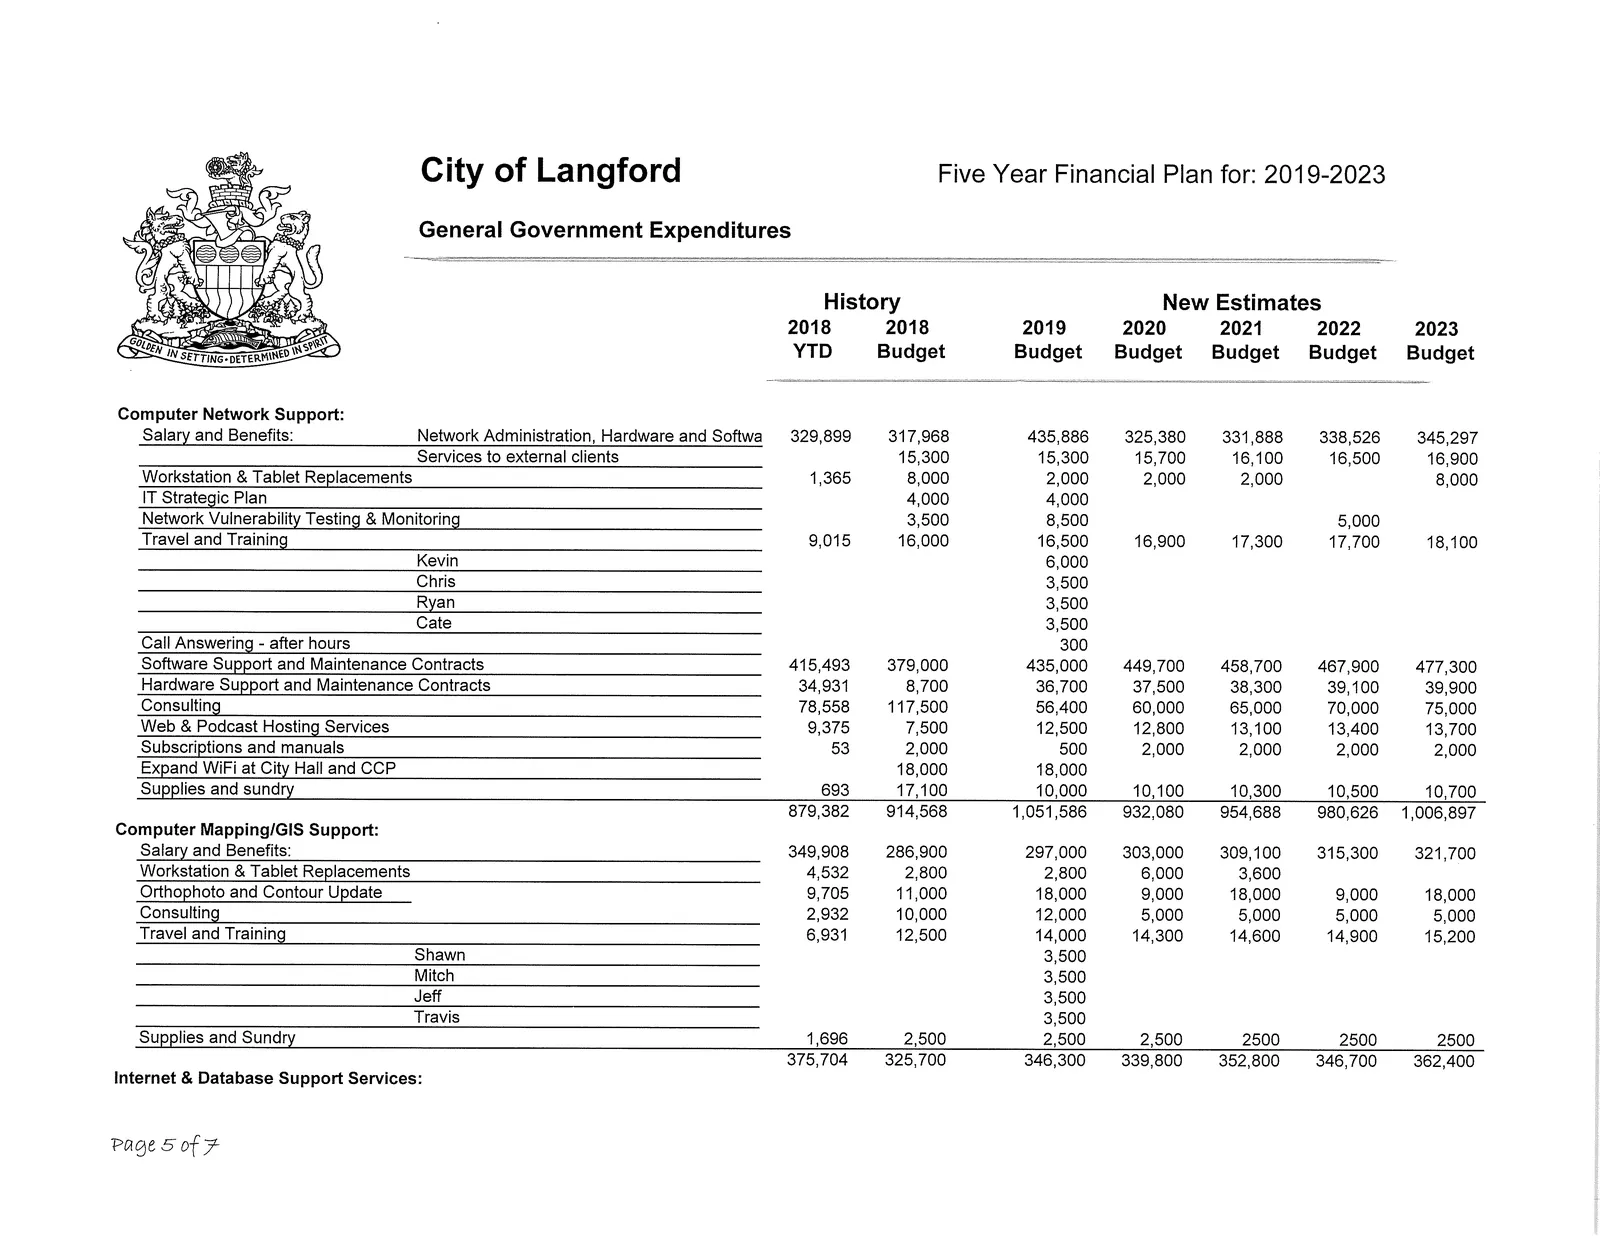
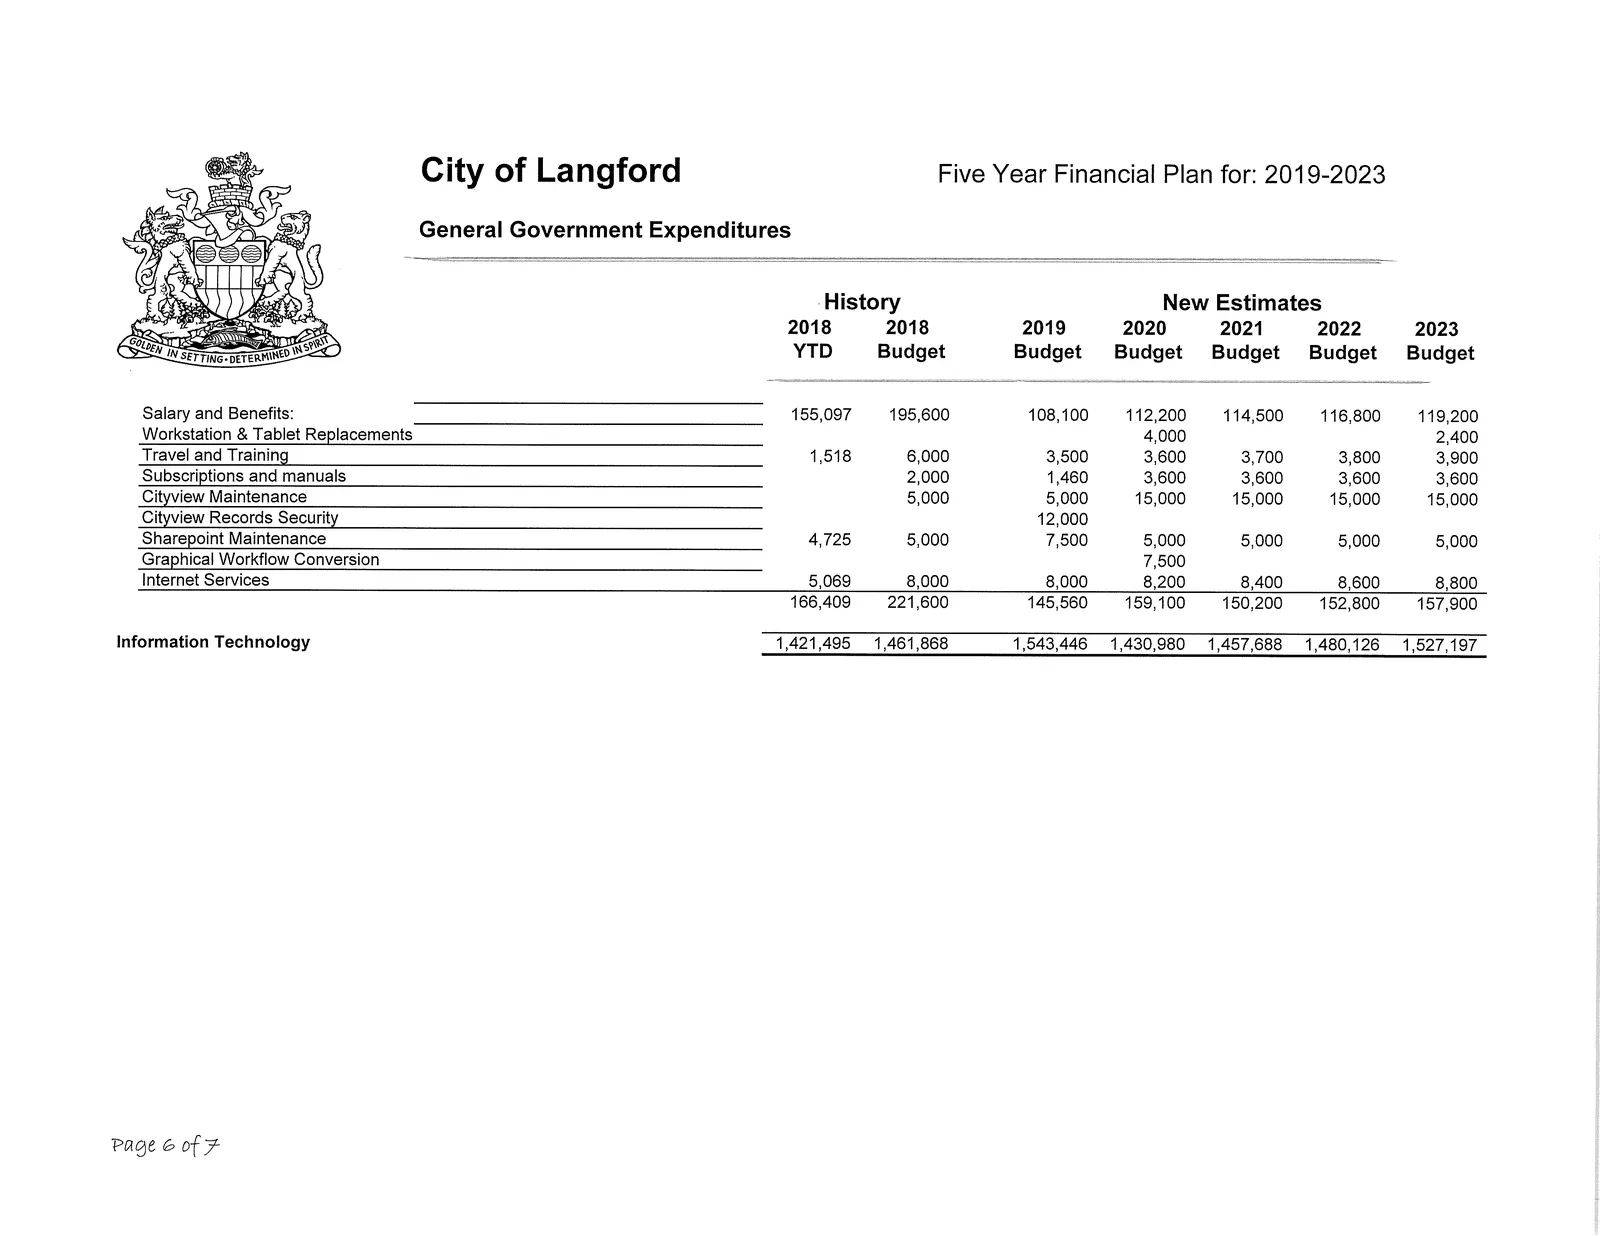
| Information Technology | 1,421,495 | 1,461,868 | 1,543,446 | 1,430,980 | 1,457,688 | 1,480,126 | 1,527,197 |
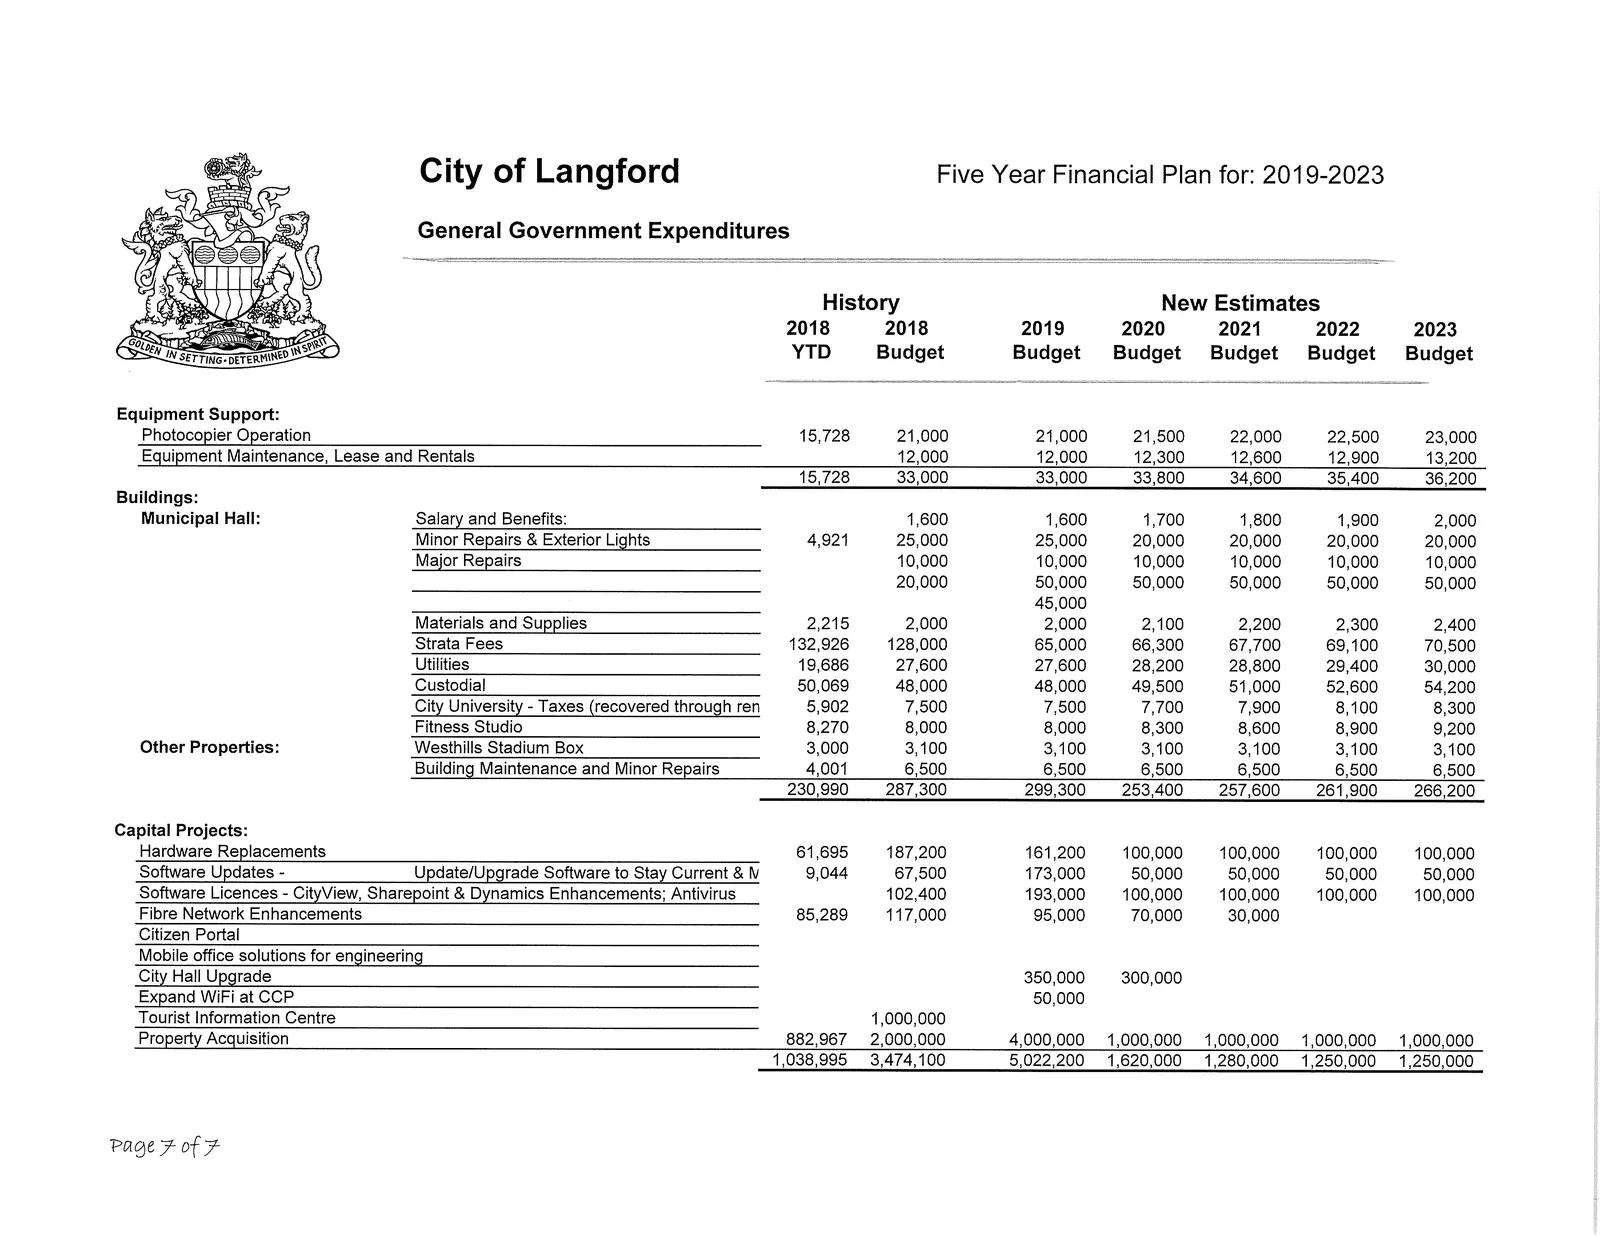
| Equipment Support | 15,728 | 33,000 | 33,000 | 33,800 | 34,600 | 35,400 | 36,200 |
| Buildings | 230,990 | 287,300 | 299,300 | 253,400 | 257,600 | 261,900 | 266,200 |
| Capital | 1,038,995 | 3,474,100 | 5,022,200 | 1,620,000 | 1,280,000 | 1,250,000 | 1,250,000 |
| Total General Government | 5,730,339 | 8,548,171 | 10,721,126 | 7,196,067 | 6,970,312 | 7,075,761 | 7,167,040 |
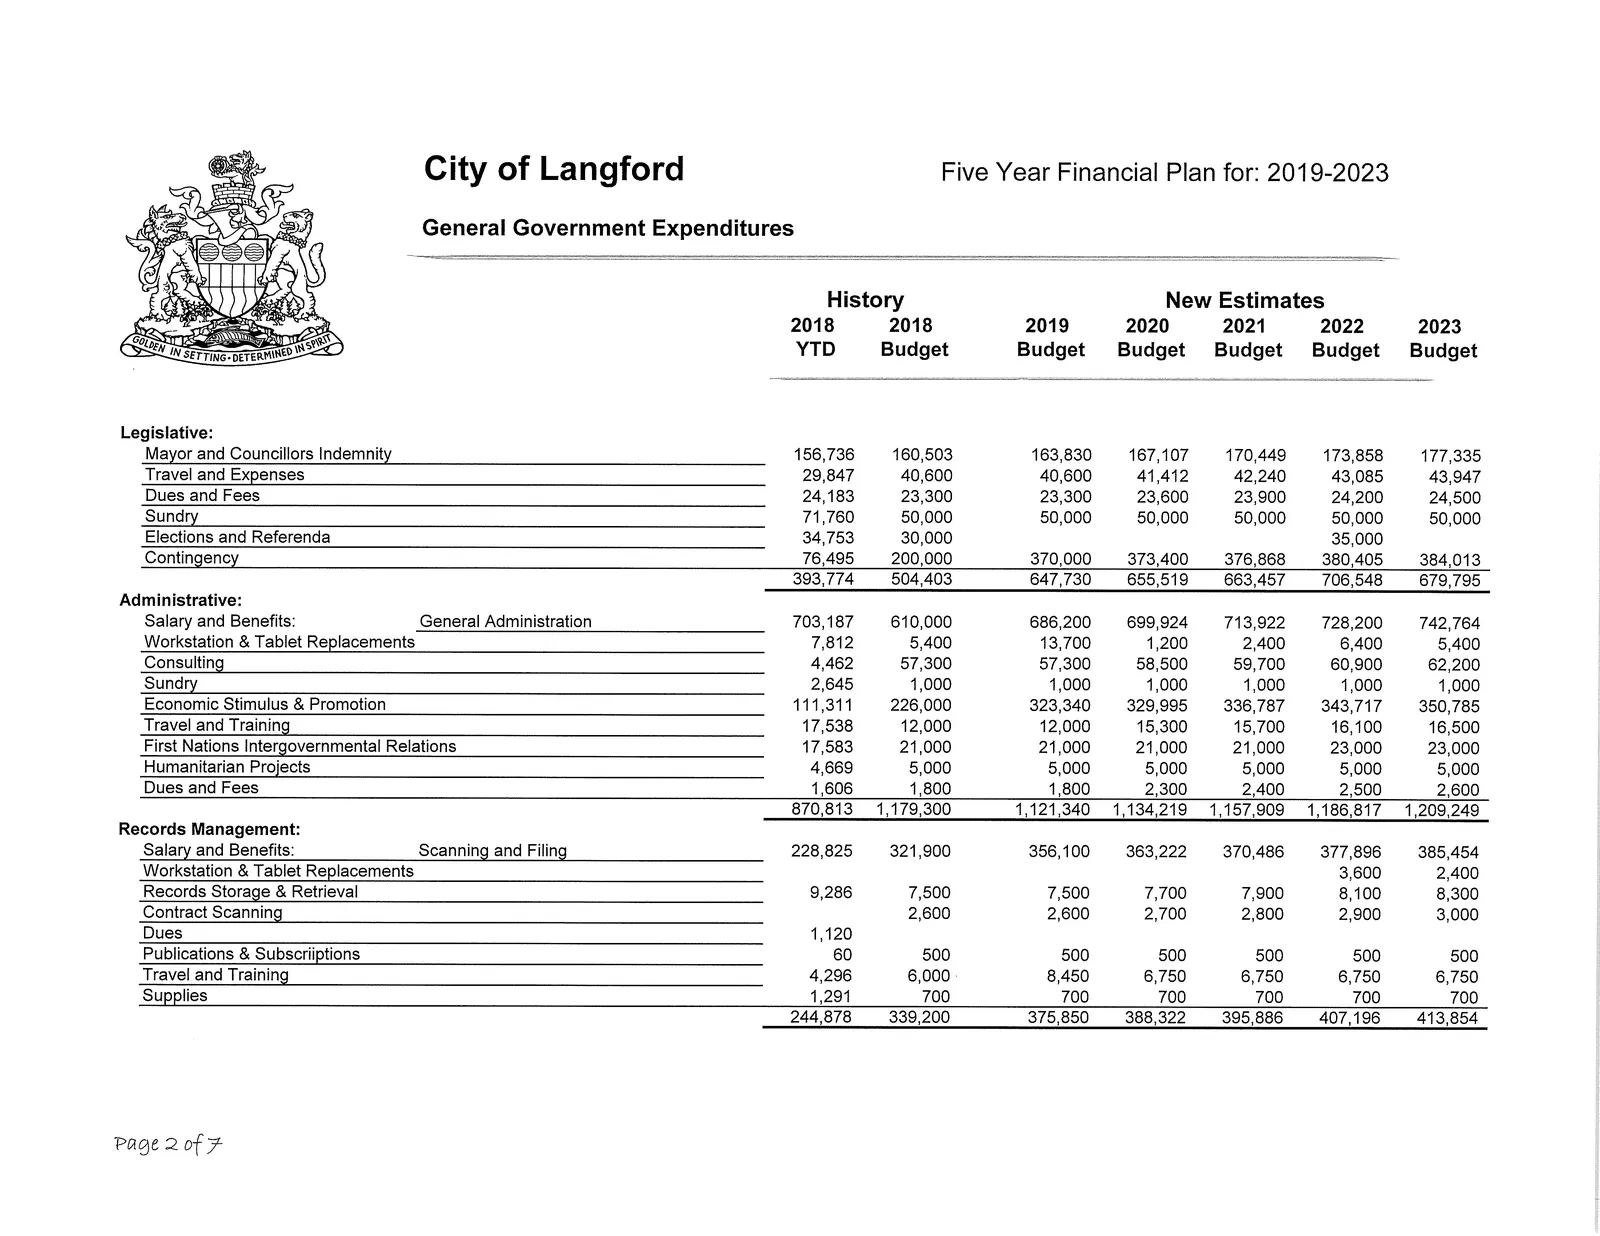
Legislative (selected items)
| Item | 2018 Actual | 2018 Budget | 2019 Budget | 2020 | 2021 | 2022 | 2023 |
|---|---|---|---|---|---|---|---|
| Mayor and Councillors Indemnity | 156,736 | 160,503 | 163,830 | 167,107 | 170,449 | 173,858 | 177,335 |
| Travel and Expenses | 29,847 | 40,600 | 40,600 | 41,412 | 42,240 | 43,085 | 43,947 |
| Dues and Fees | 24,183 | 23,300 | 23,300 | 23,600 | 23,900 | 24,200 | 24,500 |
| Sundry | 71,760 | 50,000 | 50,000 | 50,000 | 50,000 | 50,000 | 50,000 |
| Elections and Referenda | 34,753 | 30,000 | 35,000 | — | — | — | — |
| Contingency | 76,495 | 200,000 | 370,000 | 373,400 | 376,868 | 380,405 | 384,013 |
Administrative (selected items)
| Item | 2018 Actual | 2018 Budget | 2019 Budget | 2020 | 2021 | 2022 | 2023 |
|---|---|---|---|---|---|---|---|
| General Administration (Salary & Benefits) | 703,187 | 610,000 | 686,200 | 699,924 | 713,922 | 728,200 | 742,764 |
| Economic Stimulus & Promotion | 111,311 | 226,000 | 323,340 | 329,995 | 336,787 | 343,717 | 350,785 |
| Travel and Training | 17,538 | 12,000 | 12,000 | 15,300 | 15,700 | 16,100 | 16,500 |
| First Nations Intergovernmental Relations | 17,583 | 21,000 | 21,000 | 21,000 | 21,000 | 23,000 | 23,000 |
Records Management (selected items)
| Item | 2018 Actual | 2018 Budget | 2019 Budget | 2020 | 2021 | 2022 | 2023 |
|---|---|---|---|---|---|---|---|
| Scanning and Filing (Salary & Benefits) | 228,825 | 321,900 | 356,100 | 363,222 | 370,486 | 377,896 | 385,454 |
| Records Storage & Retrieval | 9,286 | 7,500 | 7,500 | 7,700 | 7,900 | 8,100 | 8,300 |
| Contract Scanning | — | — | 2,600 | 2,700 | 2,800 | 2,900 | 3,000 |
| Travel and Training | 4,296 | 6,000 | 8,450 | 6,750 | 6,750 | 6,750 | 6,750 |
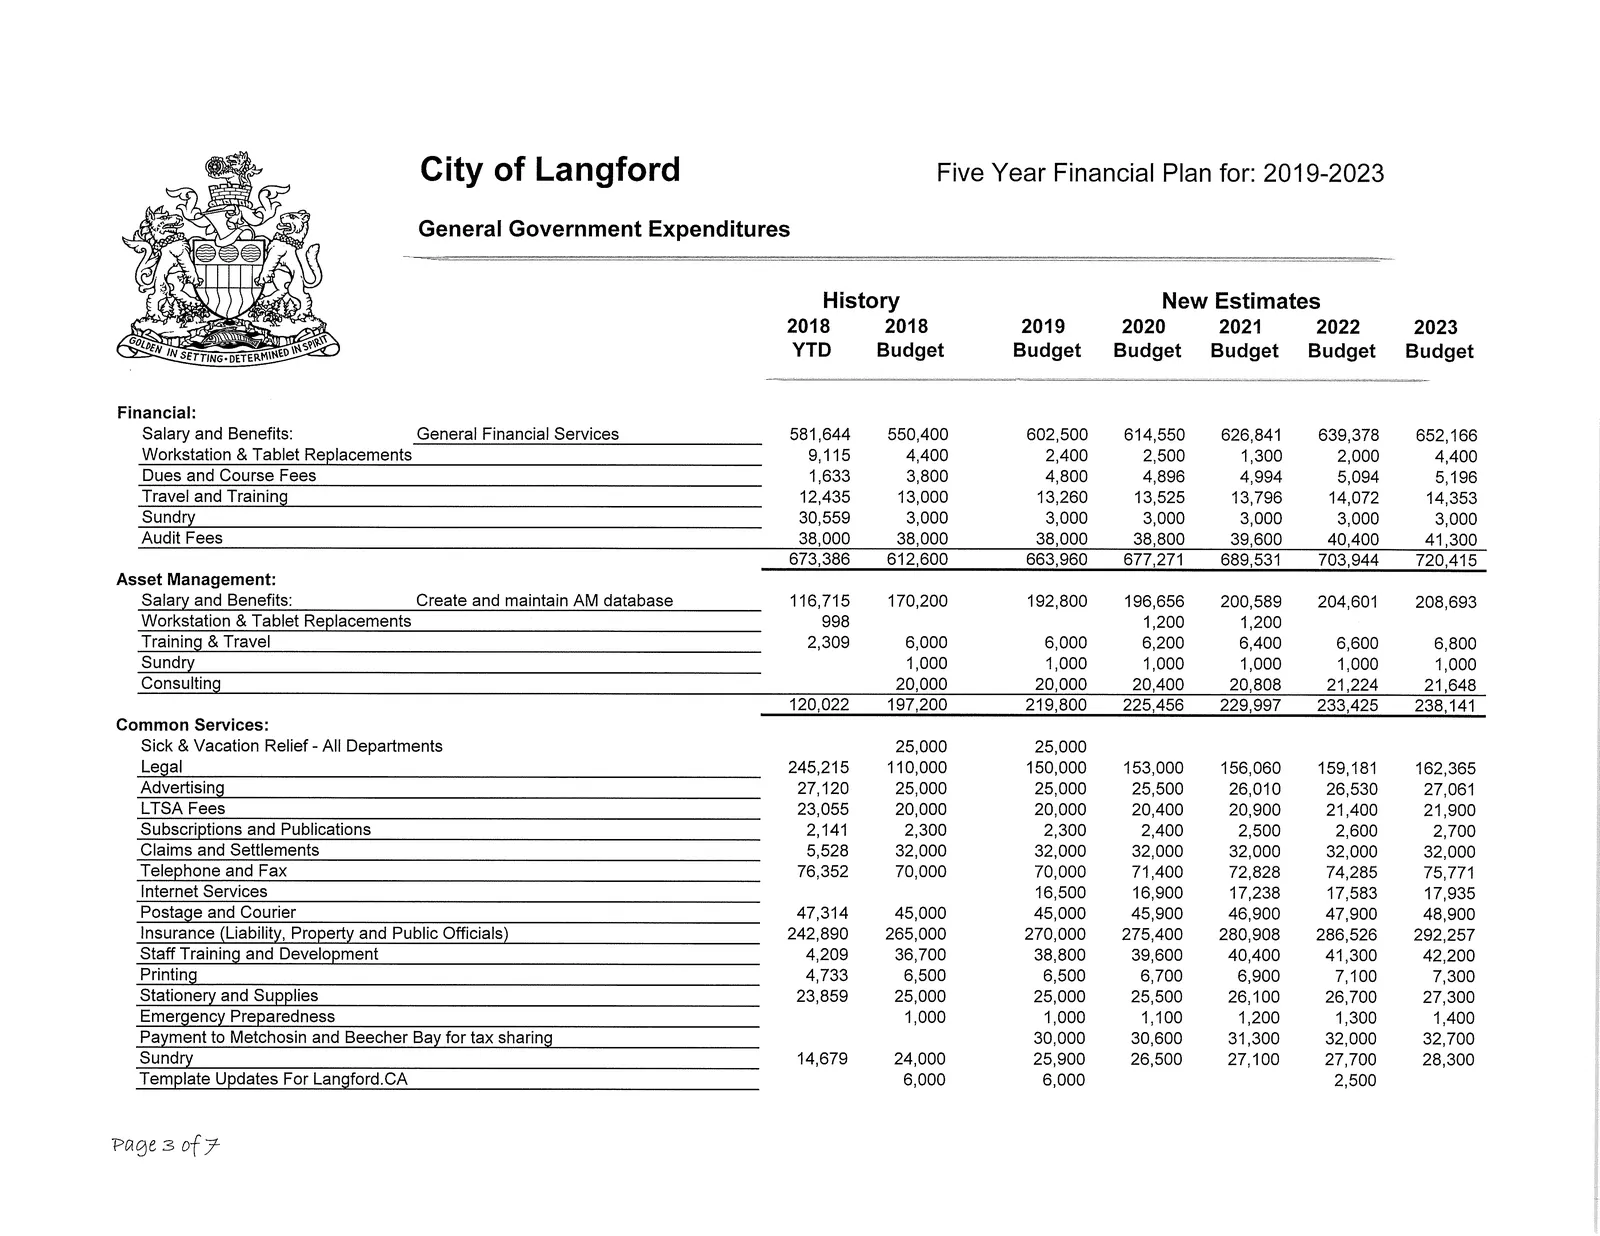
Financial and Asset Management (selected)
| Item | 2018 Actual | 2018 Budget | 2019 Budget |
|---|---|---|---|
| General Financial Services (Salary & Benefits) | 581,644 | 550,400 | 602,500 |
| Audit Fees | 38,000 | 38,000 | 38,800 |
| Asset Management - Create and maintain AM database (Salary & Benefits) | 116,715 | 170,200 | 192,800 |
| Asset Management - Consulting | — | 20,000 | 20,400 |
Common Services (selected)
- Legal (2018 Actual: 245,215; 2018 Budget: 110,000; 2019 Budget: 150,000)
- Insurance (Liability, Property and Public Officials) (2018 Actual: 242,890; 2019 Budget: 270,000)
- Telephone and Fax (2018 Actual: 76,352; 2019 Budget: 70,000)
- Payment to Metchosin and Beecher Bay for tax sharing (2018 Actual: 30,000; ongoing increases)
Information Technology (selected)
| Area | 2018 Actual | 2018 Budget | 2019 Budget | 2020 Budget |
|---|---|---|---|---|
| Computer Network Support (Salary & Benefits) | 329,899 | 317,968 | 435,886 | 325,380 |
| Software Support and Maintenance Contracts | 415,493 | 379,000 | 435,000 | 449,700 |
| Computer Mapping / GIS Support (Salary & Benefits) | 349,908 | 286,900 | 297,000 | 303,000 |
| Internet & Database Support Services (Salary & Benefits) | 155,097 | — | — | — |
Information Technology totals
- Information Technology Total:
- 2018 Actual: 1,421,495
- 2018 Budget: 1,461,868
- 2019 Budget: 1,543,446
Buildings (selected) and Capital Projects
| Item | 2018 Actual | 2018 Budget | 2019 Budget |
|---|---|---|---|
| Municipal Hall - Strata Fees | 132,926 | 128,000 | 65,000 |
| Utilities (Municipal Hall) | 19,686 | 27,600 | 27,600 |
| Custodial (Municipal Hall) | 50,069 | 48,000 | 48,000 |
| Hardware Replacements (Capital) | 61,695 | 187,200 | 161,200 |
| Software Updates / Licences (Capital) | 9,044 | 67,500 | 173,000 |
| Property Acquisition (Capital) | 882,967 | 2,000,000 | 4,000,000 |
| Capital Total (General Government) | 1,038,995 | 3,474,100 | 5,022,200 |
Protective Services — Police Expenditures
Police — Summary by Area
| Area | 2018 Actual | 2018 Budget | 2019 Budget | 2020 Budget | 2021 Budget | 2022 Budget | 2023 Budget |
|---|---|---|---|---|---|---|---|
| Administration | 908,168 | 921,278 | 1,200,770 | 1,299,863 | 1,325,936 | 1,352,529 | 1,379,652 |
| Police Services (RCMP Contract etc.) | 6,184,102 | 7,252,160 | 7,775,132 | 8,320,294 | 8,888,452 | 9,480,306 | 10,128,773 |
| Police Building (net Langford cost) | 208,089 | 230,945 | 220,999 | 235,618 | 225,119 | 225,302 | 225,669 |
| Police Building Capital Reserves / Capital Projects | 30,178 | 192,000 | 559,600 | 75,218 | 54,966 | — | — |
| Total Police | 7,330,537 | 8,596,383 | 9,756,501 | 9,930,993 | 10,494,473 | 11,058,137 | 11,734,094 |
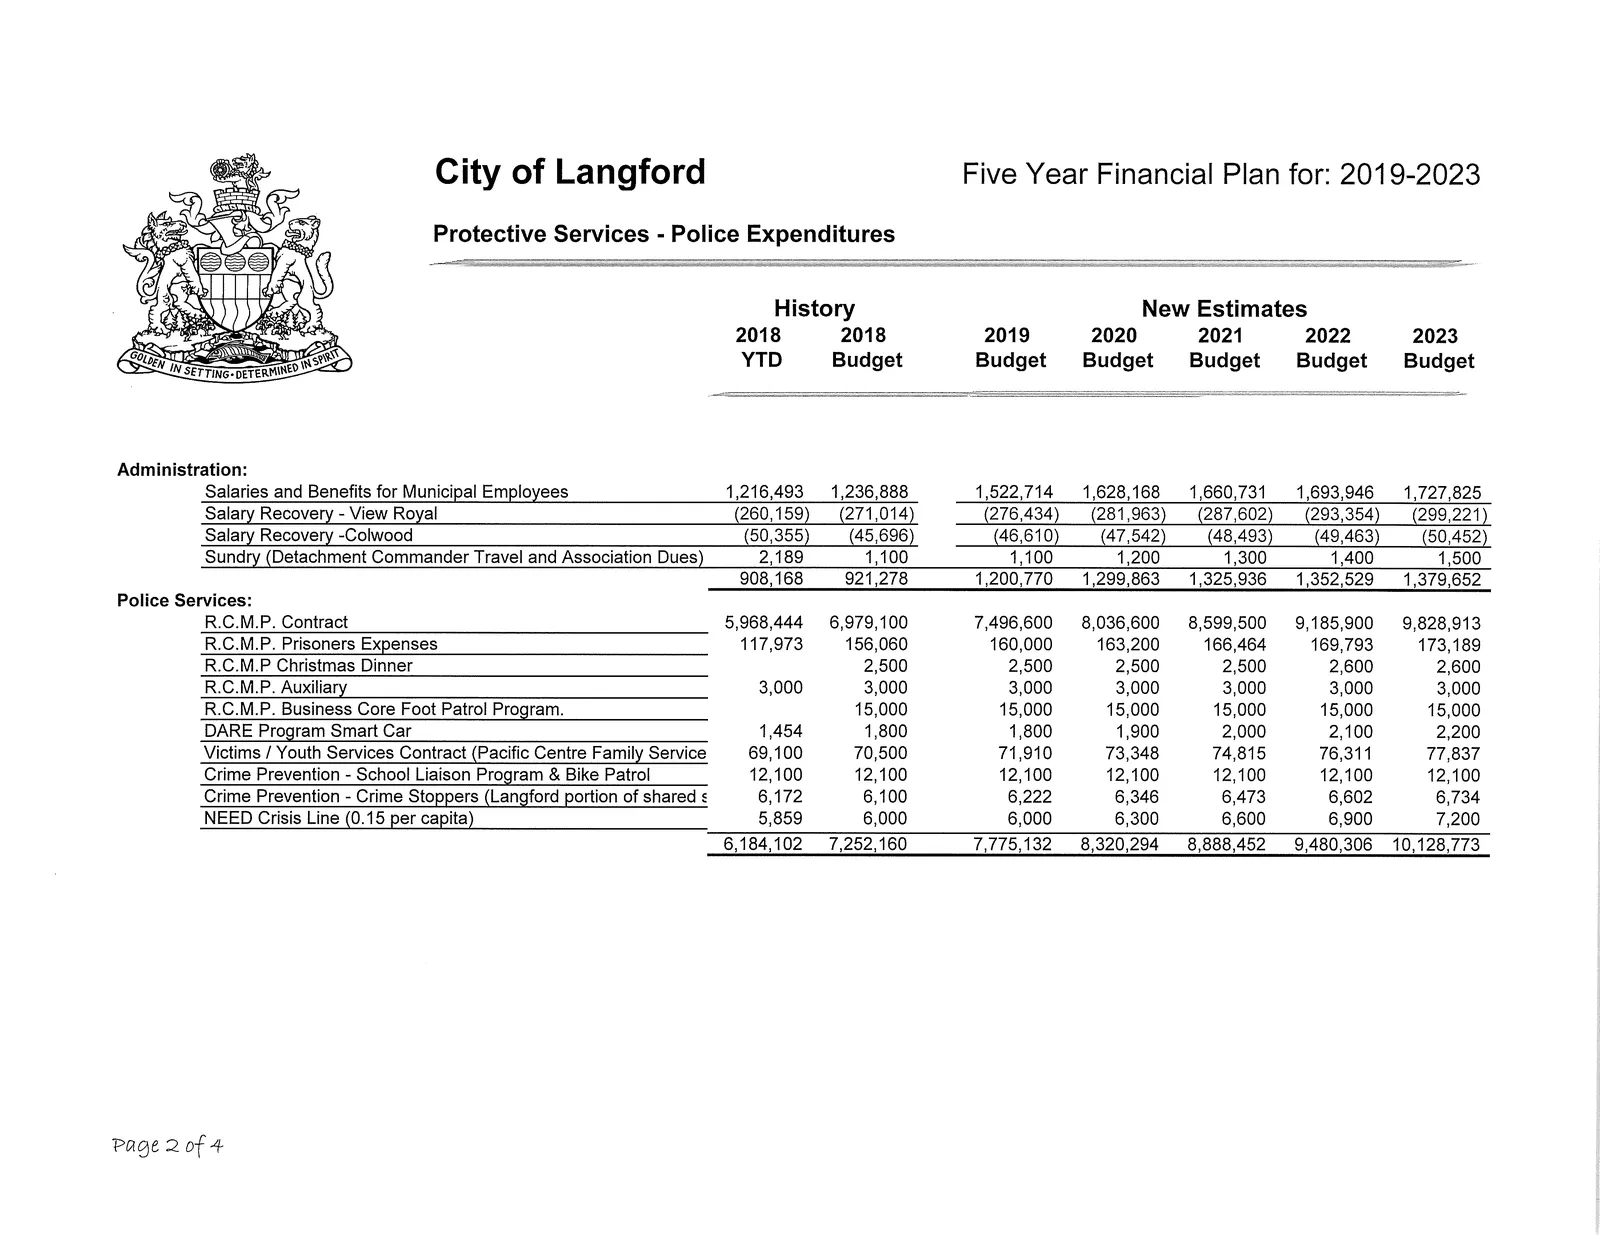
Police Administration (selected)
| Item | 2018 Actual | 2018 Budget | 2019 Budget |
|---|---|---|---|
| Salaries and Benefits for Municipal Employees | 1,216,493 | 1,236,888 | 1,522,714 |
| Salary Recovery - View Royal | (260,159) | (271,014) | (276,434) |
| Salary Recovery - Colwood | (50,355) | (45,696) | (46,610) |
| Sundry (Detachment Commander travel & dues) | 2,189 | 1,100 | 1,100 |
| Administration Total | 908,168 | 921,278 | 1,200,770 |
Police Services (RCMP and programs)
| Item | 2018 Actual | 2018 Budget | 2019 Budget |
|---|---|---|---|
| R.C.M.P. Contract | 5,968,444 | 6,979,100 | 7,496,600 |
| R.C.M.P. Prisoners Expenses | 117,973 | 156,060 | 160,000 |
| R.C.M.P. Auxiliary | 3,000 | 3,000 | 3,000 |
| Crime Prevention (School Liaison, Bike Patrol) | 12,100 | 12,100 | 12,100 |
| Victims / Youth Services Contract | 69,100 | 70,500 | 71,910 |
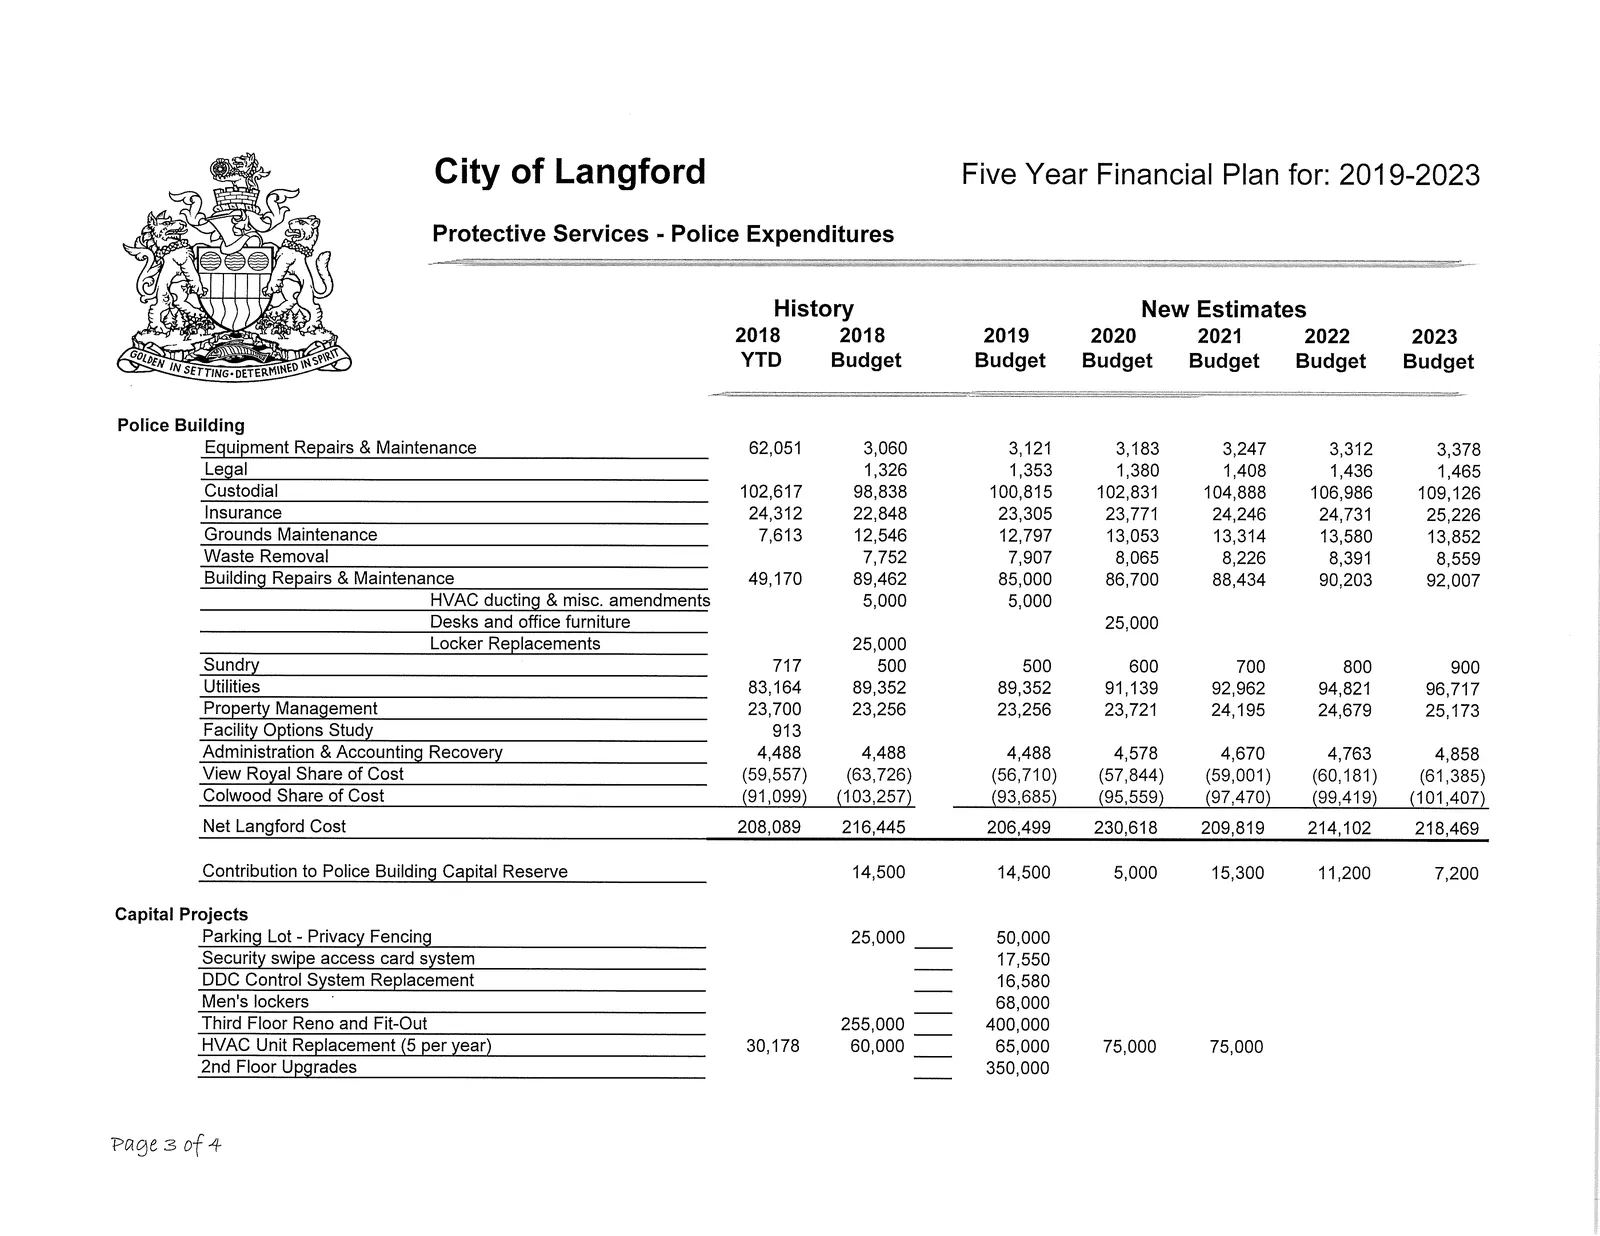
Police Building (selected)
| Item | 2018 Actual | 2018 Budget | 2019 Budget |
|---|---|---|---|
| Equipment Repairs & Maintenance | 62,051 | 3,060 | 3,121 |
| Custodial | 102,617 | 98,838 | 100,815 |
| Utilities | 83,164 | 89,352 | 89,352 |
| Building Repairs & Maintenance | 49,170 | 89,462 | 85,000 |
| Net Langford Cost | 208,089 | 216,445 | 206,499 |
| Contribution to Police Building Capital Reserve | 14,500 | 14,500 | 5,000 |
Police Capital Projects (selected)
- Parking Lot - Privacy Fencing: 25,000 (future budgets)
- Security swipe access card system: 17,550
- Third Floor Reno and Fit-Out: 255,000 (2019), 400,000 (2020)
- HVAC Unit Replacement (5 per year): 30,178 (2018 actual); 60,000; 65,000; 75,000; 75,000
- 2nd Floor Upgrades: 350,000
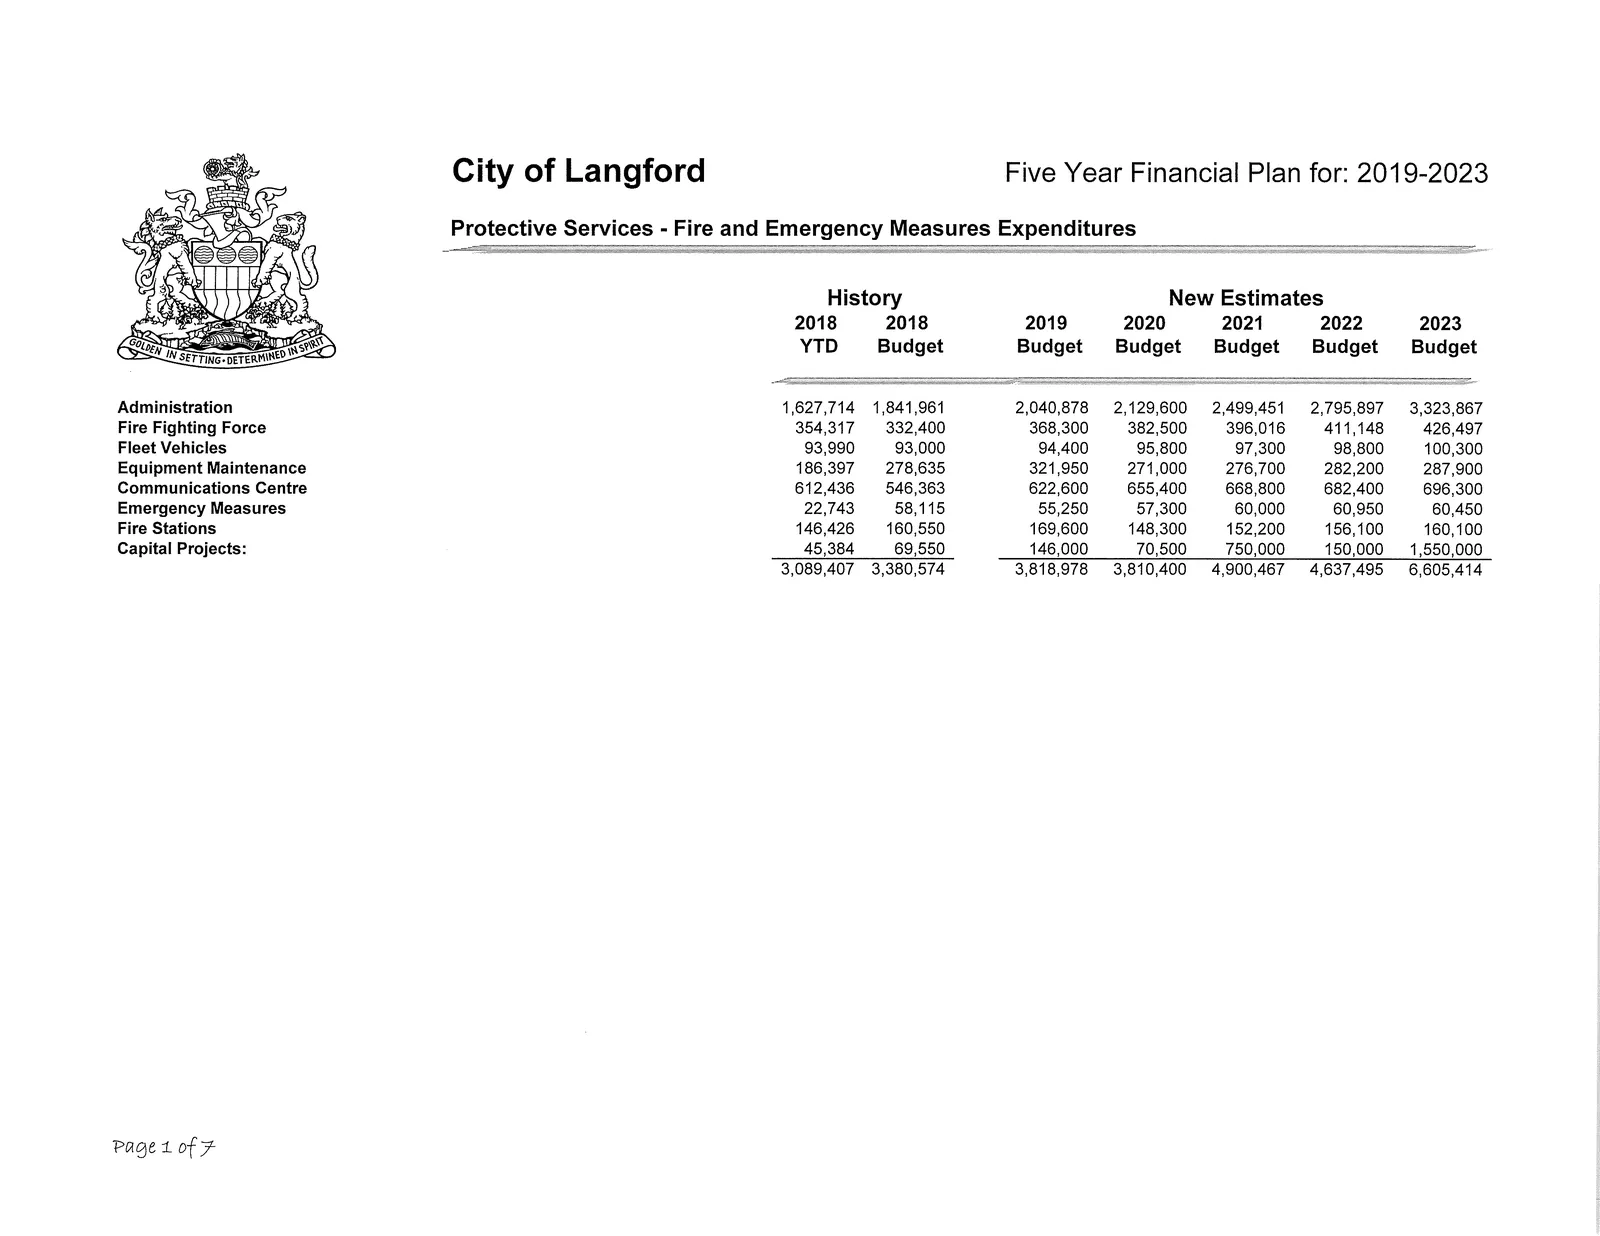
Protective Services — Fire and Emergency Measures Expenditures
Fire & Emergency Summary
| Area | 2018 Actual | 2018 Budget | 2019 Budget | 2020 Budget | 2021 Budget | 2022 Budget | 2023 Budget |
|---|---|---|---|---|---|---|---|
| Administration | 1,627,714 | 1,841,961 | 2,040,878 | 2,129,600 | 2,499,451 | 2,795,897 | 3,323,867 |
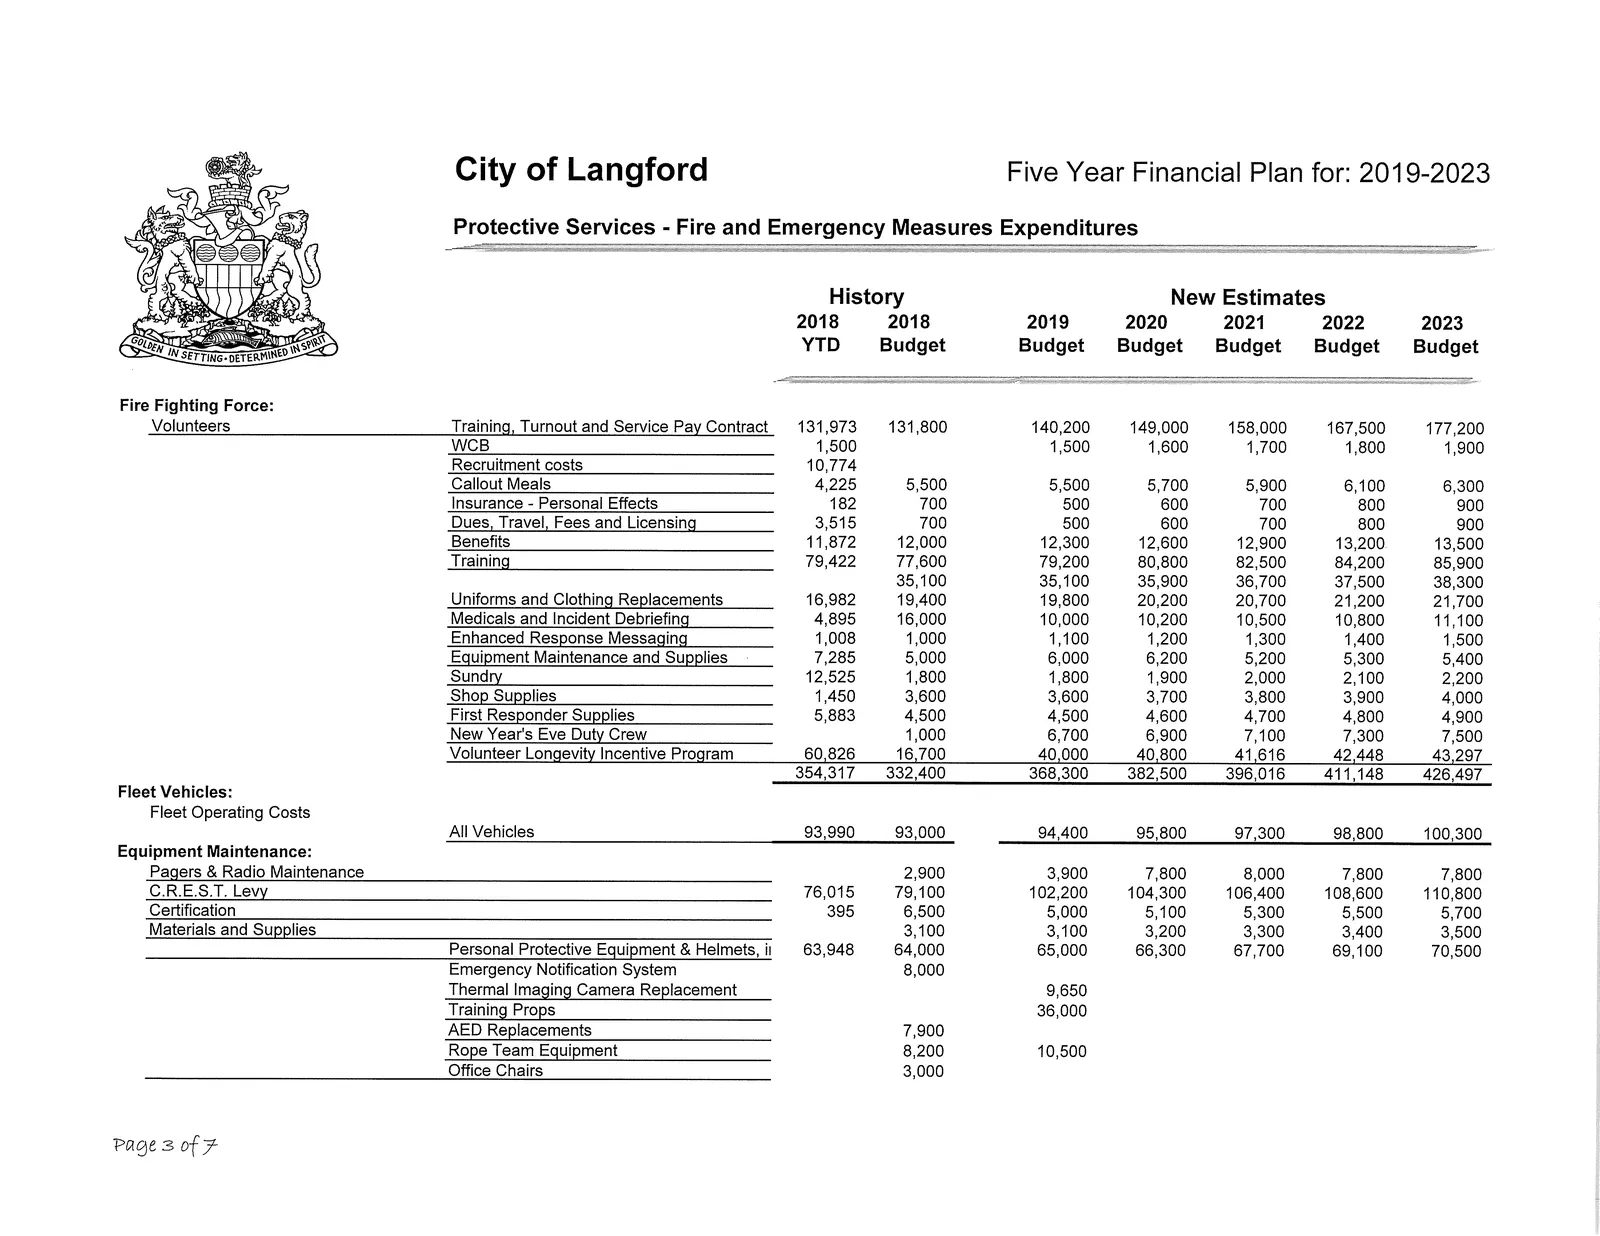
| Fire Fighting Force | 354,317 | 332,400 | 368,300 | 382,500 | 396,016 | 411,148 | 426,497 |
| Fleet Vehicles | 93,990 | 93,000 | 94,400 | 95,800 | 97,300 | 98,800 | 100,300 |
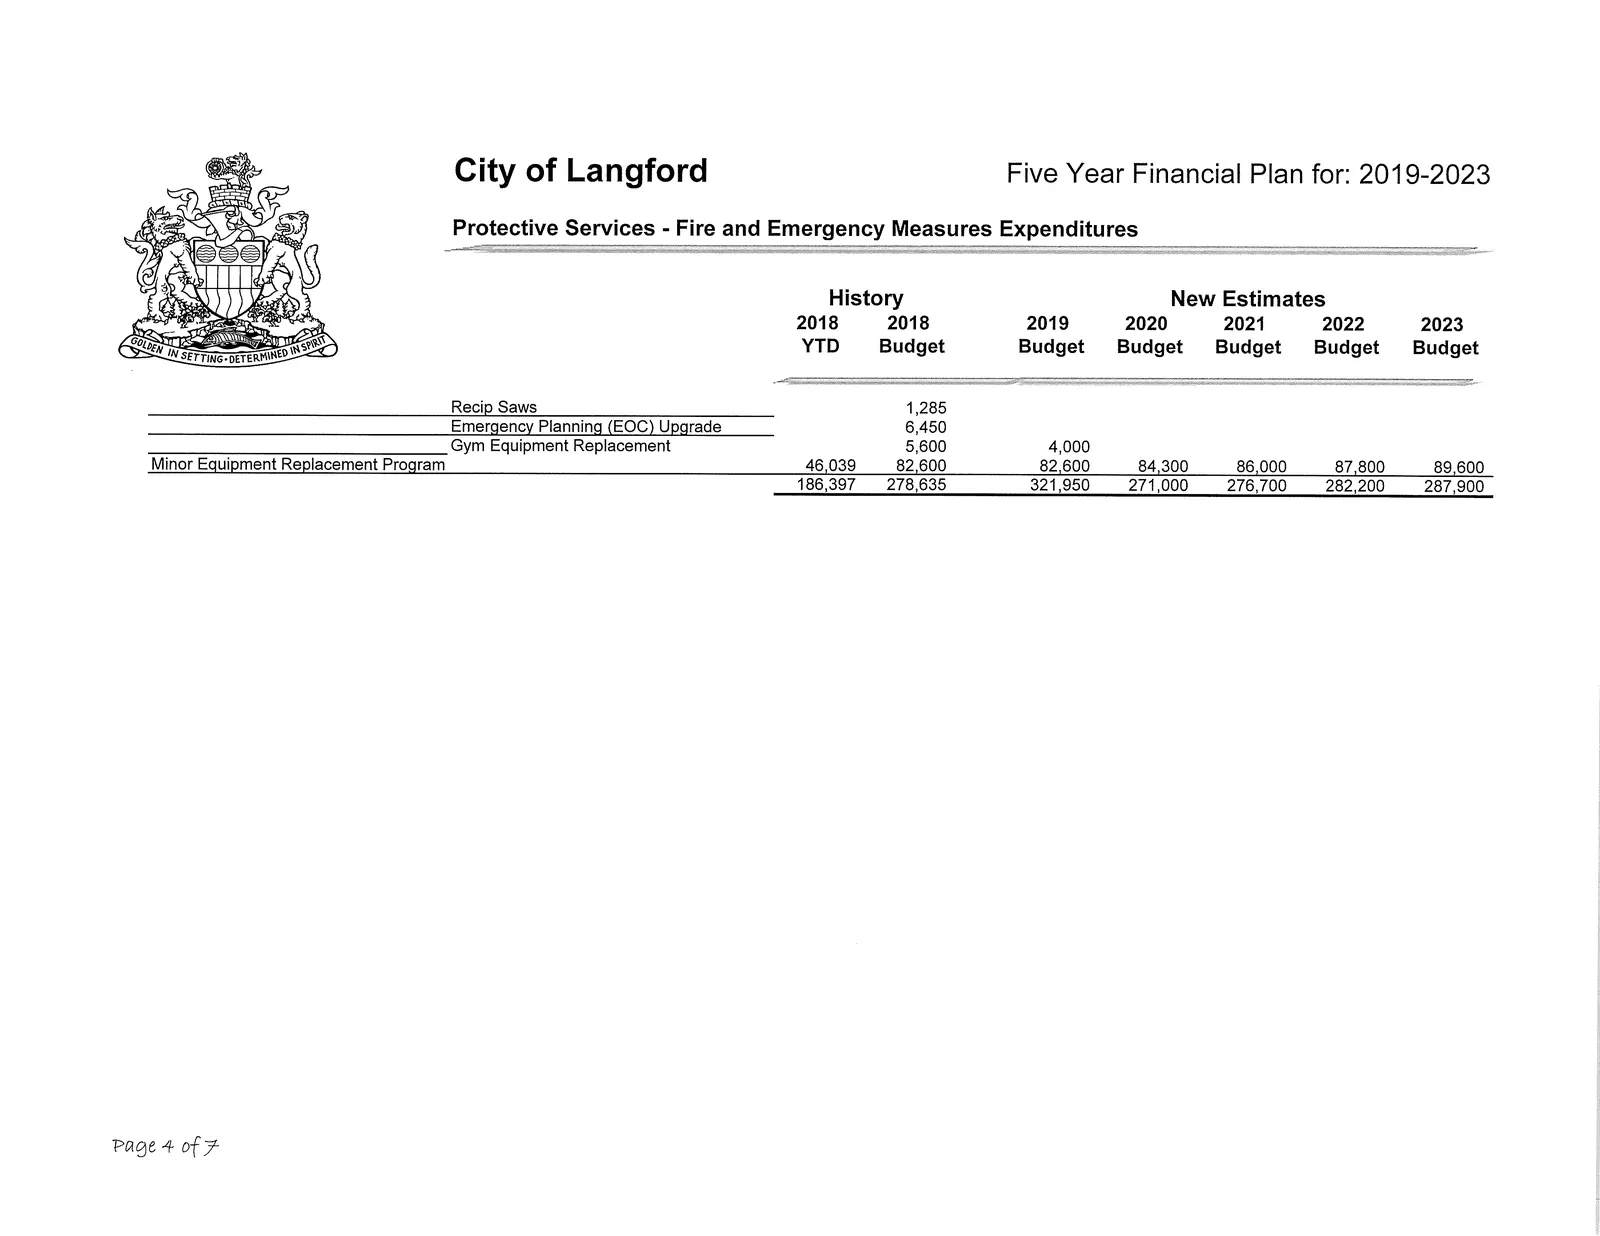
| Equipment Maintenance | 186,397 | 278,635 | 321,950 | 271,000 | 276,700 | 282,200 | 287,900 |
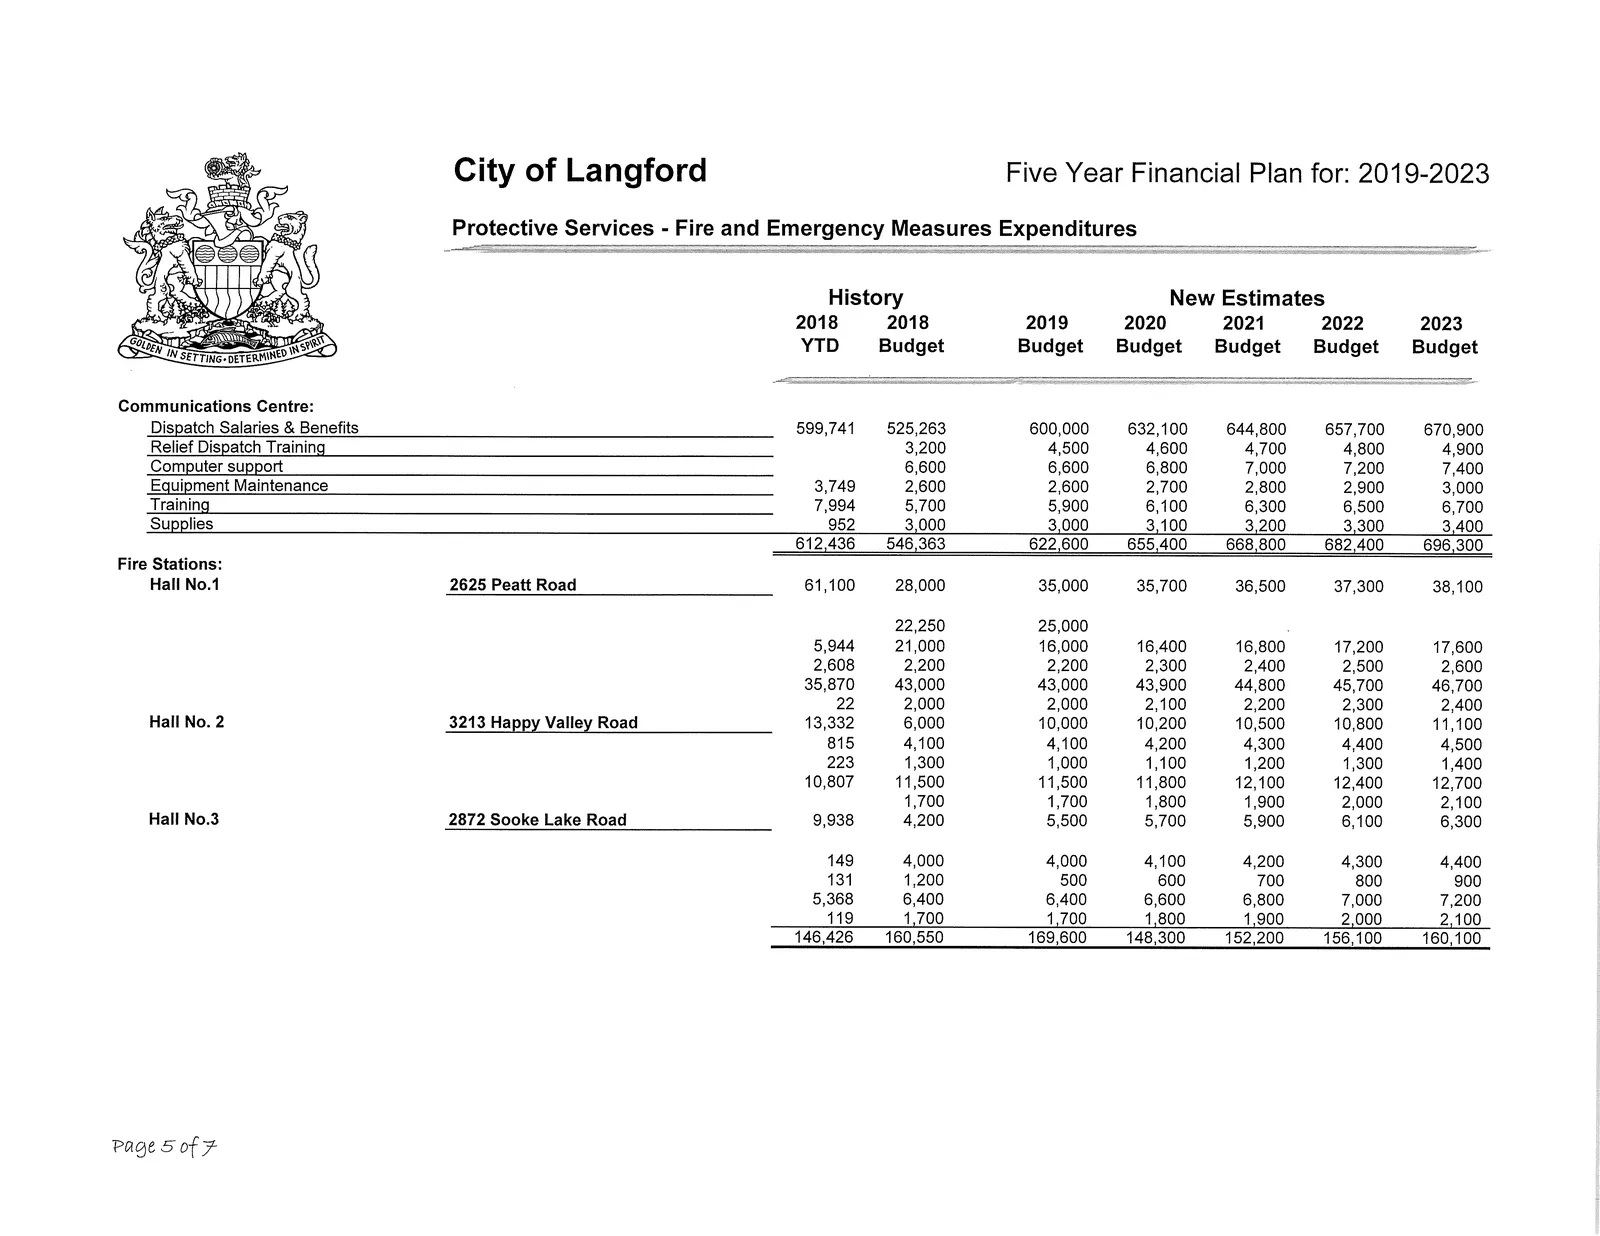
| Communications Centre | 612,436 | 546,363 | 622,600 | 655,400 | 668,800 | 682,400 | 696,300 |
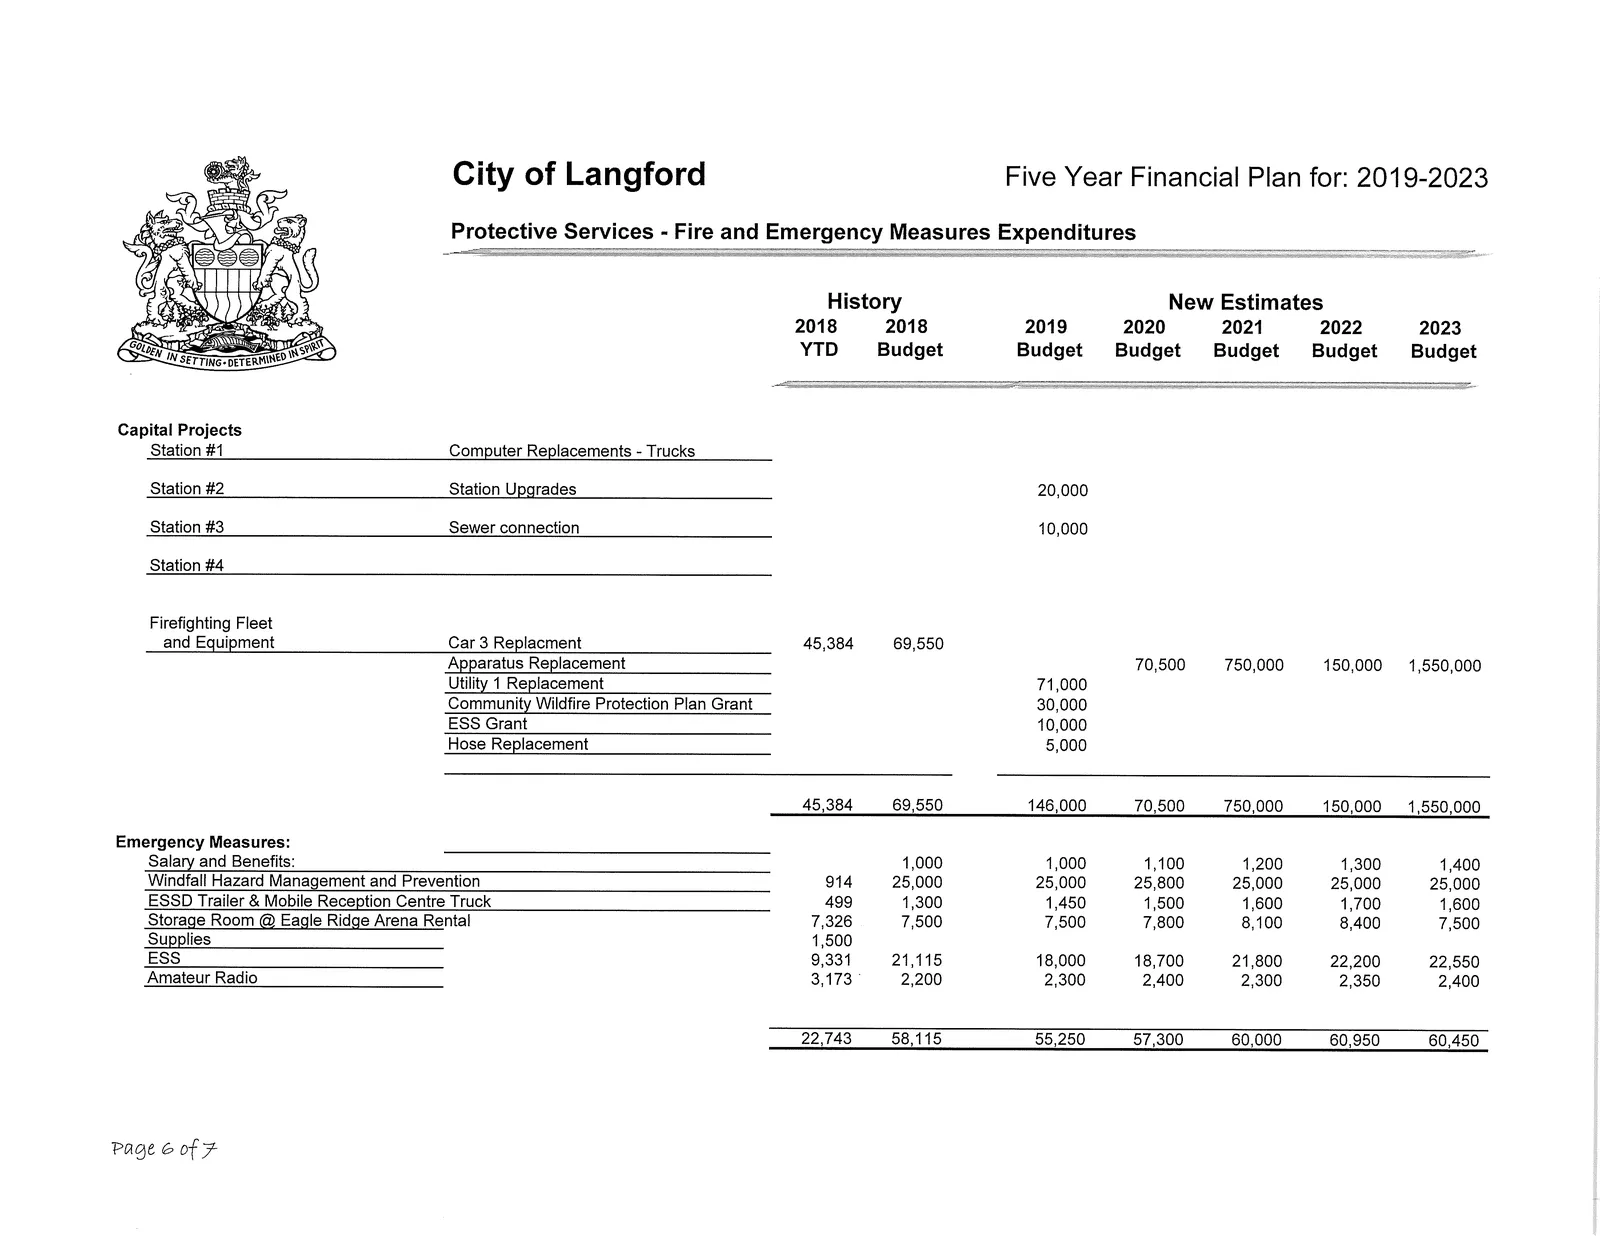
| Emergency Measures | 22,743 | 58,115 | 55,250 | 57,300 | 60,000 | 60,950 | 60,450 |
| Fire Stations | 146,426 | 160,550 | 169,600 | 148,300 | 152,200 | 156,100 | 160,100 |
| Capital Projects (Firefighting Fleet & Equipment) | 45,384 | 69,550 | 146,000 | 70,500 | 750,000 | 150,000 | 1,550,000 |
| Total Fire & Emergency | 3,089,407 | 3,380,574 | 3,818,978 | 3,810,400 | 4,900,467 | 4,637,495 | 6,605,414 |
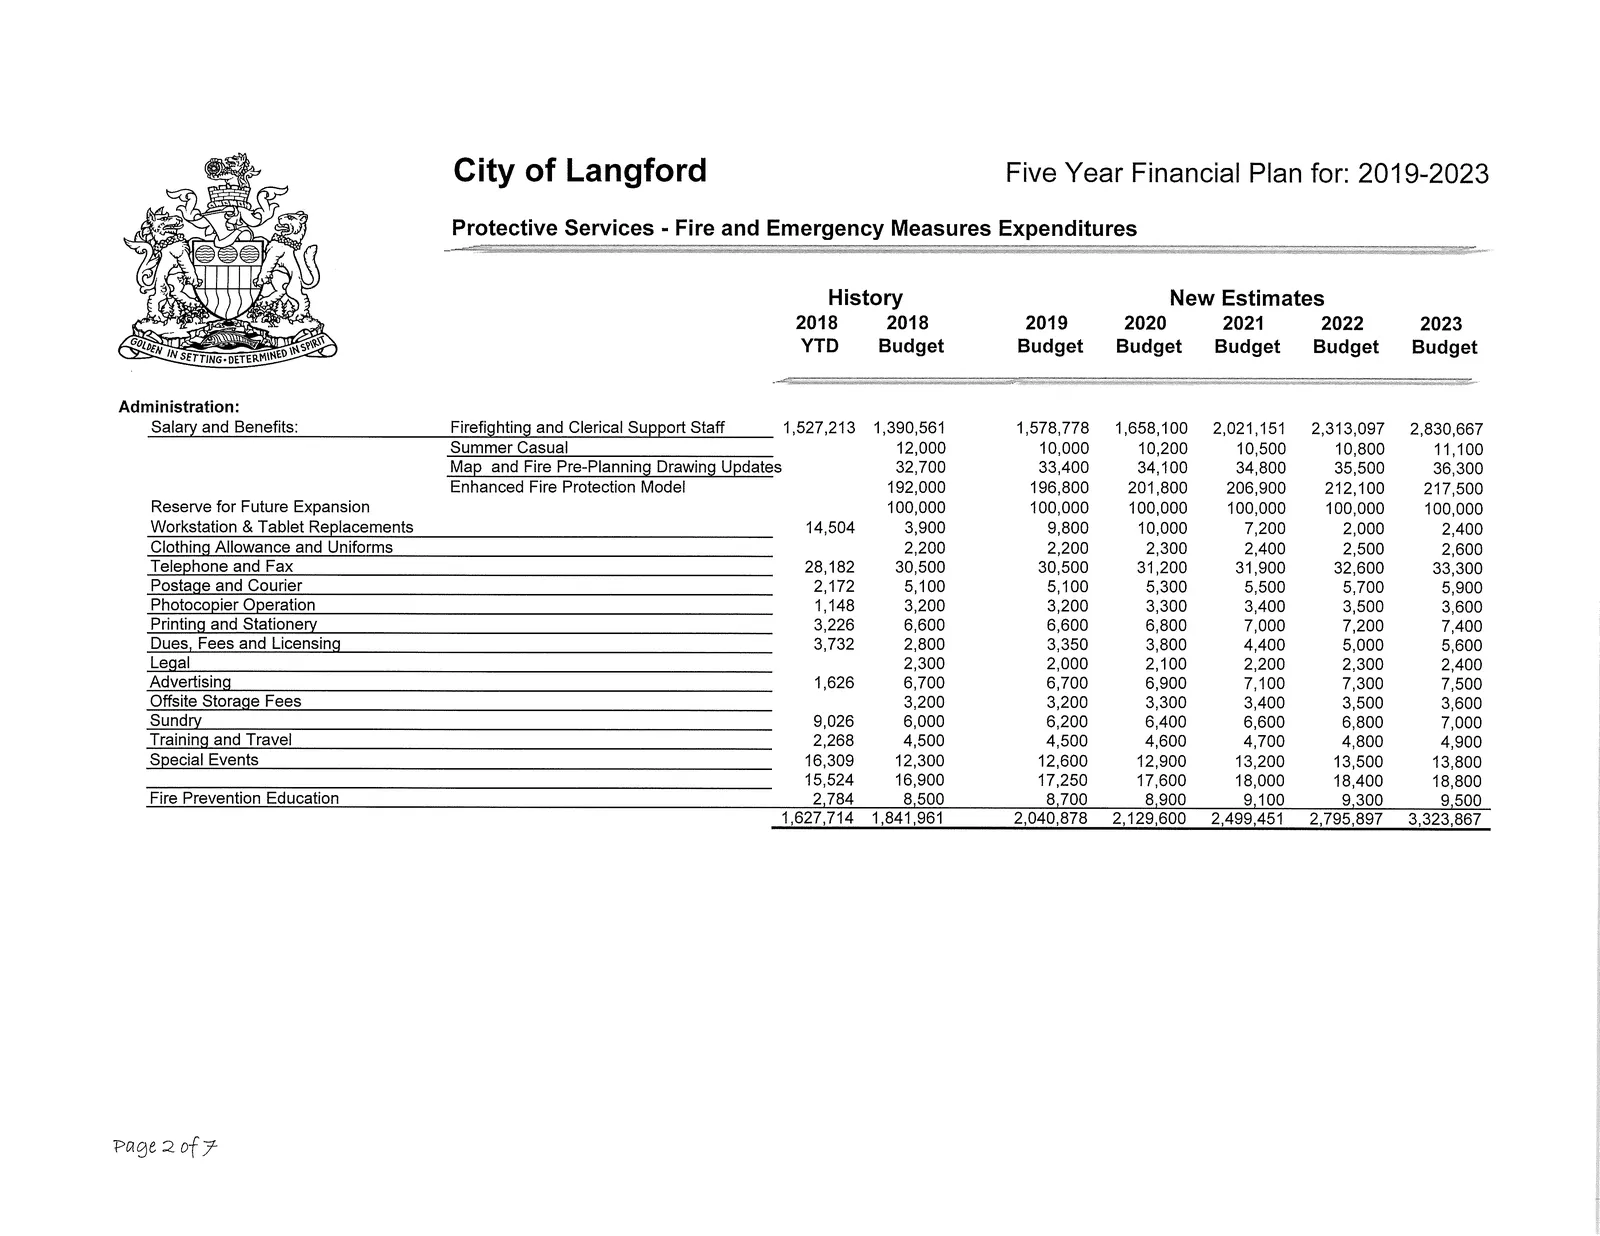
Fire — Administration (selected)
| Item | 2018 Actual | 2018 Budget | 2019 Budget | 2020 | 2021 | 2022 | 2023 |
|---|---|---|---|---|---|---|---|
| Firefighting and Clerical Support Staff (Salary & Benefits) | 1,527,213 | 1,390,561 | 1,578,778 | 1,658,100 | 2,021,151 | 2,313,097 | 2,830,667 |
| Summer Casual | 12,000 | 10,000 | 10,200 | 10,500 | 10,800 | 11,100 | — |
| Map and Fire Pre-Planning Drawing Updates | — | 32,700 | 33,400 | 34,100 | 34,800 | 35,500 | 36,300 |
| Enhanced Fire Protection Model | — | 192,000 | 196,800 | 201,800 | 206,900 | 212,100 | 217,500 |
| Reserve for Future Expansion | — | 100,000 | 100,000 | 100,000 | 100,000 | 100,000 | 100,000 |
| Workstation & Tablet Replacements | 14,504 | 3,900 | 9,800 | 10,000 | 7,200 | 2,000 | 2,400 |
Fire Fighting Force (selected)
| Item | 2018 Actual | 2018 Budget | 2019 Budget | 2020 | 2021 | 2022 | 2023 |
|---|---|---|---|---|---|---|---|
| Volunteers Training, Turnout and Service Pay Contract | 131,973 | 131,800 | 140,200 | 149,000 | 158,000 | 167,500 | 177,200 |
| WCB | 1,500 | 1,500 | 1,600 | 1,700 | 1,800 | 1,900 | — |
| Callout Meals | 4,225 | — | 5,500 | 5,700 | 5,900 | 6,100 | 6,300 |
| Benefits | 11,872 | 12,000 | 12,300 | 12,600 | 12,900 | 13,200 | 13,500 |
| Training | 79,422 | 77,600 | 79,200 | 80,800 | 82,500 | 84,200 | 85,900 |
| Uniforms and Clothing Replacements | 16,982 | 19,400 | 19,800 | 20,200 | 20,700 | 21,200 | 21,700 |
| Volunteer Longevity Incentive Program | 60,826 | 16,700 | 40,000 | 40,800 | 41,616 | 42,448 | 43,297 |
Fleet & Equipment (selected)
| Item | 2018 Actual | 2018 Budget | 2019 Budget |
|---|---|---|---|
| Fleet Operating Costs (All Vehicles) | 93,990 | 93,000 | 94,400 |
| Pagers & Radio Maintenance | — | 2,900 | 3,900 |
| C.R.E.S.T. Levy | 76,015 | 79,100 | 102,200 |
| Personal Protective Equipment & Helmets | 63,948 | 64,000 | 65,000 |
Equipment Replacement / Minor Programs
- Minor Equipment Replacement Program (2018 Actual: 186,397; 2019 Budget: 321,950)
- Recip Saws: 2018 Actual 1,285; 2019 Budget 6,450; subsequent budgets shown
- Gym Equipment Replacement: 46,039 (future allocation)
Communications Centre
| Item | 2018 Actual | 2018 Budget | 2019 Budget | 2020 | 2021 | 2022 | 2023 |
|---|---|---|---|---|---|---|---|
| Dispatch Salaries & Benefits | 599,741 | 525,263 | 600,000 | 632,100 | 644,800 | 657,700 | 670,900 |
| Relief Dispatch Training | 3,200 | — | 4,500 | 4,600 | 4,700 | 4,800 | 4,900 |
| Computer Support | 6,600 | — | — | 6,800 | 7,000 | 7,200 | 7,400 |
| Equipment Maintenance | 3,749 | 2,600 | 2,600 | 2,700 | 2,800 | 2,900 | 3,000 |
| Communications Centre Total | 612,436 | 546,363 | 622,600 | 655,400 | 668,800 | 682,400 | 696,300 |
Fire Stations (selected)
- Hall No.1 — 2625 Peatt Road (various facility operating costs; totals included in Fire Stations line)
- Hall No.2 — 3213 Happy Valley Road
- Hall No.3 — 2872 Sooke Lake Road
Fire Capital Projects (selected)
| Project | 2018 Actual | 2018 Budget | 2019 Budget | 2020 Budget |
|---|---|---|---|---|
| Car 3 Replacement | 45,384 | 69,550 | — | — |
| Apparatus Replacement | — | — | 70,500 | 750,000 |
| Utility 1 Replacement | — | — | 71,000 | — |
| Hose Replacement | — | — | 5,000 | — |
| Community Wildfire Protection Plan Grant | 30,000 | — | — | — |
| ESS Grant | 10,000 | — | — | — |
Emergency Measures (selected)
| Item | 2018 Actual | 2018 Budget | 2019 Budget |
|---|---|---|---|
| Supplies / ESS | 9,331 | 21,115 | 18,000 |
| Amateur Radio | 3,173 | 2,200 | 2,300 |
| Storage Room / Arena Rental | 7,326 | 7,500 | 7,500 |
| Emergency Measures Total | 22,743 | 58,115 | 55,250 |
Notes on Images Included
Revenue Summary table — Municipal property taxes and other revenue sources
(Note: headers, footers, page numbers and letterhead images were omitted per instructions.)