DocumentsStaff ReportJan 21, 2019Pages 235–241
Staff Report (Engineering) — Downtown Infrastructure Study: Stormwater & Sanitary Sewers
Engineering staff report regarding findings or recommendations from the Downtown Infrastructure Study focused on stormwater and sanitary sewer systems.
Key facts
- Report topic: Downtown Infrastructure Study – Stormwater and Sanitary Sewers
- Department: Engineering
- Agenda item: 8(b), starting page 235
Staff Report to Council
Date: January 21, 2019
Department: Engineering
Subject: Downtown Infrastructure Stormwater Study
Background
In 2017, the City retained Avi Freedman to develop a vision for Downtown Langford. To assist in this planning process staff were directed by to investigate any infrastructure improvements or impediments to densifying the Downtown Core.
The purpose of this report is to update Council on the status of the stormwater management options in the downtown core and to receive the report undertaken as part of that investigation.
Commentary
KERR WOOD LEIDAL (KWL) were retained to do a study on the ambient groundwater levels in the downtown core in relation to infiltration options.
The City has limited piped stormwater systems in the downtown core because of the natural gravel deposits in this area that can provide some groundwater infiltration opportunities for future development.
In order to assist future development with baseline information for stormwater management planning, a series of groundwater monitoring wells were installed in the downtown core area. These were monitored throughout 2018. The purpose of the monitoring wells was to establish a baseline for in-ground disposal of stormwater in the downtown core.
The Analysis Langford Groundwater Level Monitoring study dated January 17, 2019 (Appendix A) has produced illustrations of ambient groundwater levels. The monitoring wells should remain in place over time. Additional future groundwater level monitoring would provide an opportunity for additional data to assist development.
Financial Implications
Staff are recommending that the monitoring wells be monitored over the next 3 to 5 years to provide more comprehensive groundwater data.
Legal Implications
None noted.
Options
That Council:
- Receive Analysis Langford Groundwater Level Monitoring study dated January 17, 2019;
And
- Authorize staff to get a quote to continue recording the groundwater levels in the monitoring wells for the purposes of providing more comprehensive data for the downtown core in ground infiltration options;
OR
- Do nothing at this time with respect to ongoing groundwater monitoring in the downtown core
Respectfully submitted,
Submitted by:
Michelle Mahovlich, P.Eng, P.Geo, Director of Engineering
Concurrence:
Michael Dillabaugh, CPA, CA, Director of Finance
Concurrence:
Braden Hutchins, Director of Corporate Services
Concurrence:
Matthew Baldwin, A/Chief Administrative Officer
:mm
Attachments: Appendix A Preliminary Analysis Groundwater Level Monitoring study dated January 17, 2019
Appendix A — LOWEN HYDROGEOLOGY CONSULTING LTD. Memorandum
PO Box 45024 Victoria, B.C. Canada V9A 0C3
Phone: 250-595-0624 - Fax: 1–855-286-8001
Website: www.lowenhc.ca - e-Mail: dl@lowenhc.ca
TO: Rob Warren
E-MAIL: RWarren@kwl.ca
FROM: Dennis Lowen
LHC Project: 1730
DATE: January 17, 2019
RE: Analysis-Langford Groundwater Water Level Monitoring; 2017 - 2018
OF PAGES: 5
Message
In late November 2017 Lowen Hydrogeology Consulting Ltd. (LHC) was retained to monitor groundwater levels in the central Langford region. The subject area is bounded by the TransCanada Highway, Veterans Memorial Parkway, Langford Parkway and Leigh Road. The objective of the monitoring is to determine the feasible depth for underground parking construction for new buildings in the region.
Two existing wells were utilized plus six newly drilled piezometers for the monitoring. Piezometer construction and instrumentation was completed between December 18 and 21, 2017. A map with the monitoring locations is provided in Figure 1.
Well / Piezometer Data
A table of well data is as follows:
| Location | Northing | Easting | Surveyed Elevation (m.) | Well Depth (m.) |
|---|---|---|---|---|
| Carlow Road | 5366252.846 | 462022.0356 | 76.39517 | 15.54 |
| Dunford Avenue | 5365866.980 | 462301.6070 | 75.35390 | 9.30 |
| Massie Drive | 5366430.044 | 463262.1775 | 75.41084 | 9.36 |
| Peatt Road | 5367044.243 | 463244.7266 | 76.15760 | 3.05 |
| Raycroft Place | 5366667.700 | 462444.4847 | 76.12336 | 10.10 |
| Superstore (Well #95159) | 5365491.379 | 462816.2044 | 63.80655 | 30.49 |
| Veterans Memorial Park (Well #84465) | 5366004.349 | 463332.7547 | 73.85834 | 35.98 |
| Wren Place | 5366644.391 | 462915.0515 | 76.50140 | 10.37 |
The well and piezometer sites were monitored between December 18 – 21, 2017 and July 10, 2018. A summary of the water table fluctuations is as follows:
| Location | Dec 2017 Water Level bgl. (m) | Lowest Water Level bgl. (m.) | Highest Water Level bgl. (m.) | Water Level Fluctuation (m.) |
|---|---|---|---|---|
| Carlow Road | 11.479 | 11.479 | 8.551 | 2.928 |
| Dunford Avenue | - | - | >9.300 | - |
| Massie Drive | - | - | >9.360 | - |
| Peatt Road | 0.642 | 1.522 | 0.519 | 1.003 |
| Raycroft Place | 7.487 | 7.487 | 5.106 | 2.381 |
| Superstore (Well #95159) | 6.261 | 6.397 | 5.826 | 0.571 |
| Veterans Memorial Park (Well #84465) | 12.952 | 12.952 | 11.700 | 1.252 |
| Wren Place | 6.640 | 6.640 | 5.372 | 1.268 |
Note: bgl. – below ground level
Observations
The water levels at Dunford Avenue and Massie Drive are uncertain as the piezometers were not drilled sufficiently deep. This is not uncommon with auger drilling in sand/gravel formations. Drilling is halted when wet sand/gravel is observed in the borehole however, the soil in these boreholes were damp but not saturated and the drilling should have continued. The data collected here is still useful as we know the depth of the piezometers and that the highest groundwater levels at the two sites are deeper than the completed depths of 9.3 and 9.36 m.
Groundwater levels for the monitoring period are presented in Figure 2. The Veterans Memorial Park Well #84465 and the Superstore Well #95159 are used by the District for irrigation purposes. Starting in March for the Veterans Memorial Park Well and April for the Superstore Well the effects of pumping can be seen. The downward spikes in water level indicate pumping drawdown. Both wells recover to the natural water level trend and the pumping has only a minor impact.
Overall, the water levels fluctuate approximately 0.6 to 3.0 m. between December and June. The highest groundwater levels are observed in February or early March. The lowest annual water levels likely occur in October (outside the period of observation). The data recorders were re-installed in July 2018 and are currently active. We recommended retrieving them in April 2019.
A map with contours of the minimum (Feb-March) dry soil depth is presented in Figure 3. The dry soil depths vary between 0.5 m. and 11.5 m. across the study area.
CONCLUSIONS:
- Water table depths fluctuate 0.6 to more than 3.0 m. seasonally in the study area.
- Minimum dry soil depths ranges between 0.5 and 11.5 m. depending on location within the study area.
- To construct 3 levels of underground parking (assume 3.3 m. per level) would require special care over most of the study area.
RECOMMENDATONS:
- Groundwater level monitoring should be made permanent using the existing sites.
- A program of water sampling should be considered using the piezometers.
If you have any questions or require any further information, please contact the undersigned.
Best regards,
Dennis A. Lowen, P. Eng., P. Geo.
DL/MD/hr
Figures
Figure 1 – Location Plan
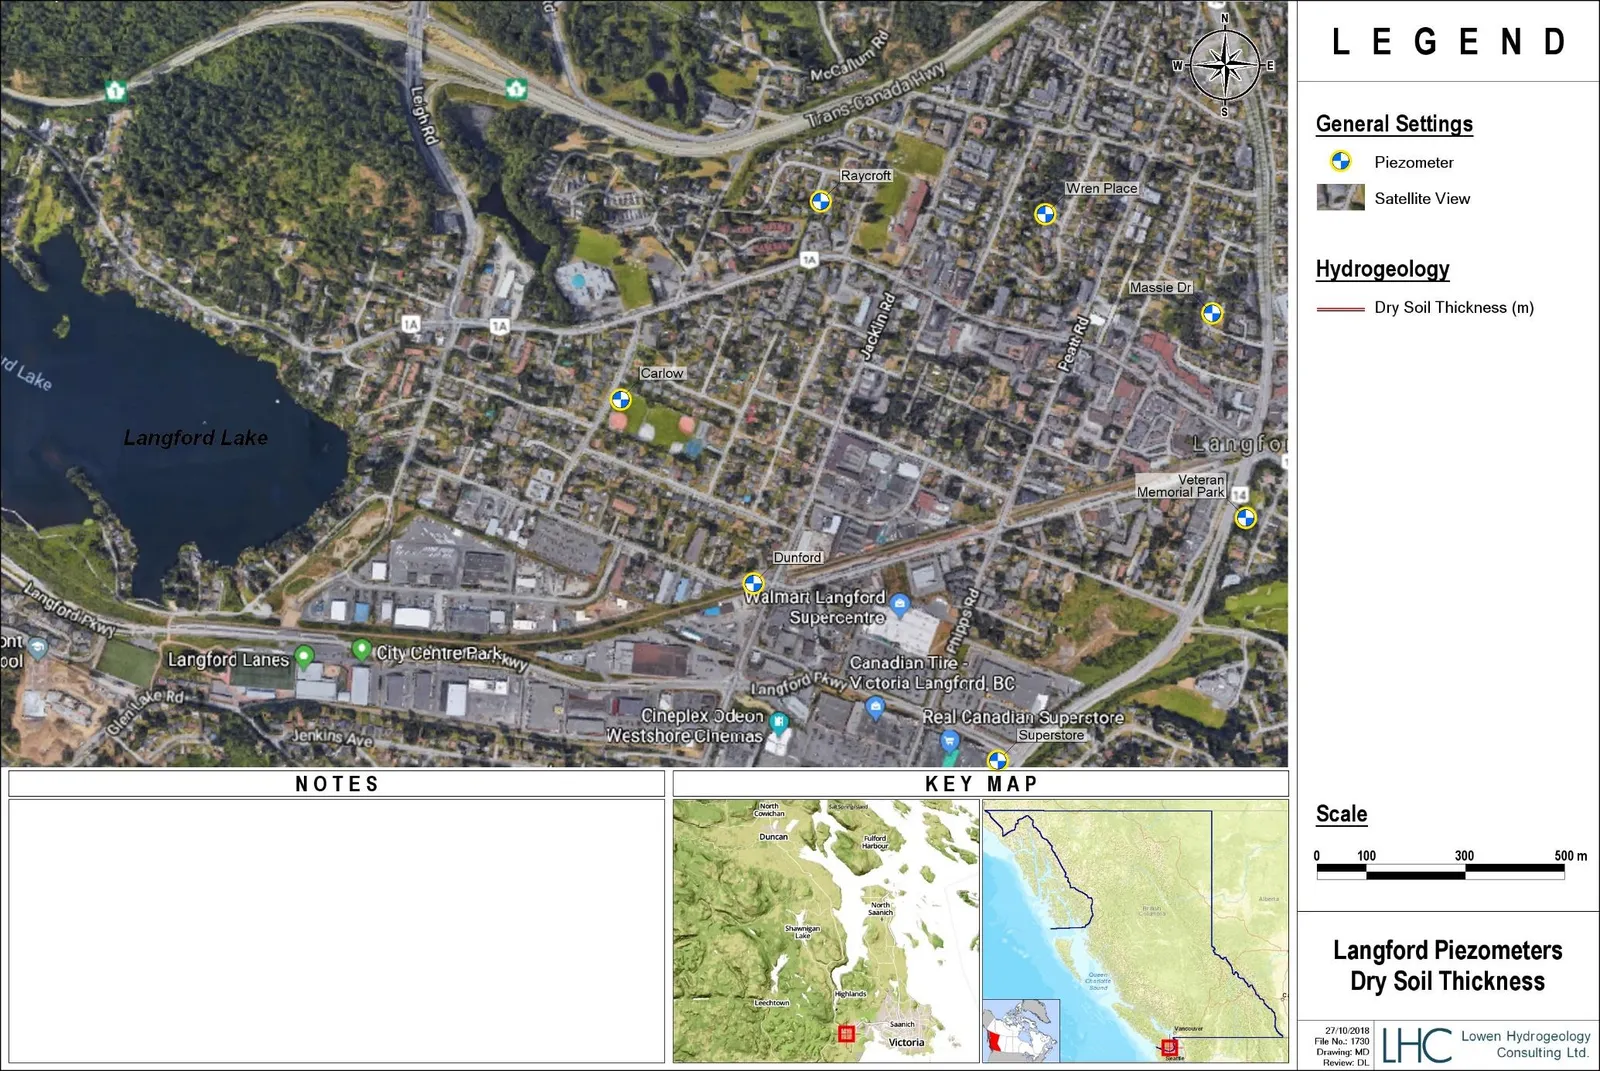
Figure 2 – Depths to Water Table
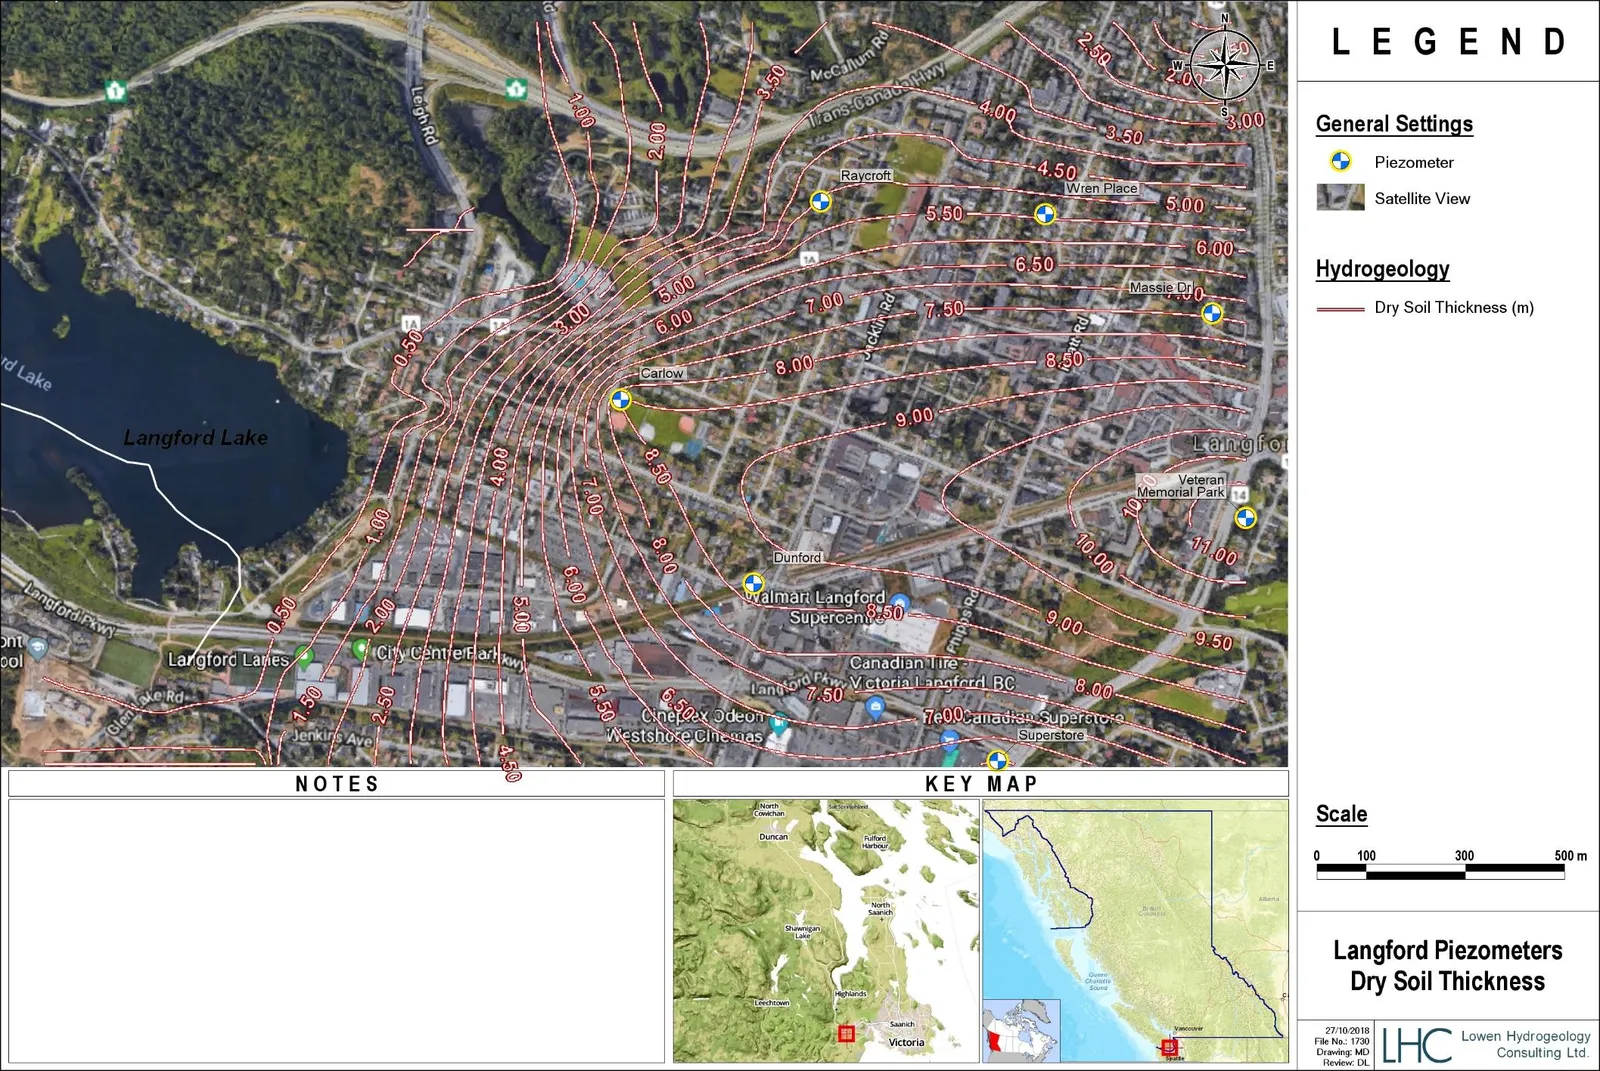
Figure 3 – Dry Soil Thickness