DocumentsAppendixSep 4, 2018Pages 12–40
Indigenous Perspectives Society — Financial Statements (Year Ended March 31, 2017)
Independent auditor's report and full financial statements, notes and schedules for Indigenous Perspectives Society for the year ended March 31, 2017.
Key facts
- Fiscal year end: March 31, 2017
- Total contributions and other revenues reported: $2,578,281 (statement of revenues and expenditures)
- Cash at year-end: $4,454,152 (statement of financial position)
- Long-term debt (Vancouver City Savings loan) principal reported around $914,998 (note 4)
- Disclosure: two employees/contractors paid > $75,000 with combined total $181,215
Indigenous Perspectives Society — Financial Statements (Year Ended March 31, 2017)
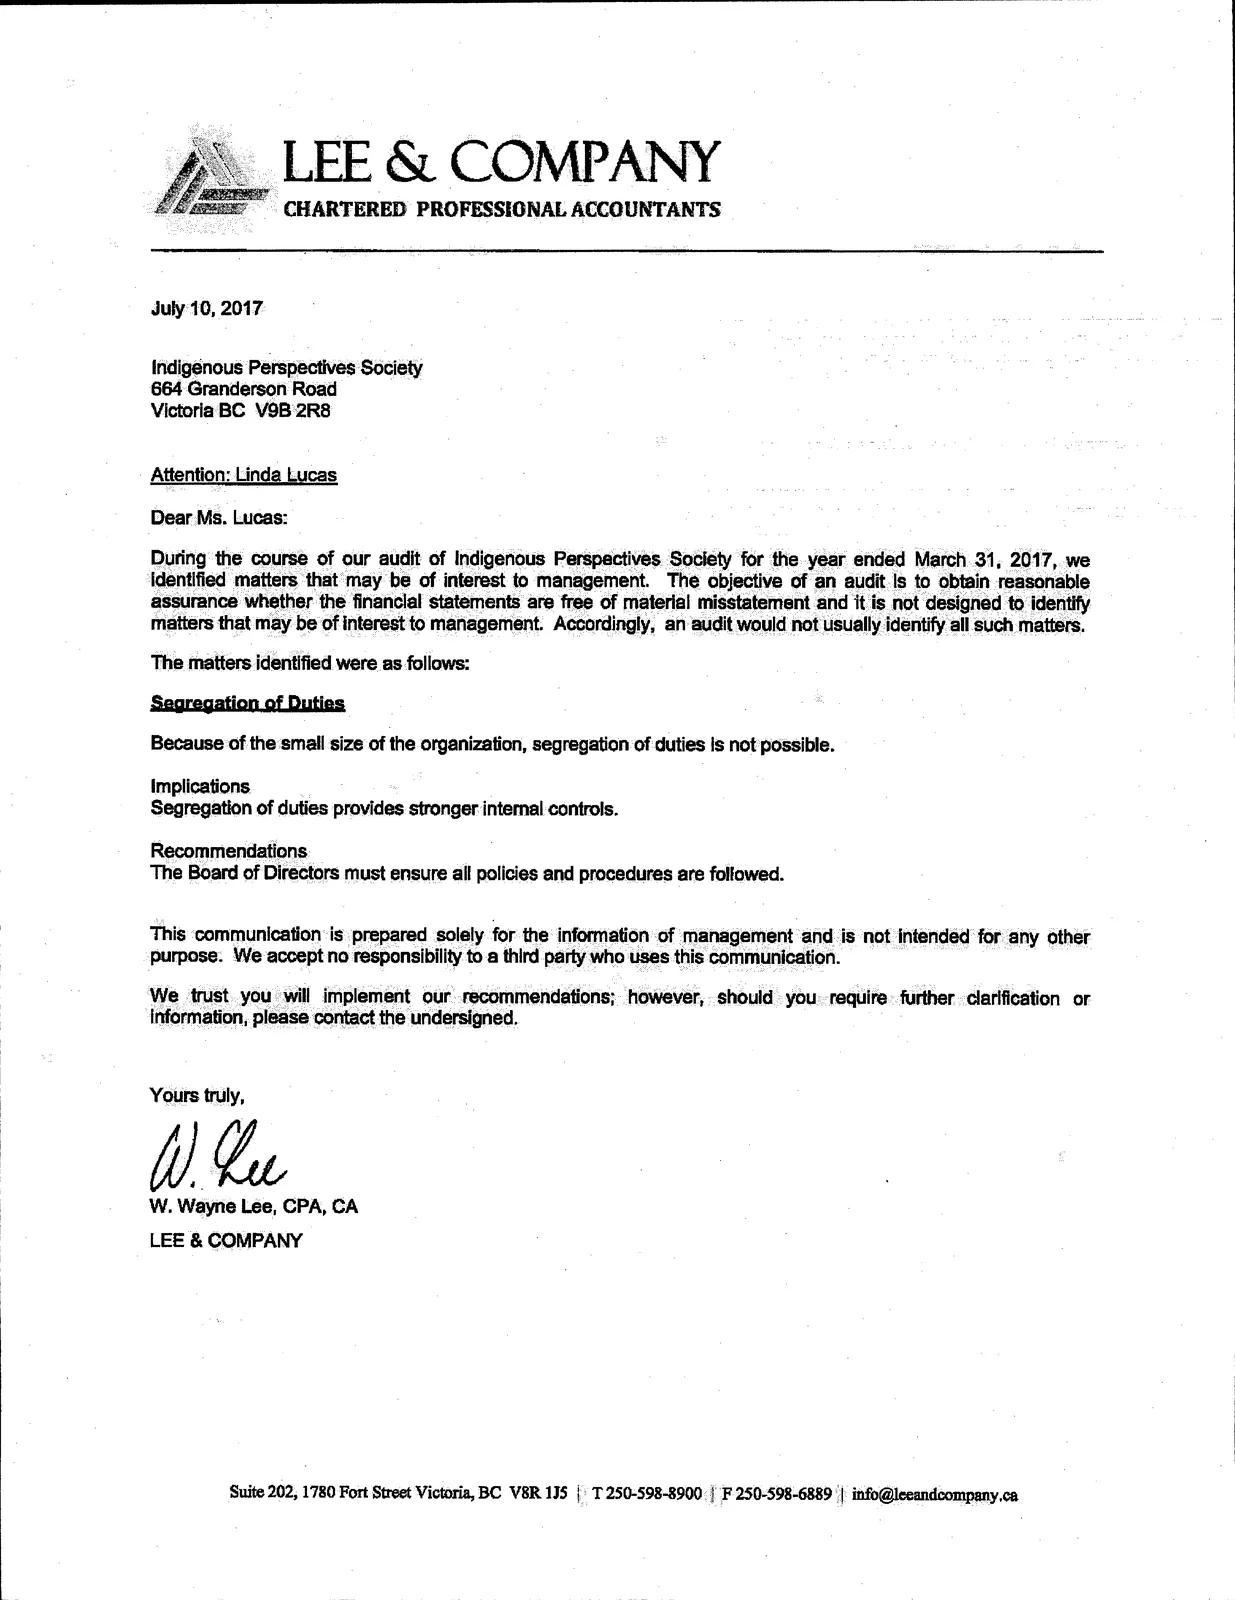
Lee & Company — Auditor Communication
Lee & Company
CHARTERED PROFESSIONAL ACCOUNTANTS
June, 2017
Indigenous Perspectives Society
664 Granderson Road
Victoria BC V9B 2R8
Attention: Linda Lucas
Dear Ms. Lucas:
During the course of our audit of Indigenous Perspectives Society for the year ended March 31, 2017, we identified matters that may be of interest to management. The objective of an audit is to obtain reasonable assurance whether the financial statements are free of material misstatement and it is not designed to identify matters that may be of interest to management. Accordingly, an audit would not usually identify all such matters.
The matters identified were as follows:
Segregation of Duties
Because of the small size of the organization, segregation of duties is not possible.
Implications
Segregation of duties provides stronger internal controls.
Recommendations
The p)ard of Dire<^rs must ensure ail policies arid procedures are follpwed.
This communication is prepared solely for the information of management and is not intended for any other purpose. We accept no responsibility to a third party who uses this communication.
We trust you will implement our recommendations; however, should you require further clarification or information, please contact the undersigned.
Yours truly,
W. Wee
Lee, CPA, CA
LEE & COMPANY
Suite 202, 1780 Fort Street, Victoria, BC V8R 1J5
T 250-598-8900 | F 250-598-6889
Financial Statements — Title Page
INDIGENOUS PERSPECTIVES SOCIETY
Financial Statements
Year Ended March 31, 2017
Index to Financial Statements
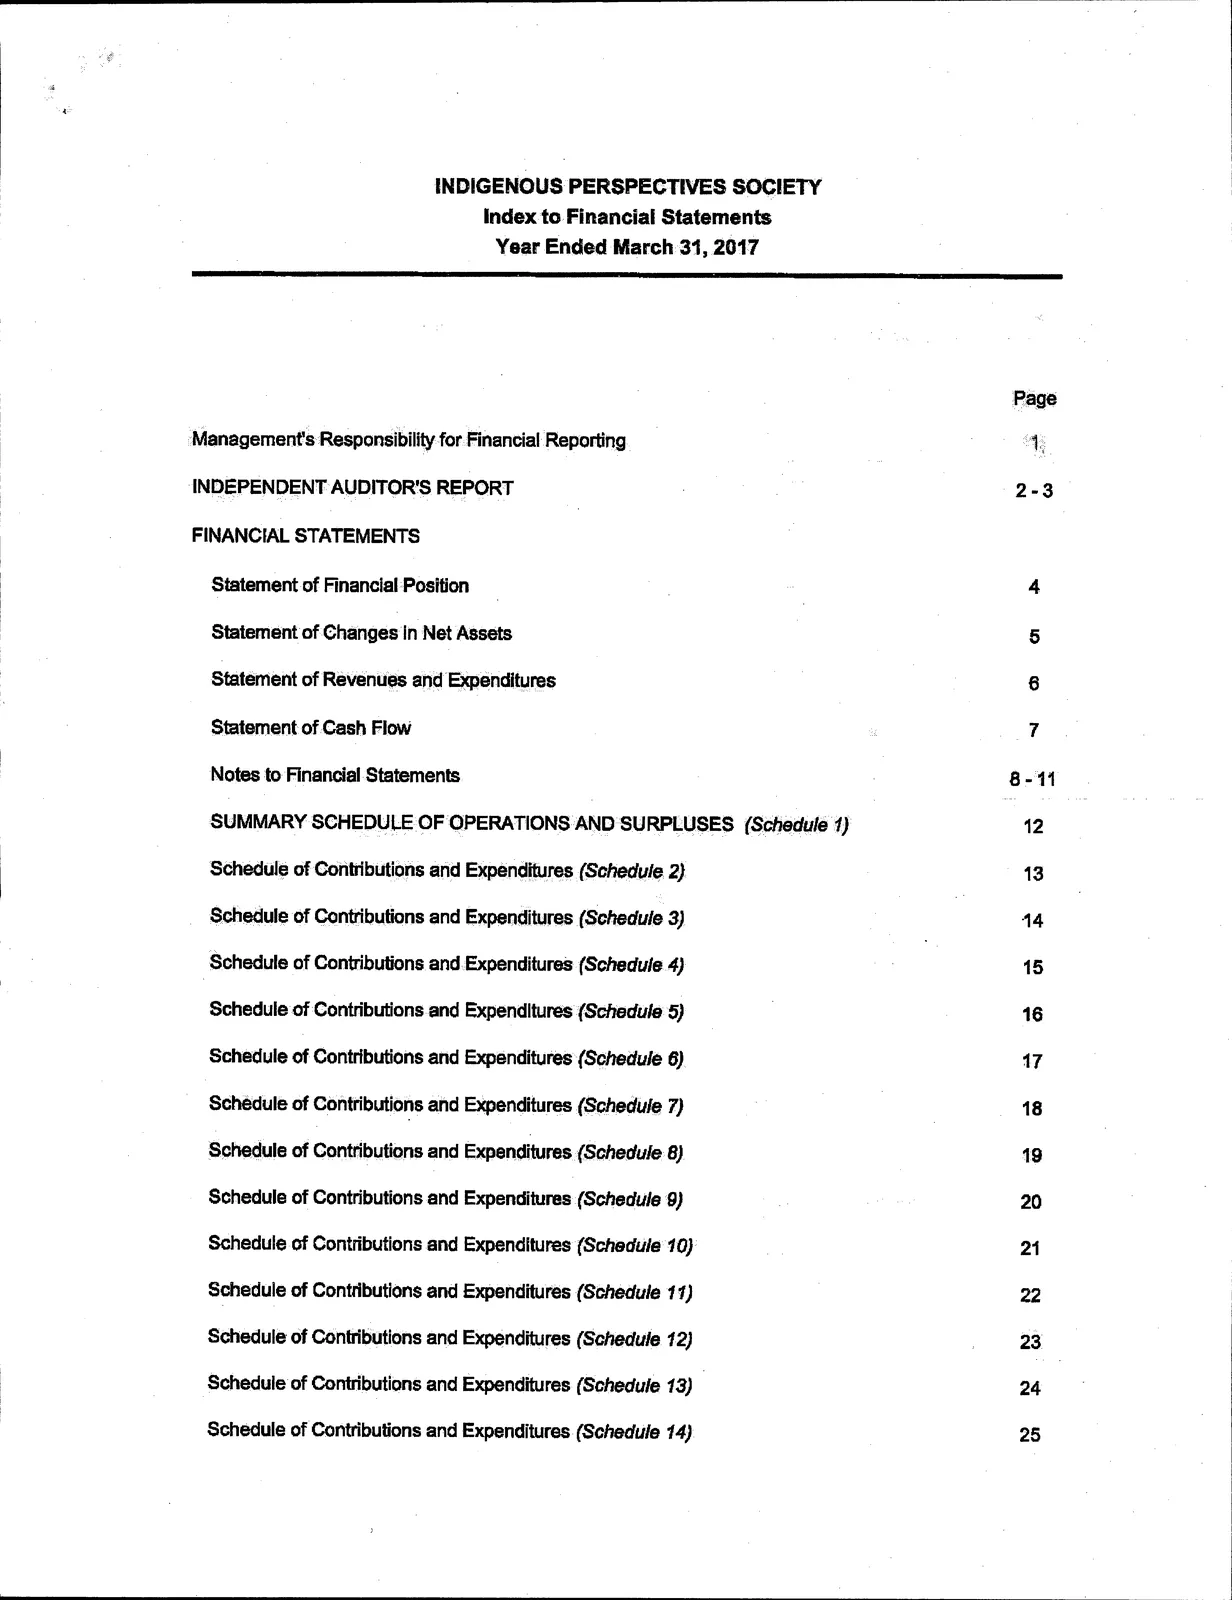
- Management's Responsibility for Financial Reporting — 1
- INDEPENDENT AUDITOR'S REPORT — 2–3
- FINANCIAL STATEMENTS
- Statement of Financial Position — 4
- Statement of Changes in Net Assets — 5
- Statement of Revenues and Expenditures — 6
- Statement of Cash Flow — 7
- Notes to Financial Statements — 8–11
- SUMMARY SCHEDULE OF OPERATIONS AND SURPLUSES (Schedule 1) — 12
- Schedule of Contributions and Expenditures (Schedule 2) — 13
- Schedule of Contributions and Expenditures (Schedule 3) — 14
- Schedule of Contributions and Expenditures (Schedule 4) — 15
- Schedule of Contributions and Expenditures (Schedule 5) — 16
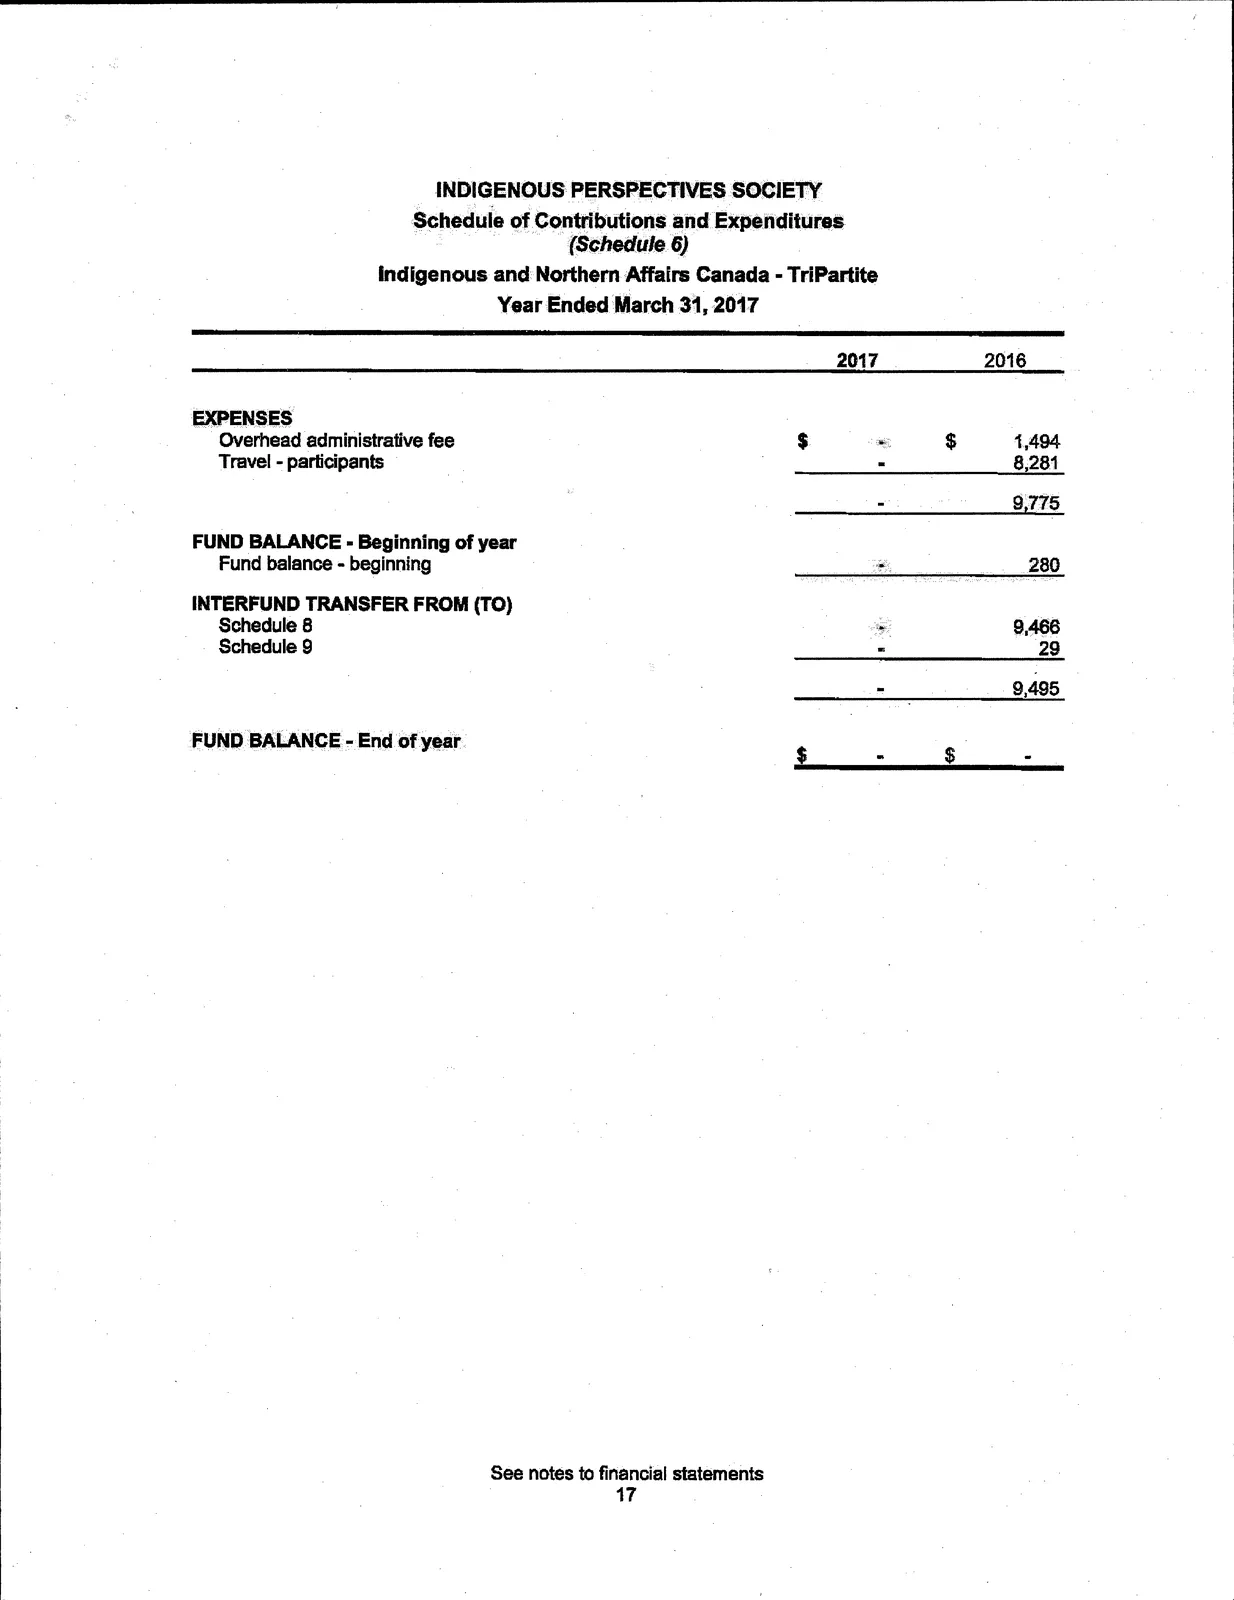
- Schedule of Contributions and Expenditures (Schedule 6) — 17
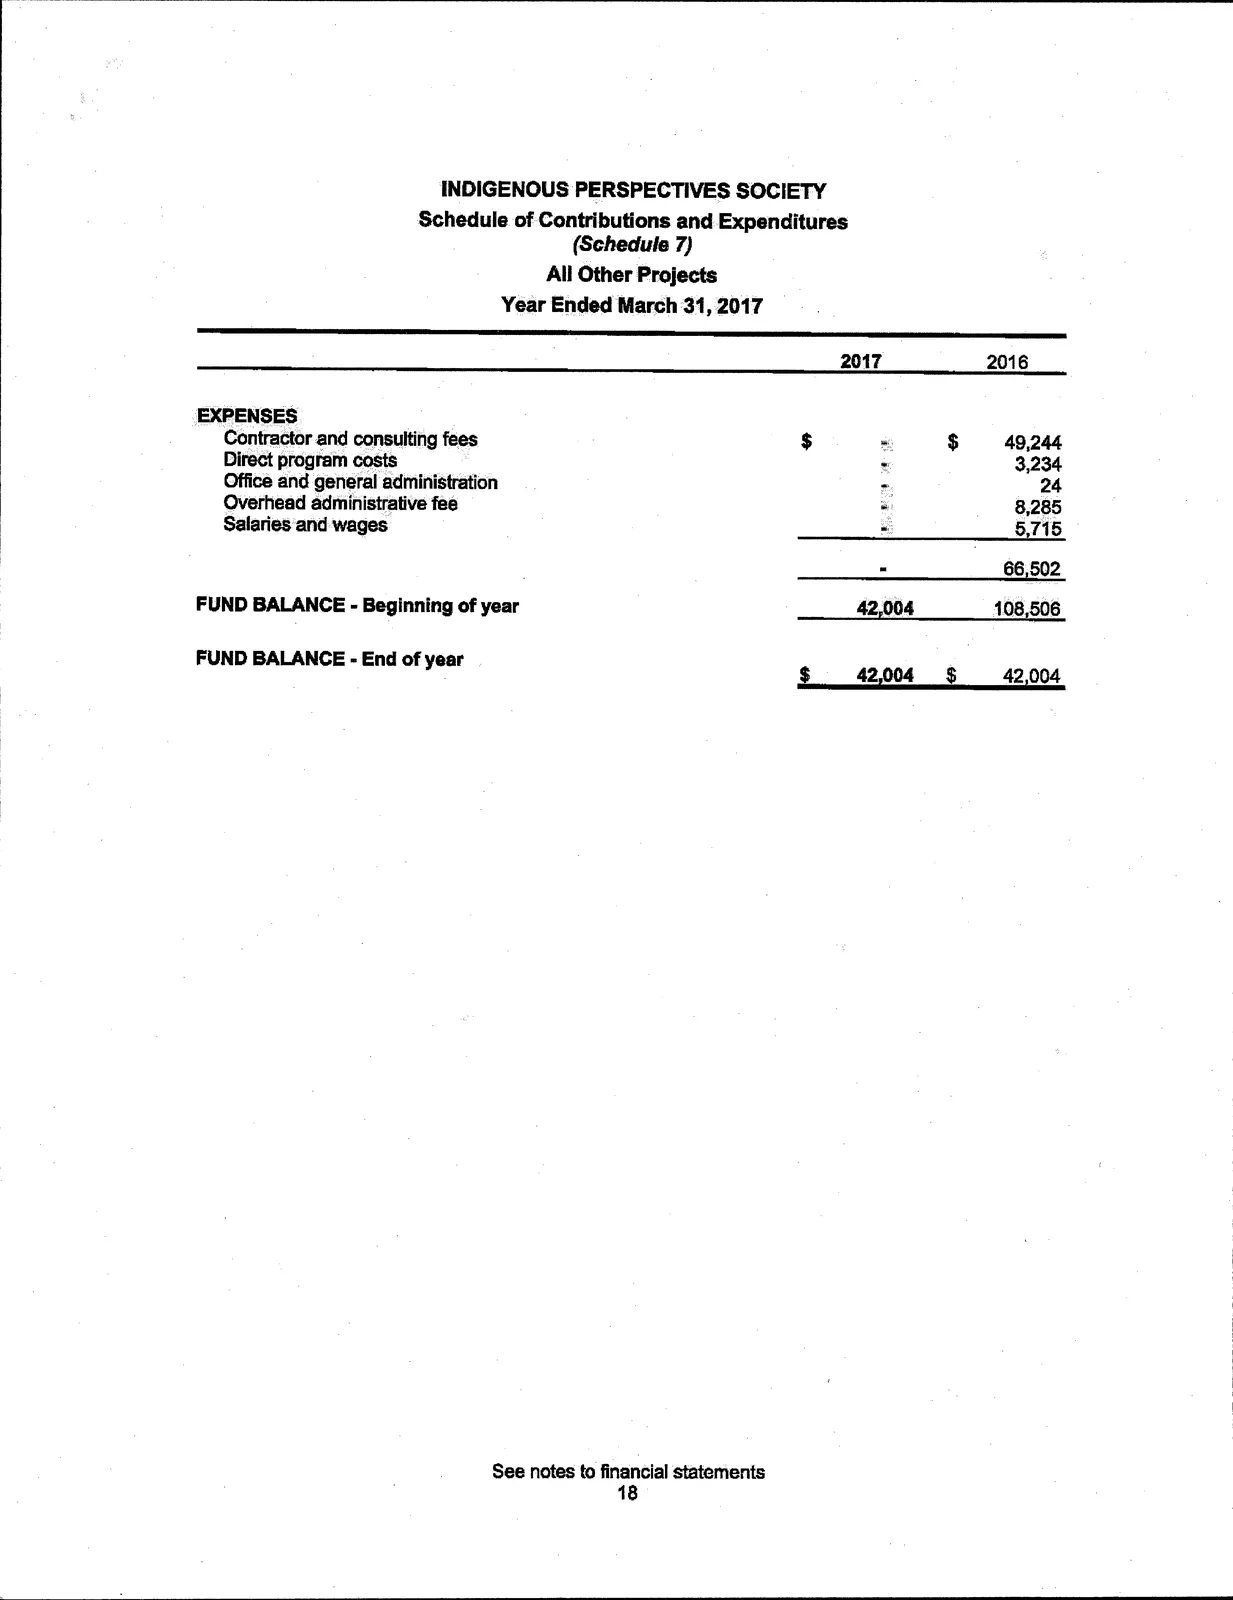
- Schedule of Contributions and Expenditures (Schedule 7) — 18
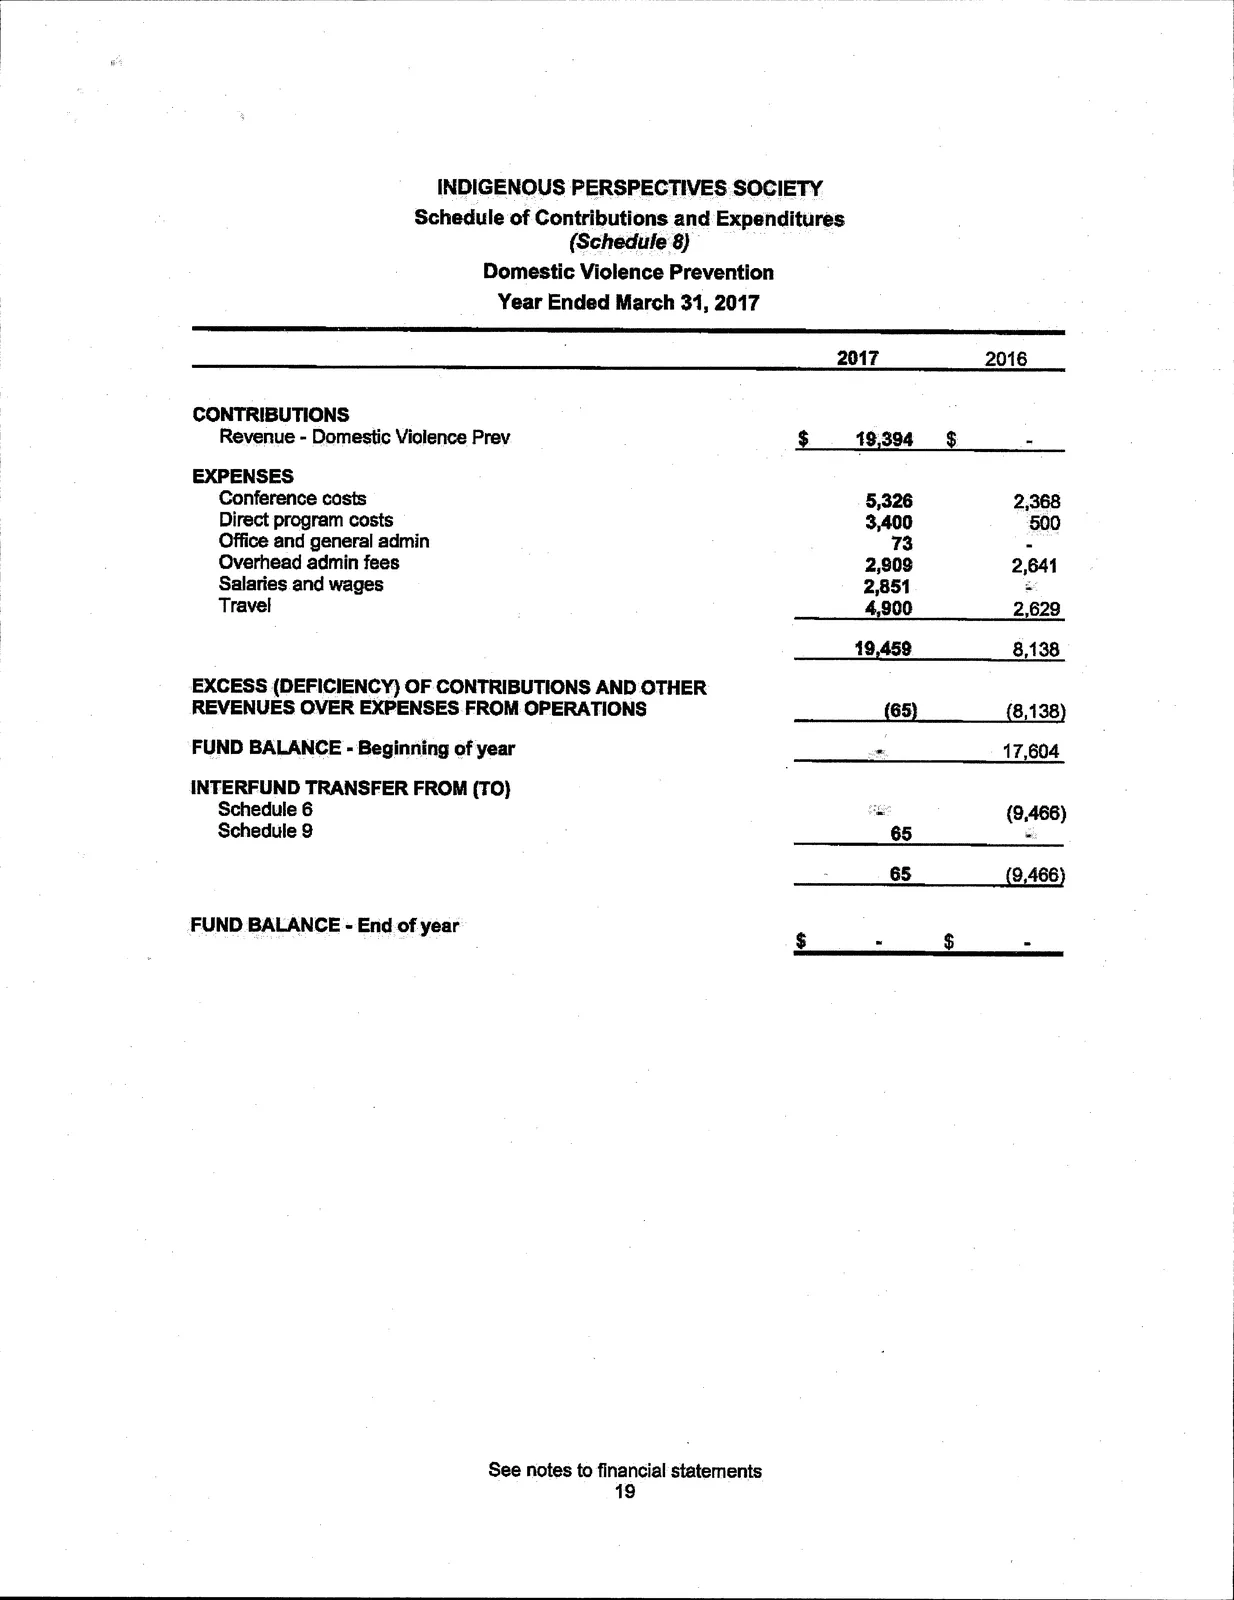
- Schedule of Contributions and Expenditures (Schedule 8) — 19
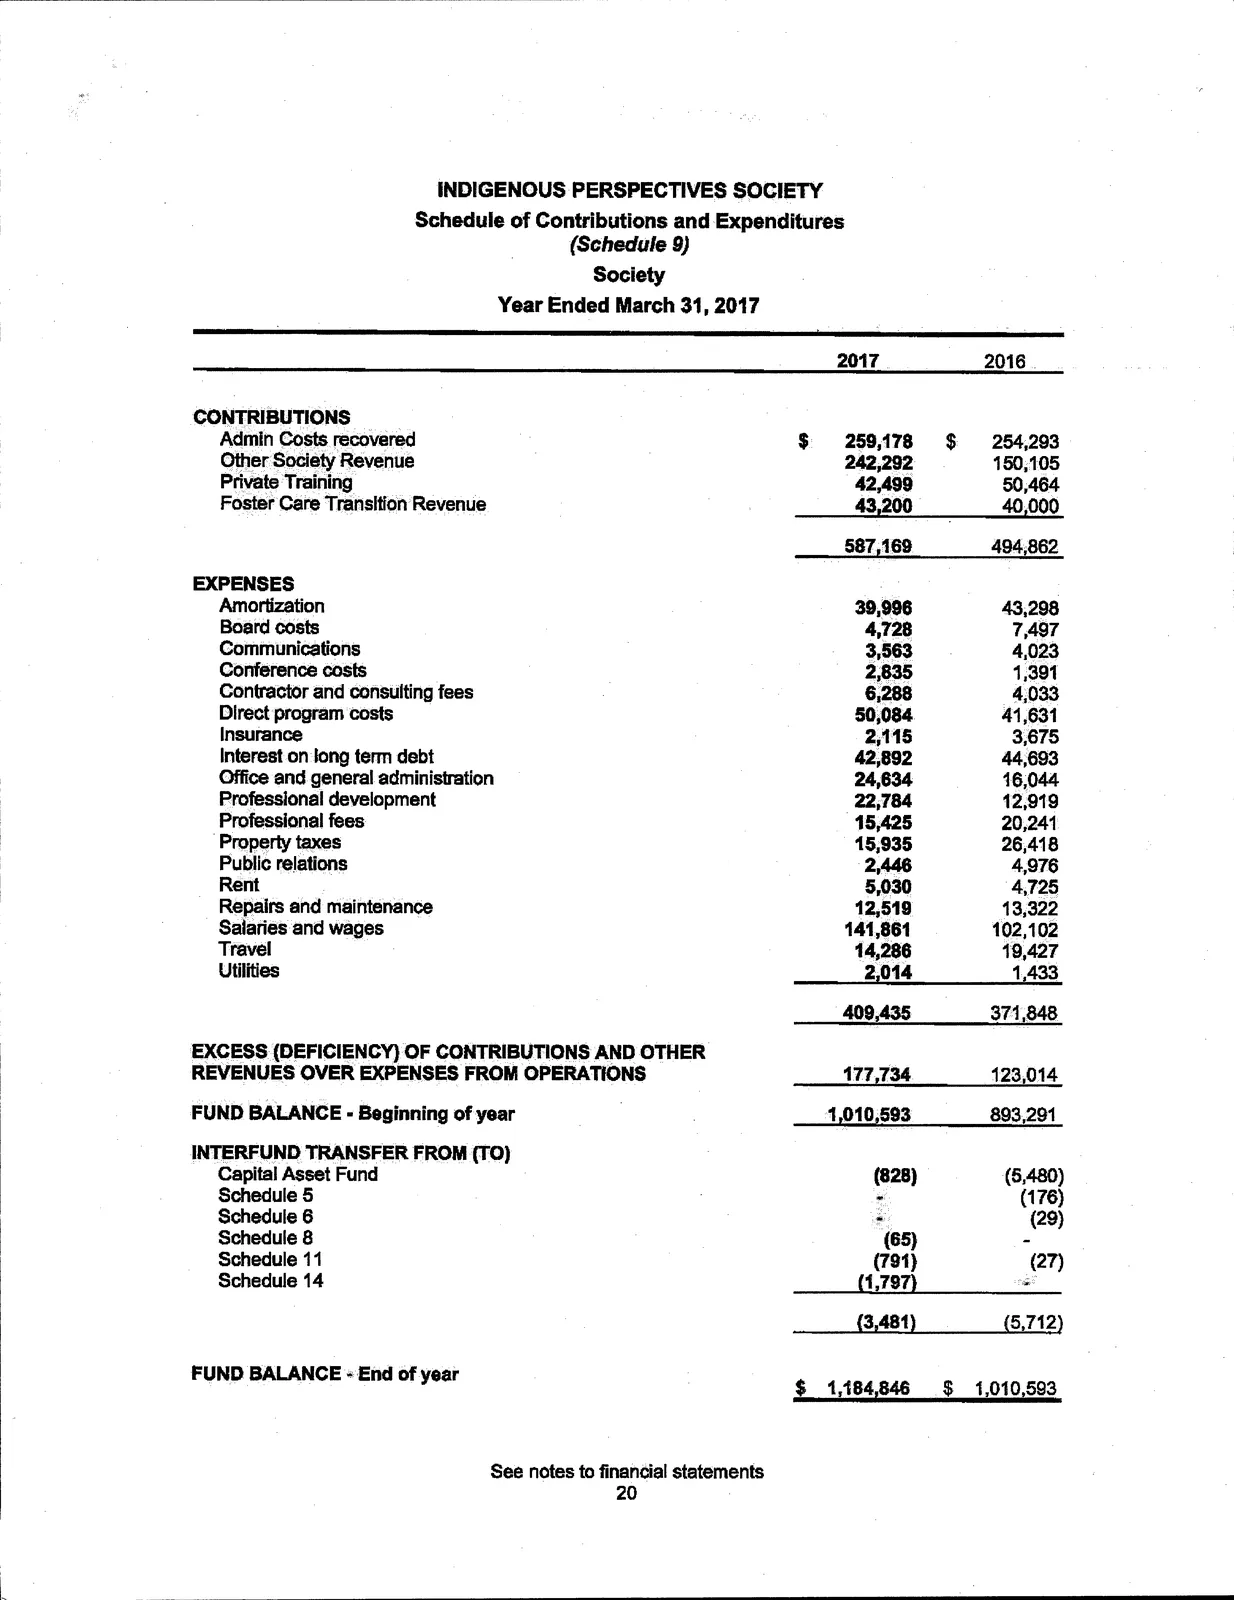
- Schedule of Contributions and Expenditures (Schedule 9) — 20
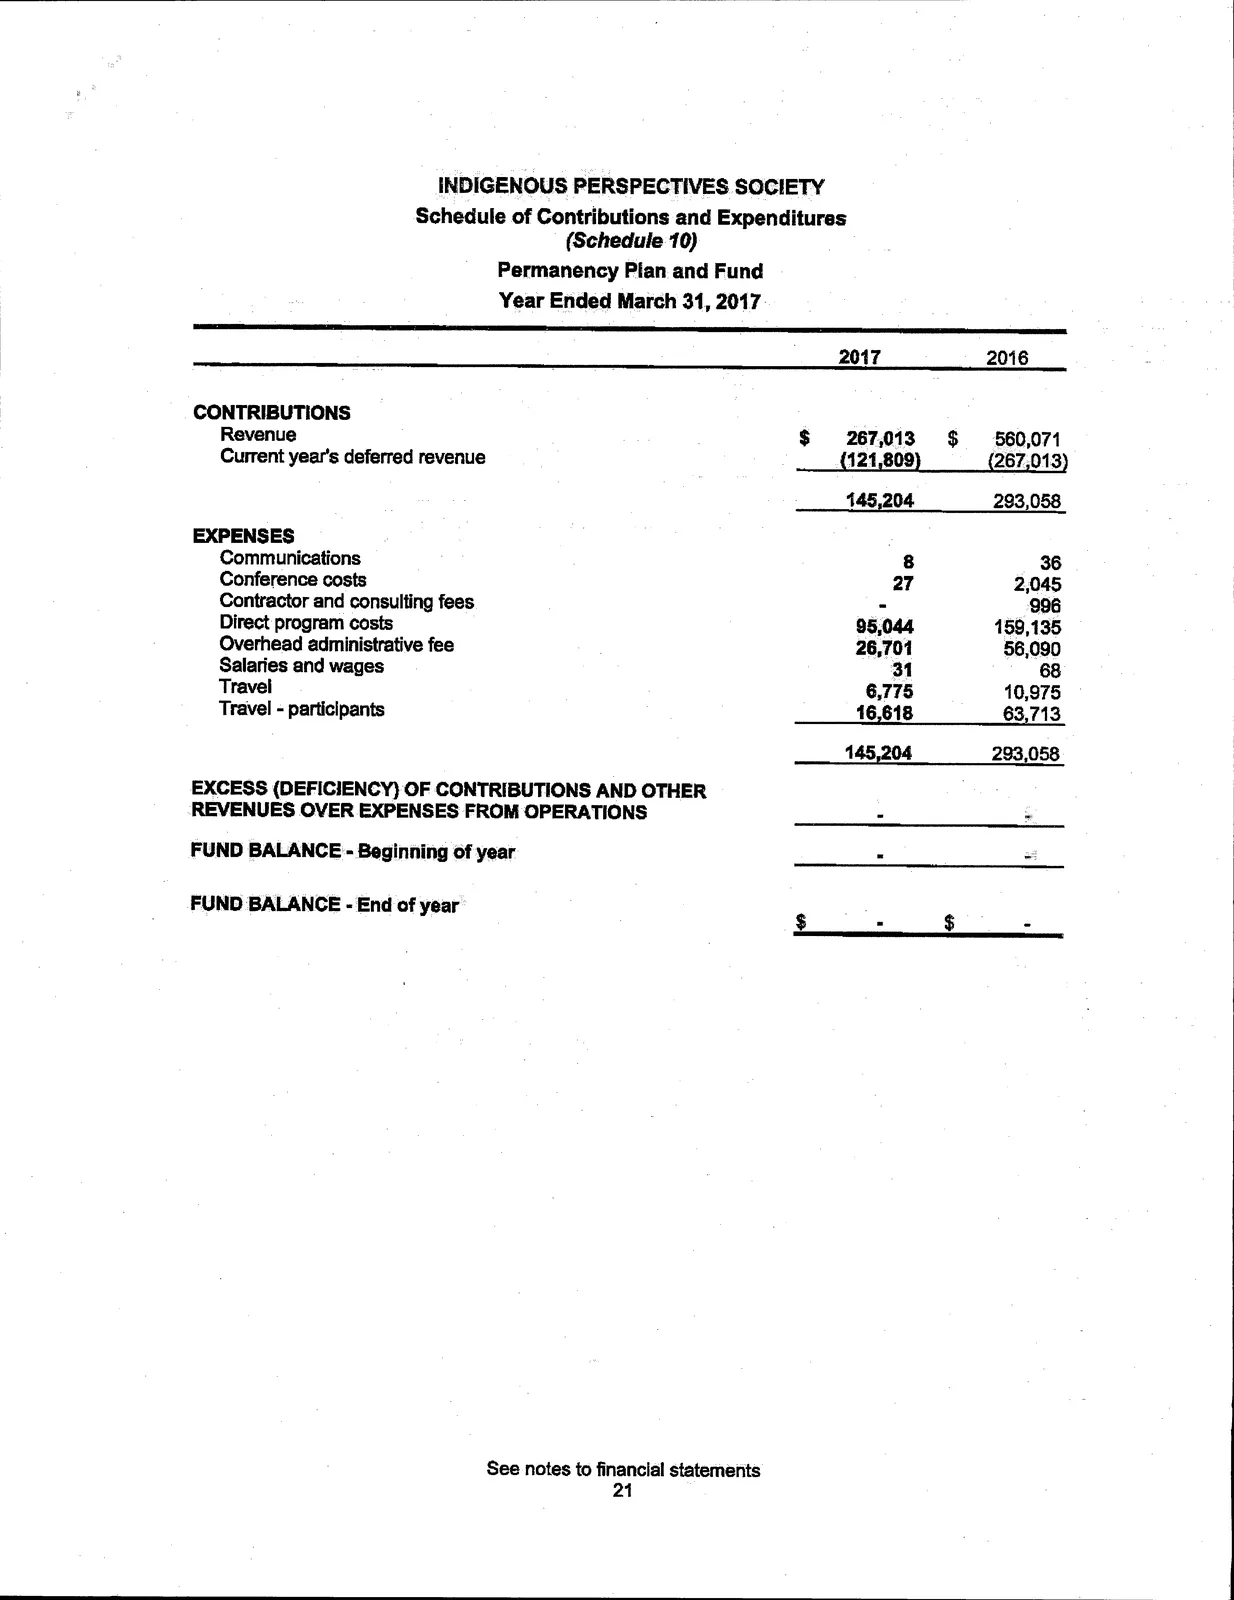
- Schedule of Contributions and Expenditures (Schedule 10) — 21
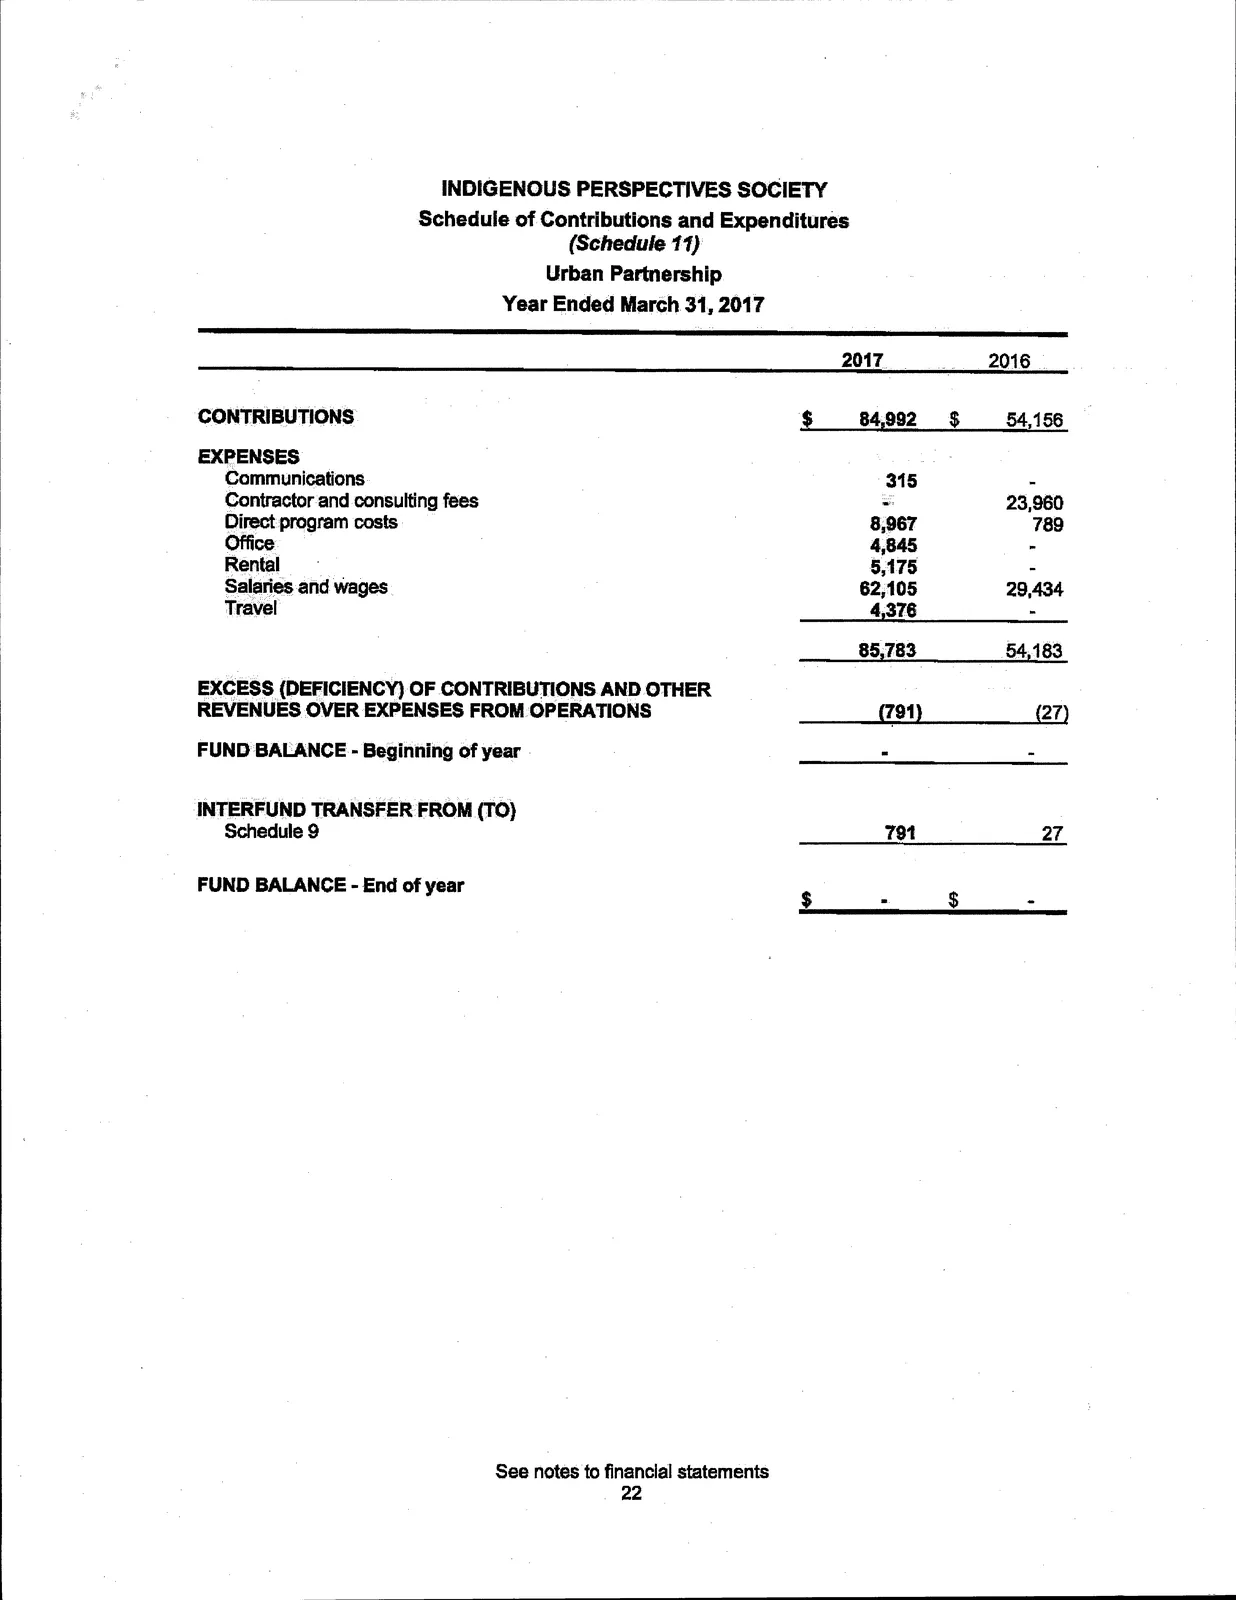
- Schedule of Contributions and Expenditures (Schedule 11) — 22
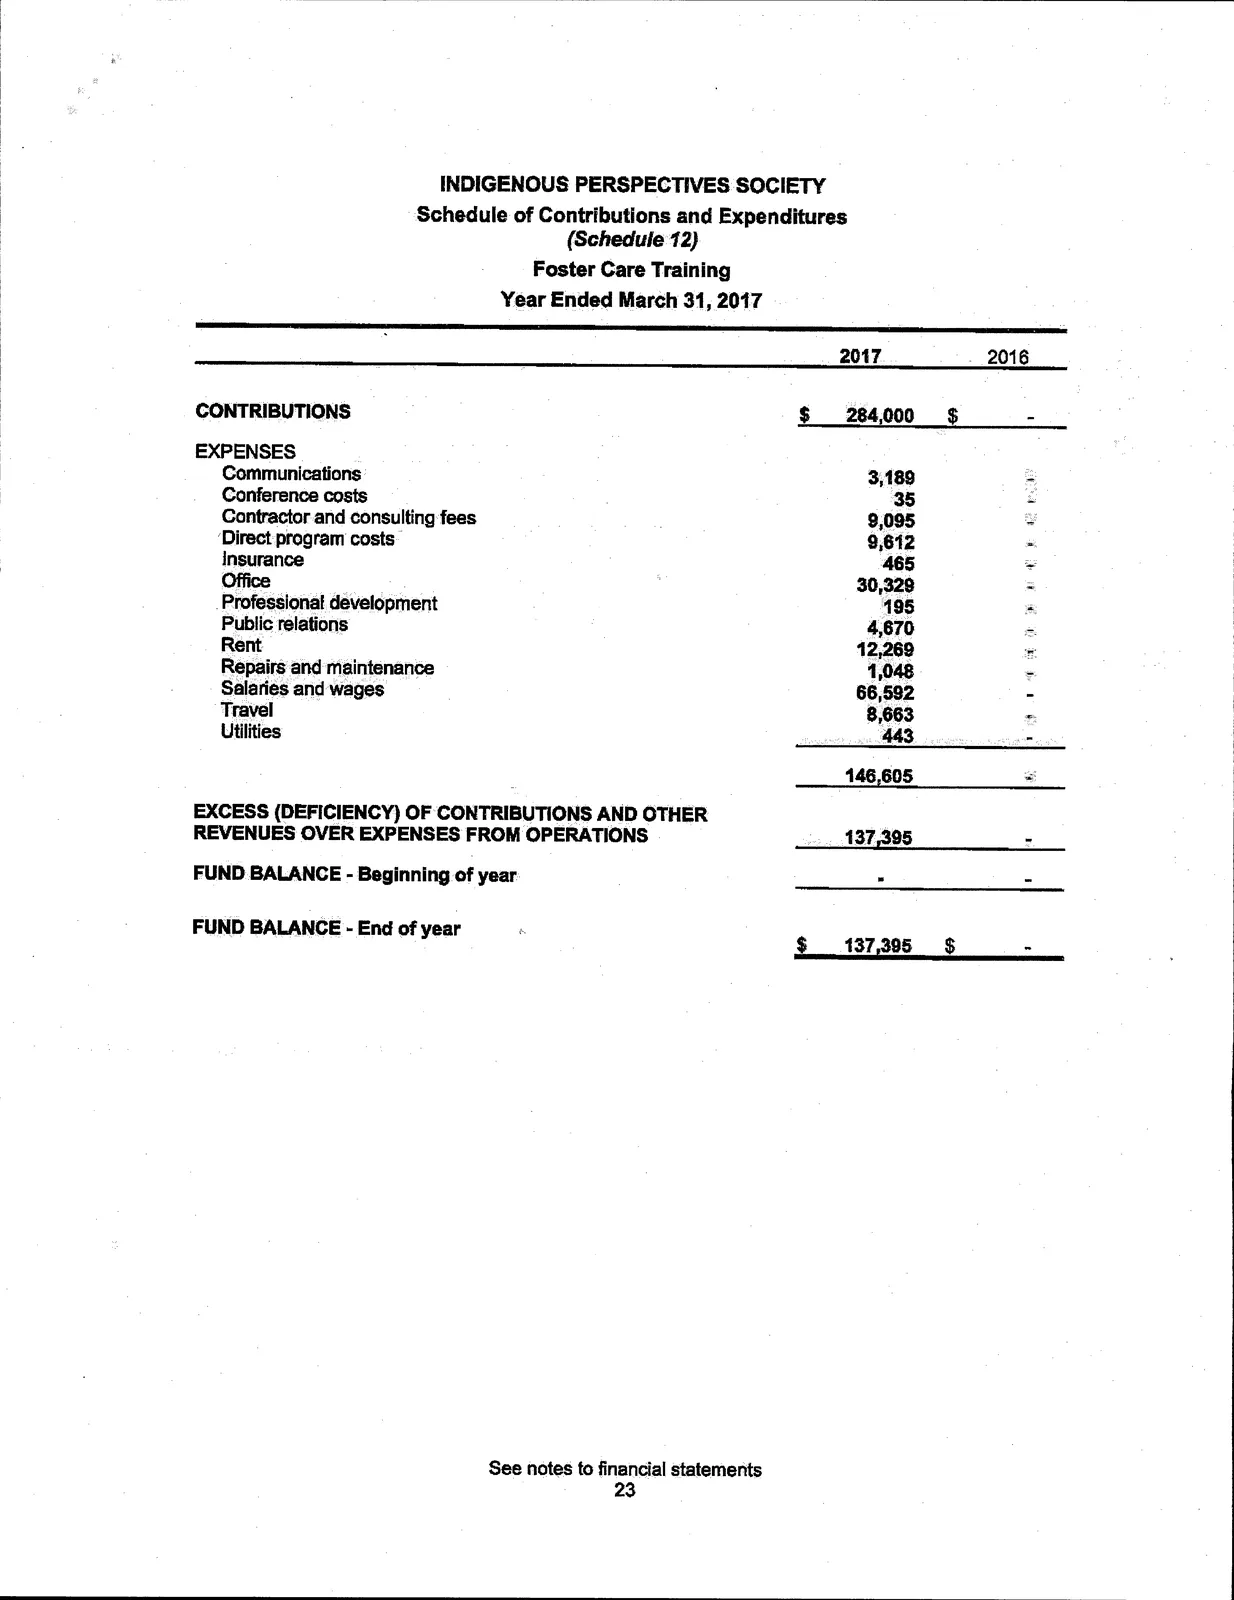
- Schedule of Contributions and Expenditures (Schedule 12) — 23
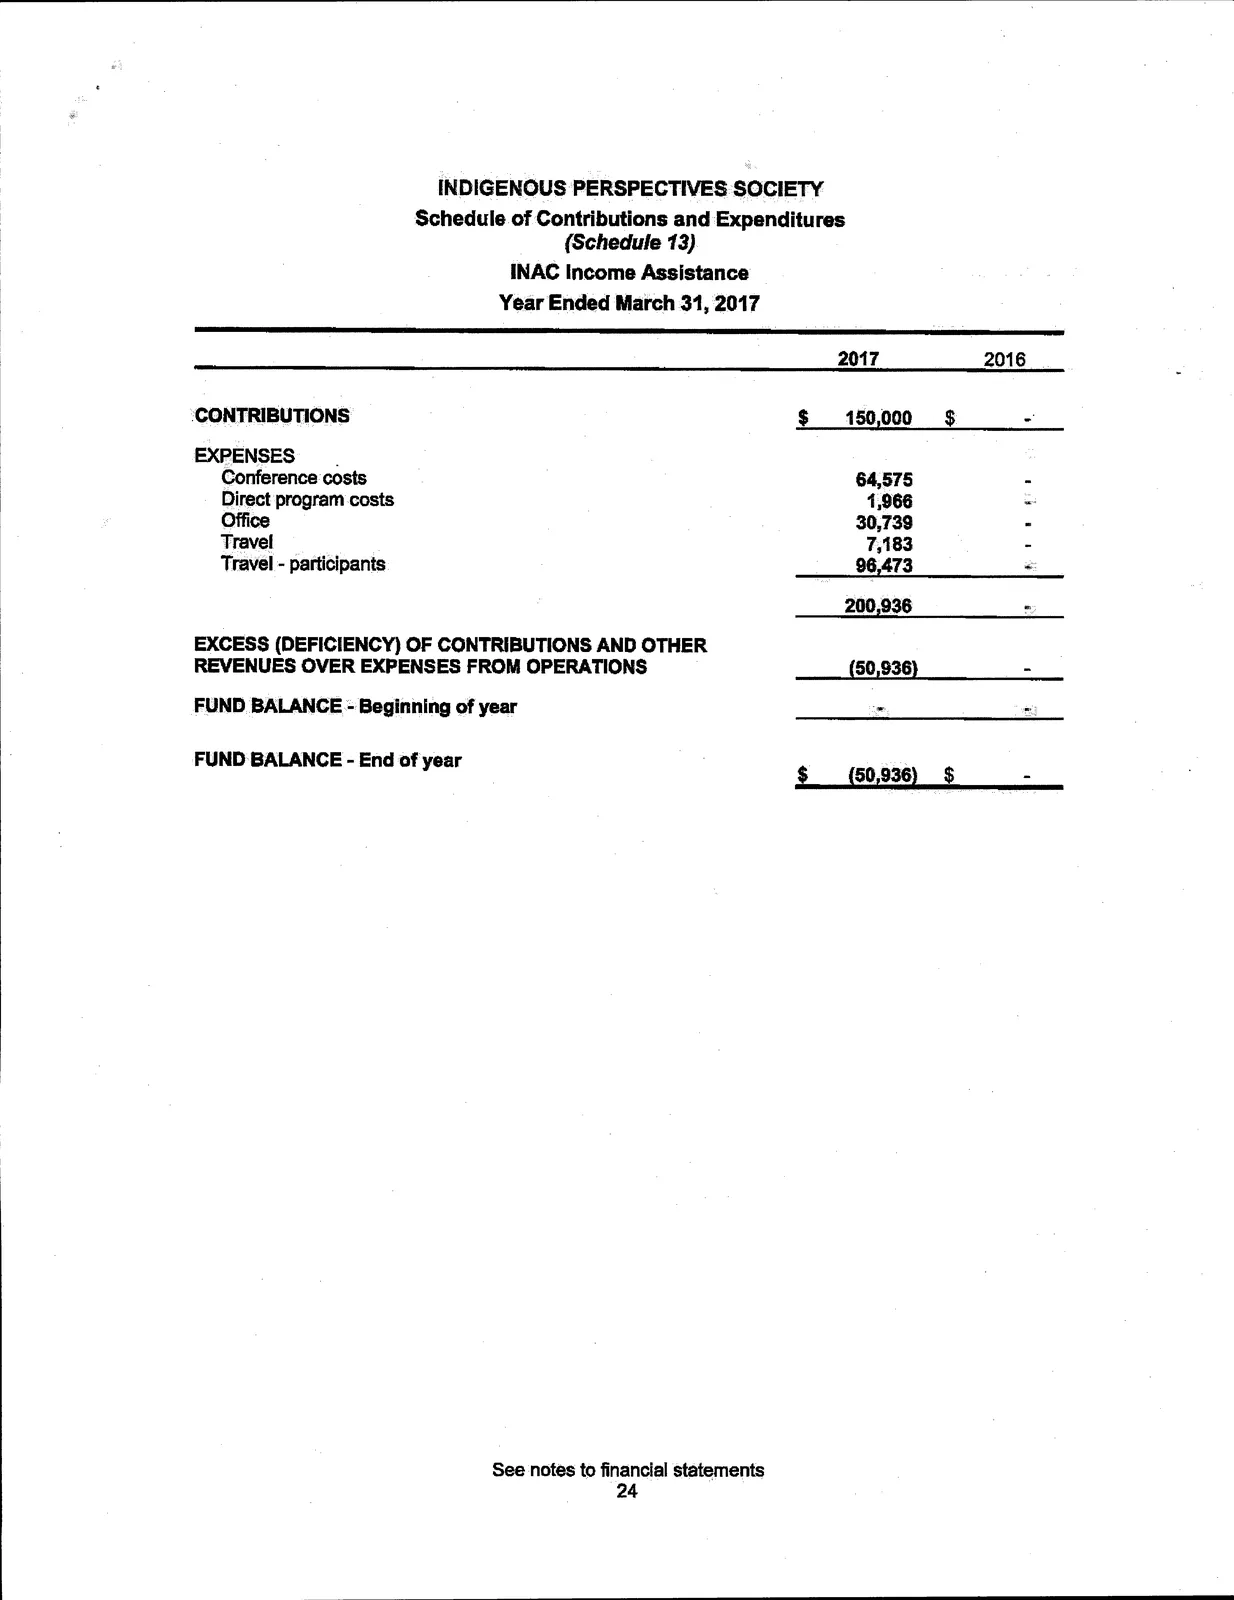
- Schedule of Contributions and Expenditures (Schedule 13) — 24
- Schedule of Contributions and Expenditures (Schedule 14) — 25
Management's Responsibility for Financial Reporting
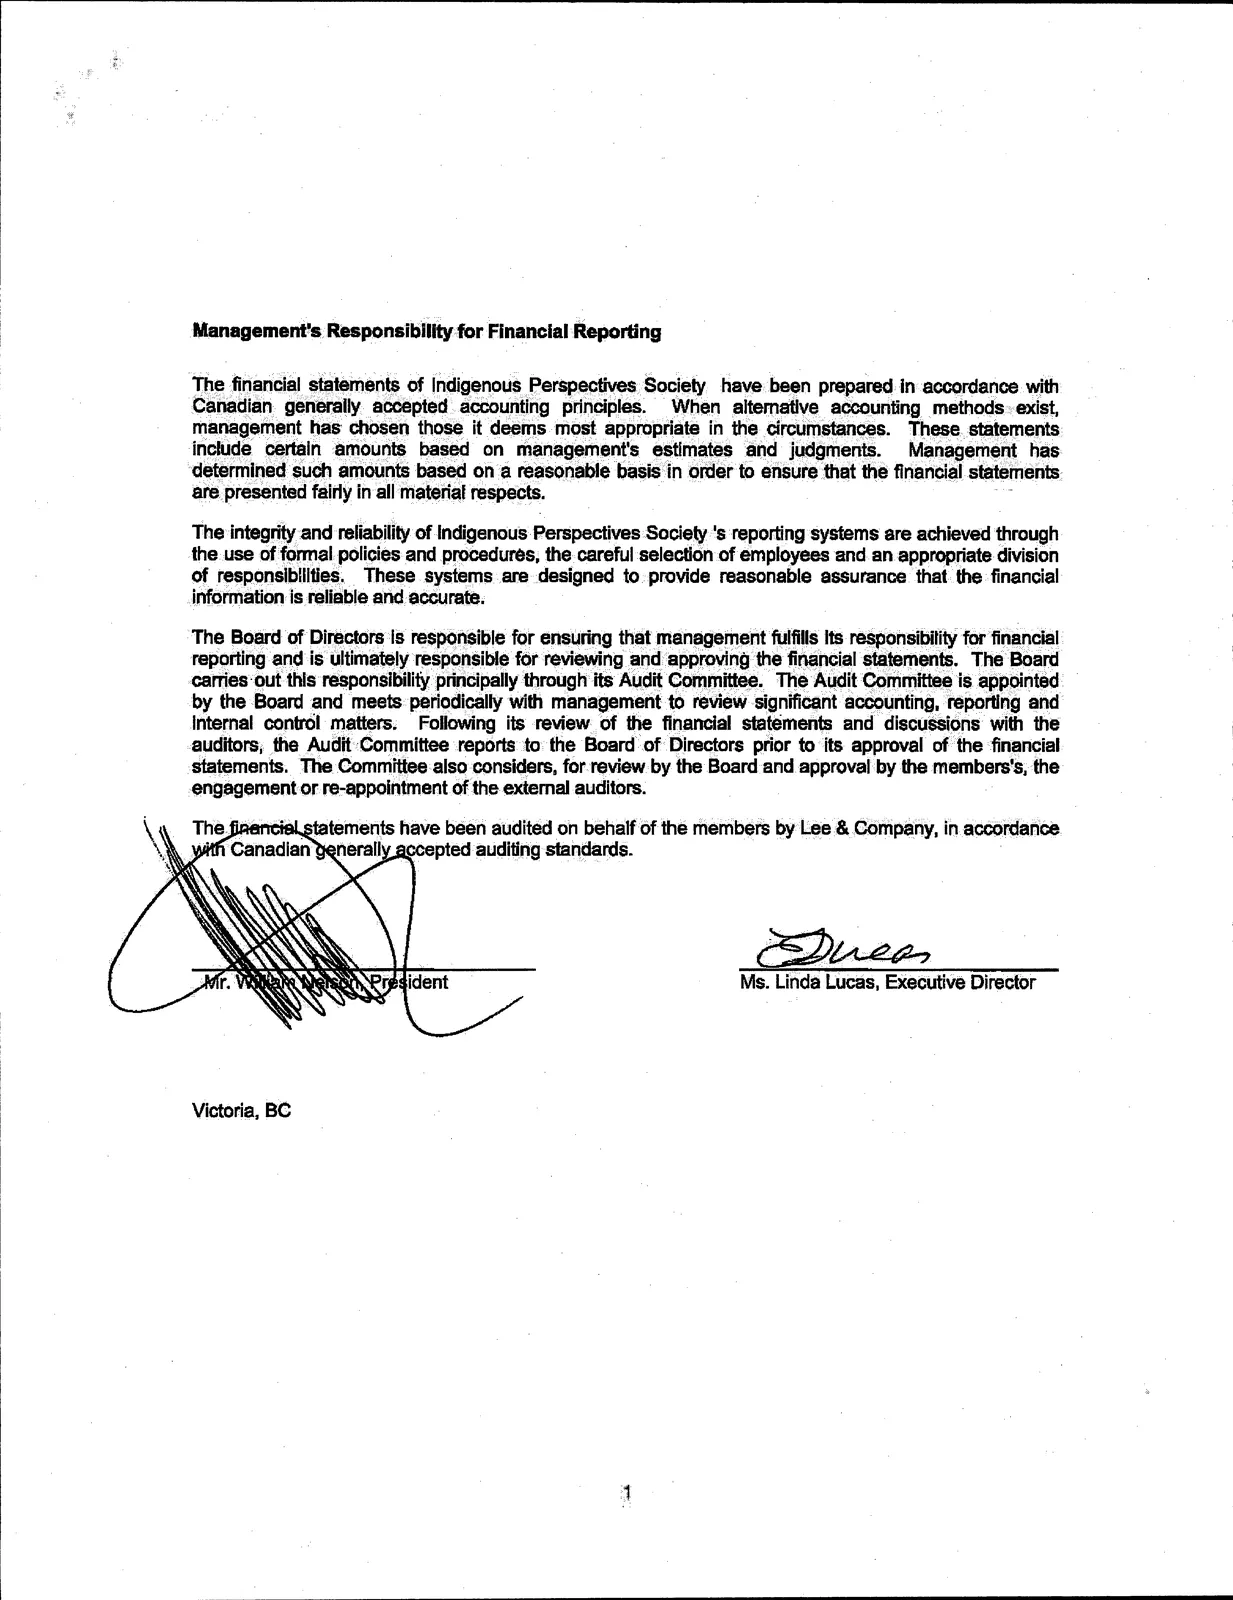
The financial statements of Indigenous Perspectives Society have been prepared in accordance with Canadian generally accepted accounting principles. When alternative accounting methods exist, management has chosen those it deems most appropriate in the circumstances. These statements include certain amounts based on management's estimates and judgments. Management has determined such amounts based on a reasonable basis in order to ensure that the financial statements are presented fairly in all material respects.
The integrity and reliability of Indigenous Perspectives Society's reporting systems are achieved through the use of formal policies and procedures, the careful selection of employees and an appropriate division of responsibilities. These systems are designed to provide reasonable assurance that the financial information is reliable and accurate.
The Board of Directors is responsible for ensuring that management fulfills its responsibility for financial reporting and is ultimately responsible for reviewing and approving the financial statements. The Board carries out this responsibility principally through its Audit Committee. The Audit Committee is appointed by the Board and meets periodically with management to review significant accounting, reporting and internal control matters. Following its review of the financial statements and discussions with the auditors, the Audit Committee reports to the Board of Directors prior to its approval of the financial statements. The Committee also considers, for review by the Board and approval by the members, the engagement or re-appointment of the external auditors.
The financial statements have been audited on behalf of the members by Lee & Company, in accordance with Canadian generally accepted auditing standards.
Ms. Linda Lucas, Executive Director
Victoria, BC
Independent Auditor's Report
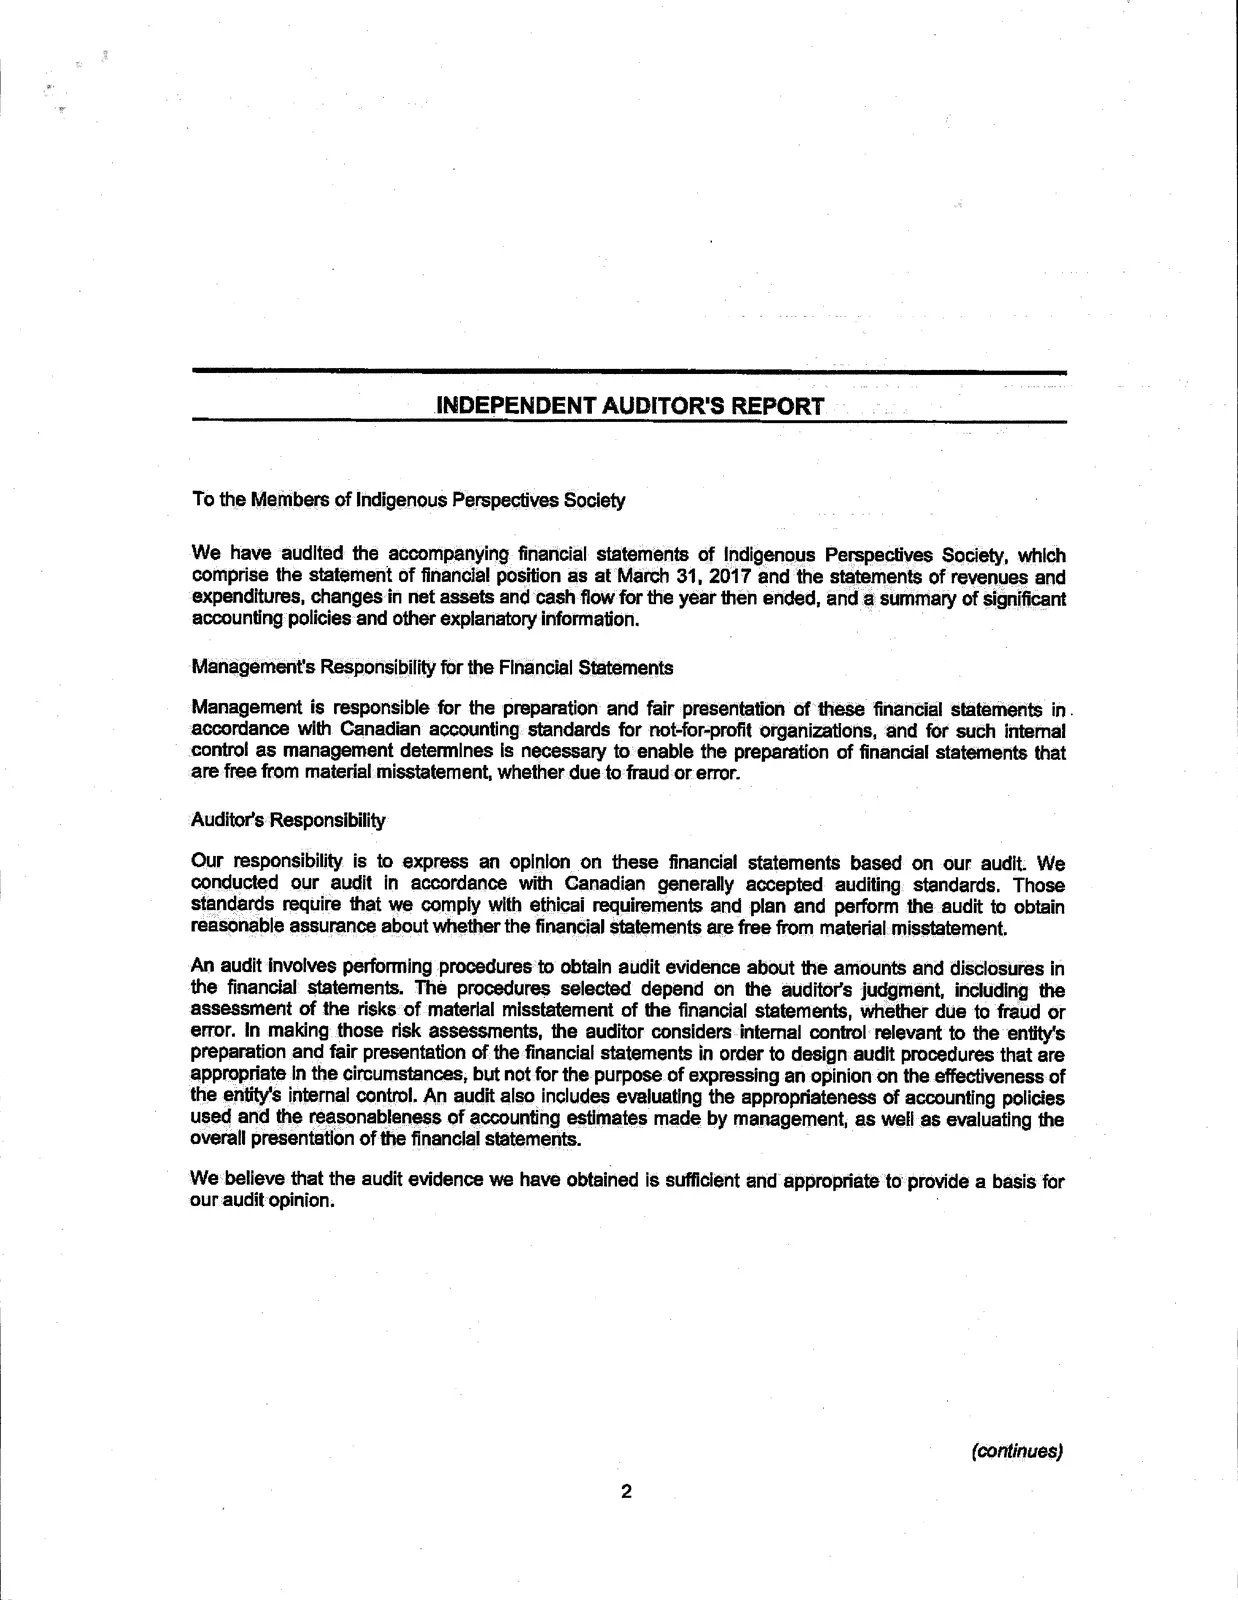
To the Members of Indigenous Perspectives Society
We have audited the accompanying financial statements of Indigenous Perspectives Society, which comprise the statement of financial position as at March 31, 2017 and the statements of revenues and expenditures, changes in net assets and cash flow for the year then ended, and a summary of significant accounting policies and other explanatory information.
Management's responsibility for the financial statements
Management is responsible for the preparation and fair presentation of these financial statements in accordance with Canadian accounting standards for not-for-profit organizations, and for such internal control as management determines is necessary to enable the preparation of financial statements that are free from material misstatement, whether due to fraud or error.
Auditor's responsibility
Our responsibility is to express an opinion on these financial statements based on our audit. We conducted our audit in accordance with Canadian generally accepted auditing standards. Those standards require that we comply with ethical requirements and plan and perform the audit to obtain reasonable assurance about whether the financial statements are free from material misstatement.
An audit involves performing procedures to obtain audit evidence about the amounts and disclosures in the financial statements. The procedures selected depend on the auditor's judgment, including the assessment of the risks of material misstatement of the financial statements, whether due to fraud or error. In making those risk assessments, the auditor considers internal control relevant to the entity's preparation and fair presentation of the financial statements in order to design audit procedures that are appropriate in the circumstances, but not for the purpose of expressing an opinion on the effectiveness of the entity's internal control. An audit also includes evaluating the appropriateness of accounting policies used and the reasonableness of accounting estimates made by management, as well as evaluating the overall presentation of the financial statements.
We believe that the audit evidence we have obtained is sufficient and appropriate to provide a basis for our audit opinion.
(continued — see next page)
Opinion
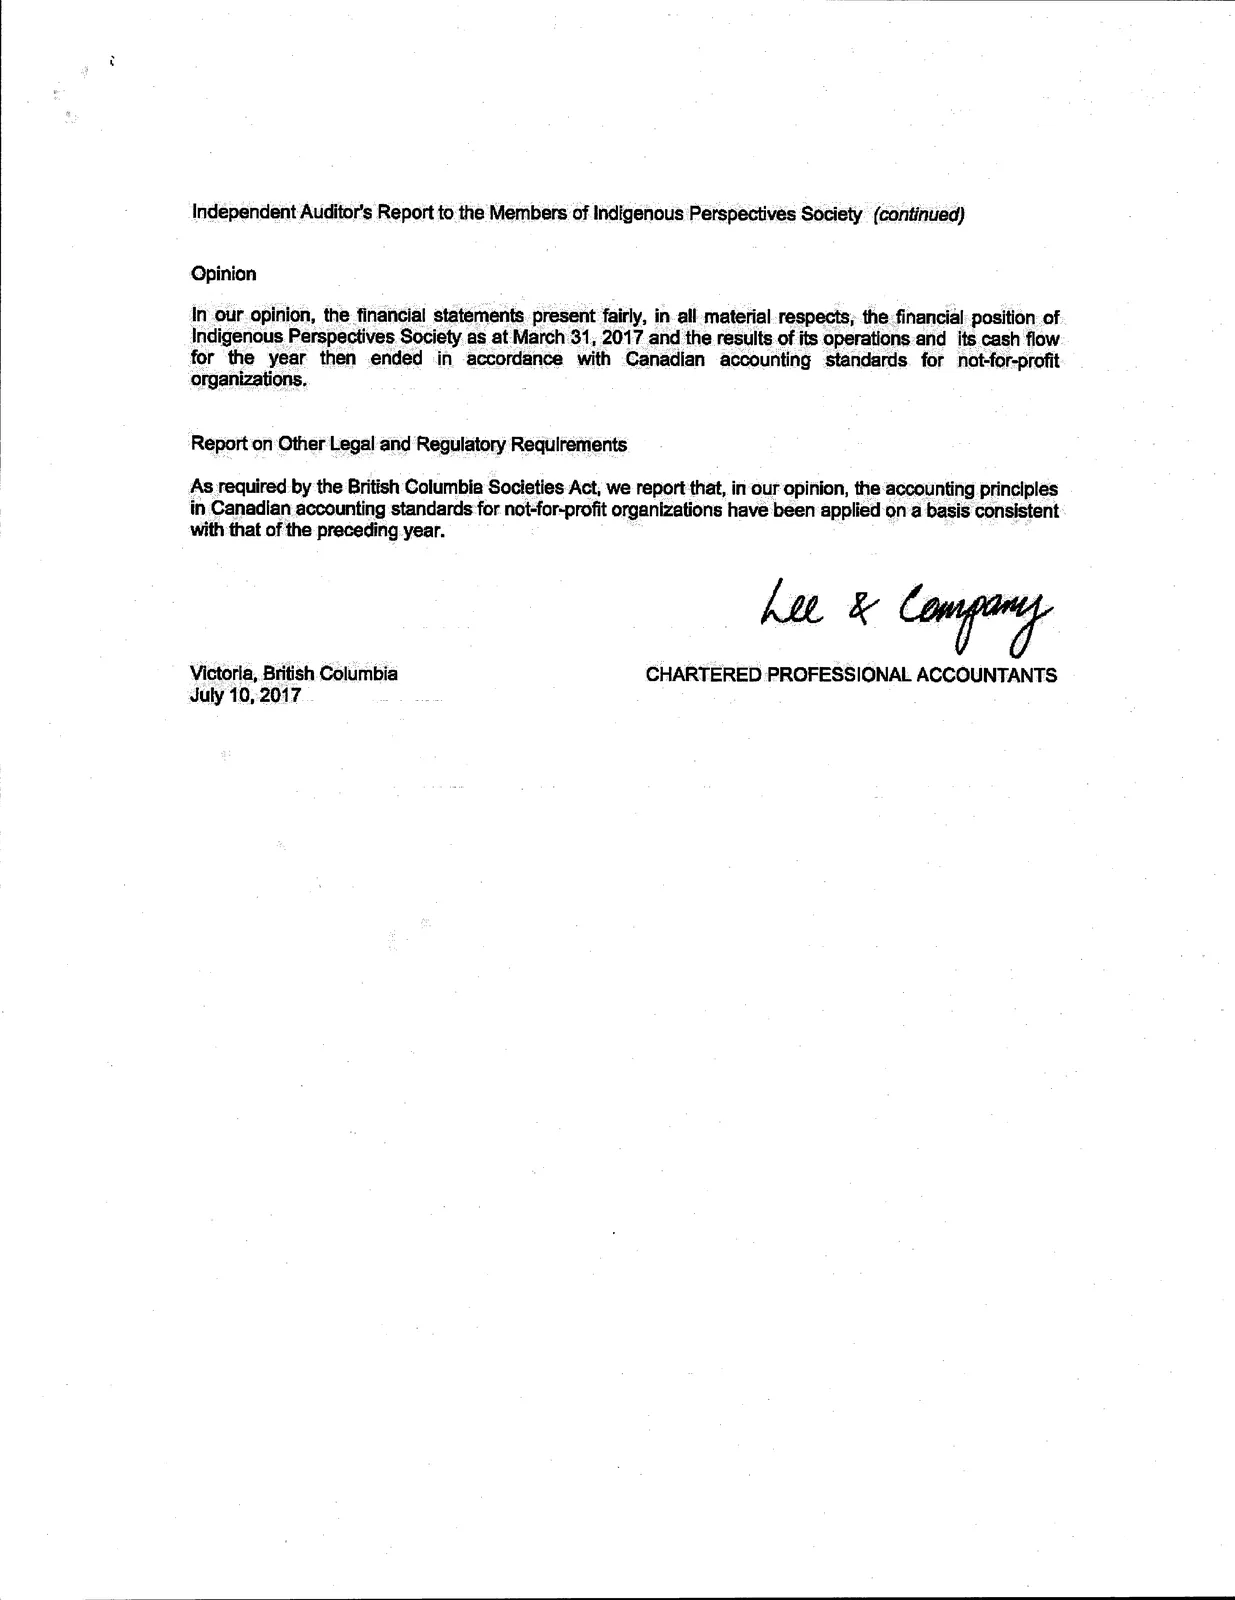
In our opinion, the financial statements present fairly, in all material respects, the financial position of Indigenous Perspectives Society as at March 31, 2017 and the results of its operations and its cash flow for the year then ended in accordance with Canadian accounting standards for not‑for‑profit organizations.
Report on other legal and regulatory requirements
As required by the British Columbia Societies Act, we report that, in our opinion, the accounting principles in Canadian accounting standards for not-for‑profit organizations have been applied on a basis consistent with that of the preceding year.
Victoria, British Columbia
CHARTERED PROFESSIONAL ACCOUNTANTS
July 10, 2017
Statement of Financial Position
March 31, 2017
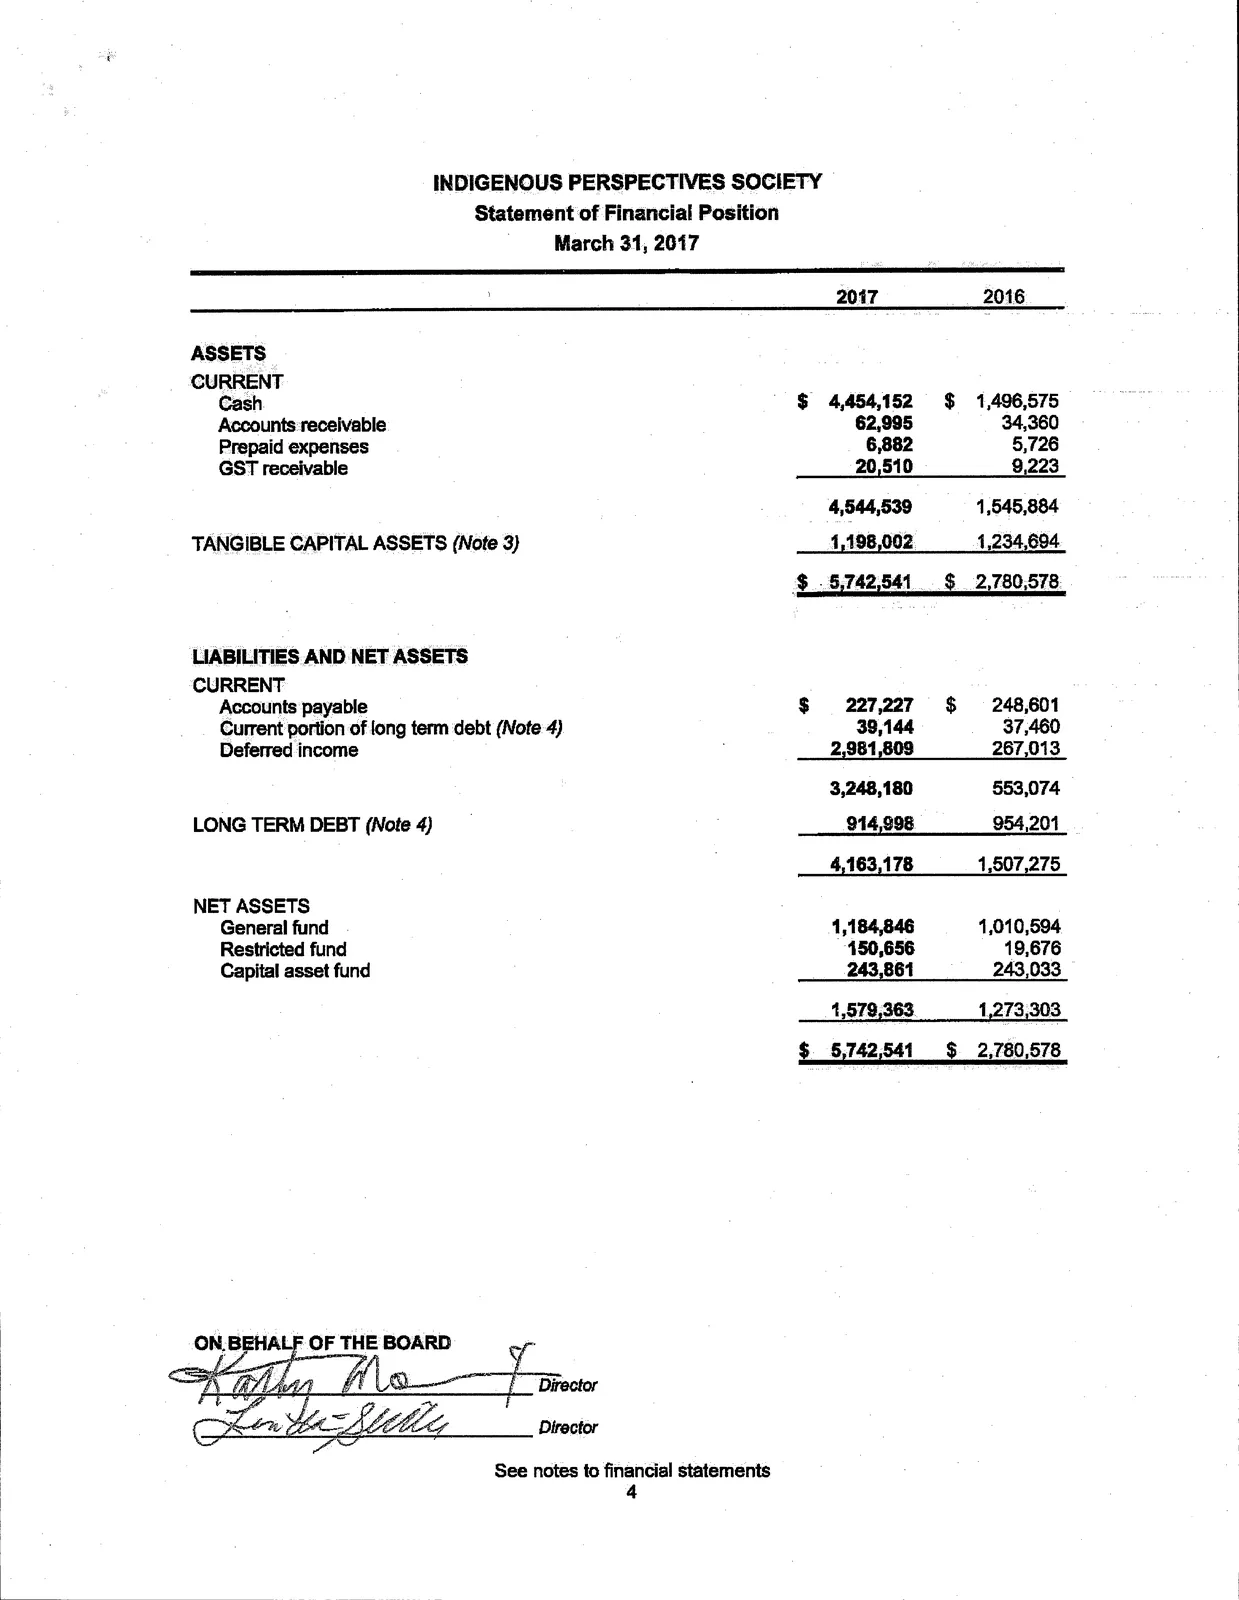
| ASSETS | 2017 | 2016 |
|---|---|---|
| Current | ||
| Cash | $4,454,152 | $1,496,575 |
| Accounts receivable | 62,995 | 34,360 |
| Prepaid expenses | 6,882 | 5,726 |
| GST receivable | ||
| Tangible capital assets (Note 3) | 1,198,002 | 1,234,694 |
| Total assets | $5,742,541 | $2,780,578 |
| LIABILITIES AND NET ASSETS | 2017 | 2016 |
|---|---|---|
| Current | ||
| Accounts payable | $227,227 | $248,601 |
| Current portion of long term debt (Note 4) | 39,144 | 37,460 |
| Deferred income | 2,981,809 | 267,013 |
| Long term debt (Note 4) | 914,998 | 954,201 |
| Total liabilities | 3,248,180 | 1,507,275 |
| Net assets | ||
| General fund | 1,184,848 | 1,010,594 |
| Restricted fund | 150,856 | 19,676 |
| Capital asset fund | 243,881 | 243,033 |
| Total net assets | 1,579,363 | 1,273,303 |
| Total liabilities and net assets | $5,742,541 | $2,780,578 |
ON BEHALF OF THE BOARD
Director
Director
See notes to financial statements
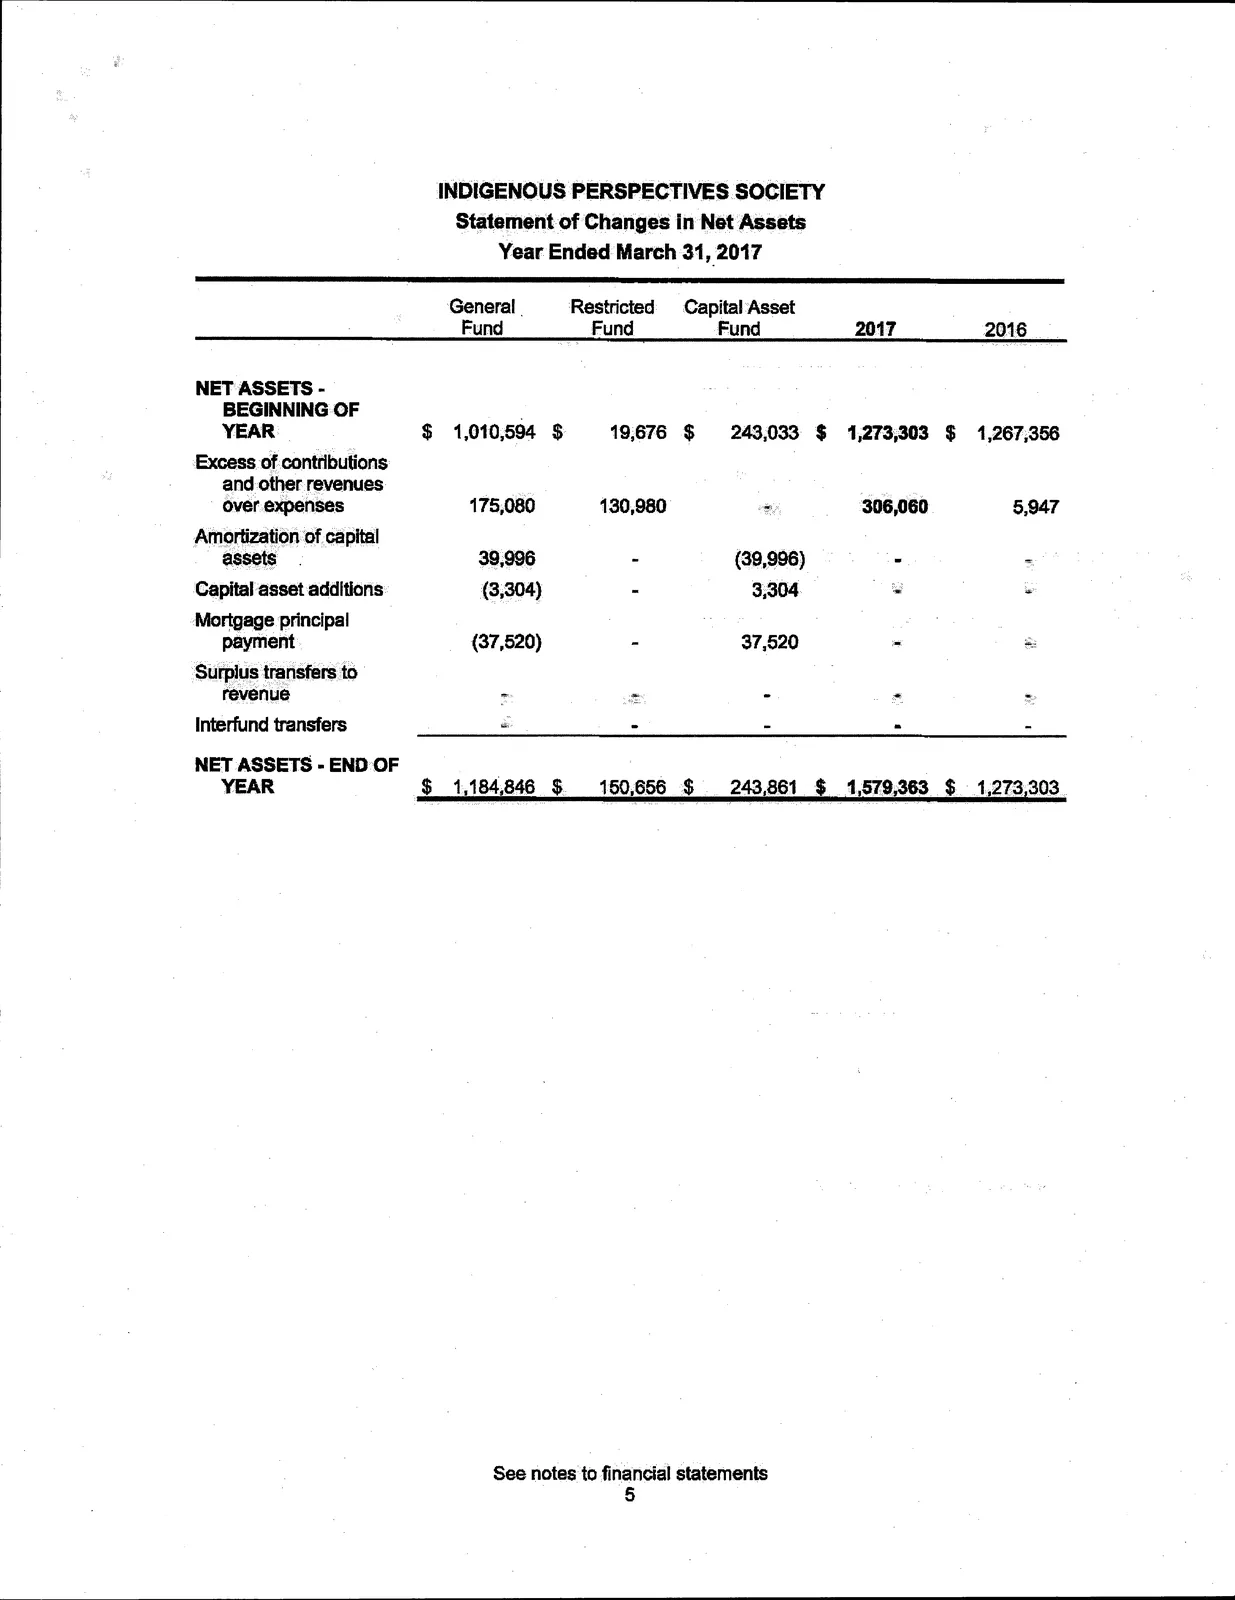
Statement of Changes in Net Assets
Year Ended March 31, 2017
| General Fund | Restricted Fund | Capital Asset Fund | Total 2017 | Total 2016 | |
|---|---|---|---|---|---|
| Net assets — beginning of year | $1,010,594 | $19,676 | $243,033 | $1,273,303 | $1,267,356 |
| Excess (deficit) of contributions and other revenues over expenses | 175,080 | 39,996 | (3,304) | 211,772 | — |
| Amortization of capital assets | (5,947) | — | 5,947 | — | — |
| Capital asset additions | — | — | — | — | — |
| Mortgage principal payment | (37,520) | — | 37,520 | — | — |
| Surplus transfers to revenue | — | — | — | — | — |
| Interfund transfers | 3,304 | (39,996) | 36,692 | — | — |
| Net assets — end of year | $1,184,846 | $150,656 | $243,861 | $1,579,363 | $1,273,303 |
See notes to financial statements
Statement of Revenues and Expenditures
For the Year Ended March 31, 2017
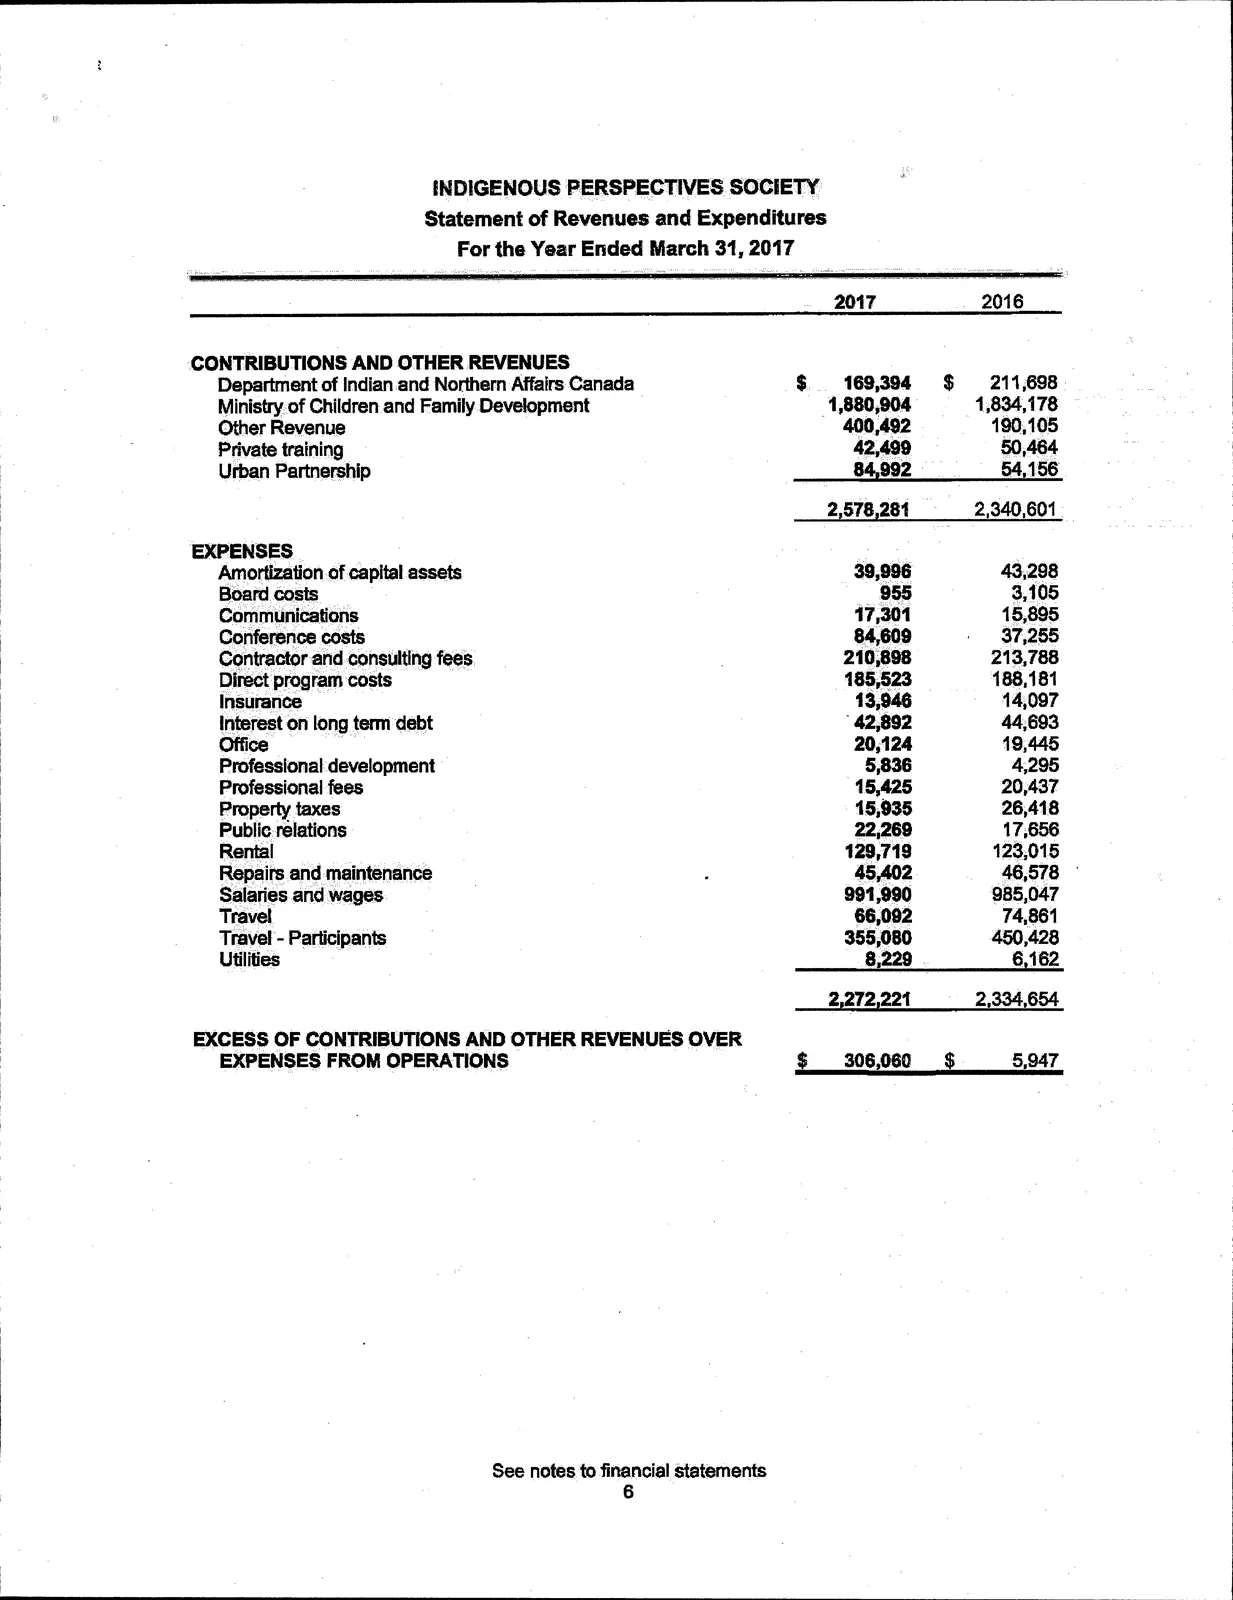
| CONTRIBUTIONS AND OTHER REVENUES | 2017 | 2016 |
|---|---|---|
| Department of Indian and Northern Affairs Canada | $169,394 | $211,698 |
| Ministry of Children and Family Development | 1,880,904 | 1,834,178 |
| Other revenue | 400,492 | 190,105 |
| Private training | 42,499 | 50,464 |
| Urban Partnership | 84,992 | 54,156 |
| Total contributions and other revenues | $2,578,281 | $2,340,601 |
| EXPENSES | 2017 | 2016 |
|---|---|---|
| Amortization of capital assets | $30,996 | $43,298 |
| Board costs | 955 | 3,105 |
| Communications | 17,361 | 15,895 |
| Conference costs | 84,609 | 37,255 |
| Contractor and consulting fees | 216,898 | 213,788 |
| Direct program costs | 185,523 | 188,181 |
| Insurance | 19,946 | 14,097 |
| Interest on long term debt | 42,892 | 44,693 |
| Office | 20,124 | 19,445 |
| Professional development | 5,836 | 4,295 |
| Professional fees | 15,425 | 20,437 |
| Property taxes | 15,935 | 26,418 |
| Public relations | 22,269 | 17,656 |
| Rental | 129,719 | 123,015 |
| Repairs and maintenance | 45,402 | 46,578 |
| Salaries and wages | 991,990 | 985,047 |
| Travel | 45,402 | 74,861 |
| Travel — Participants | 355,080 | 450,428 |
| Utilities | 8,229 | 6,162 |
| Total expenses | $2,272,221 | $2,334,654 |
Excess of contributions and other revenues over expenses from operations: $306,060 (2017) | $5,947 (2016)
See notes to financial statements
Statement of Cash Flow
Year Ended March 31, 2017
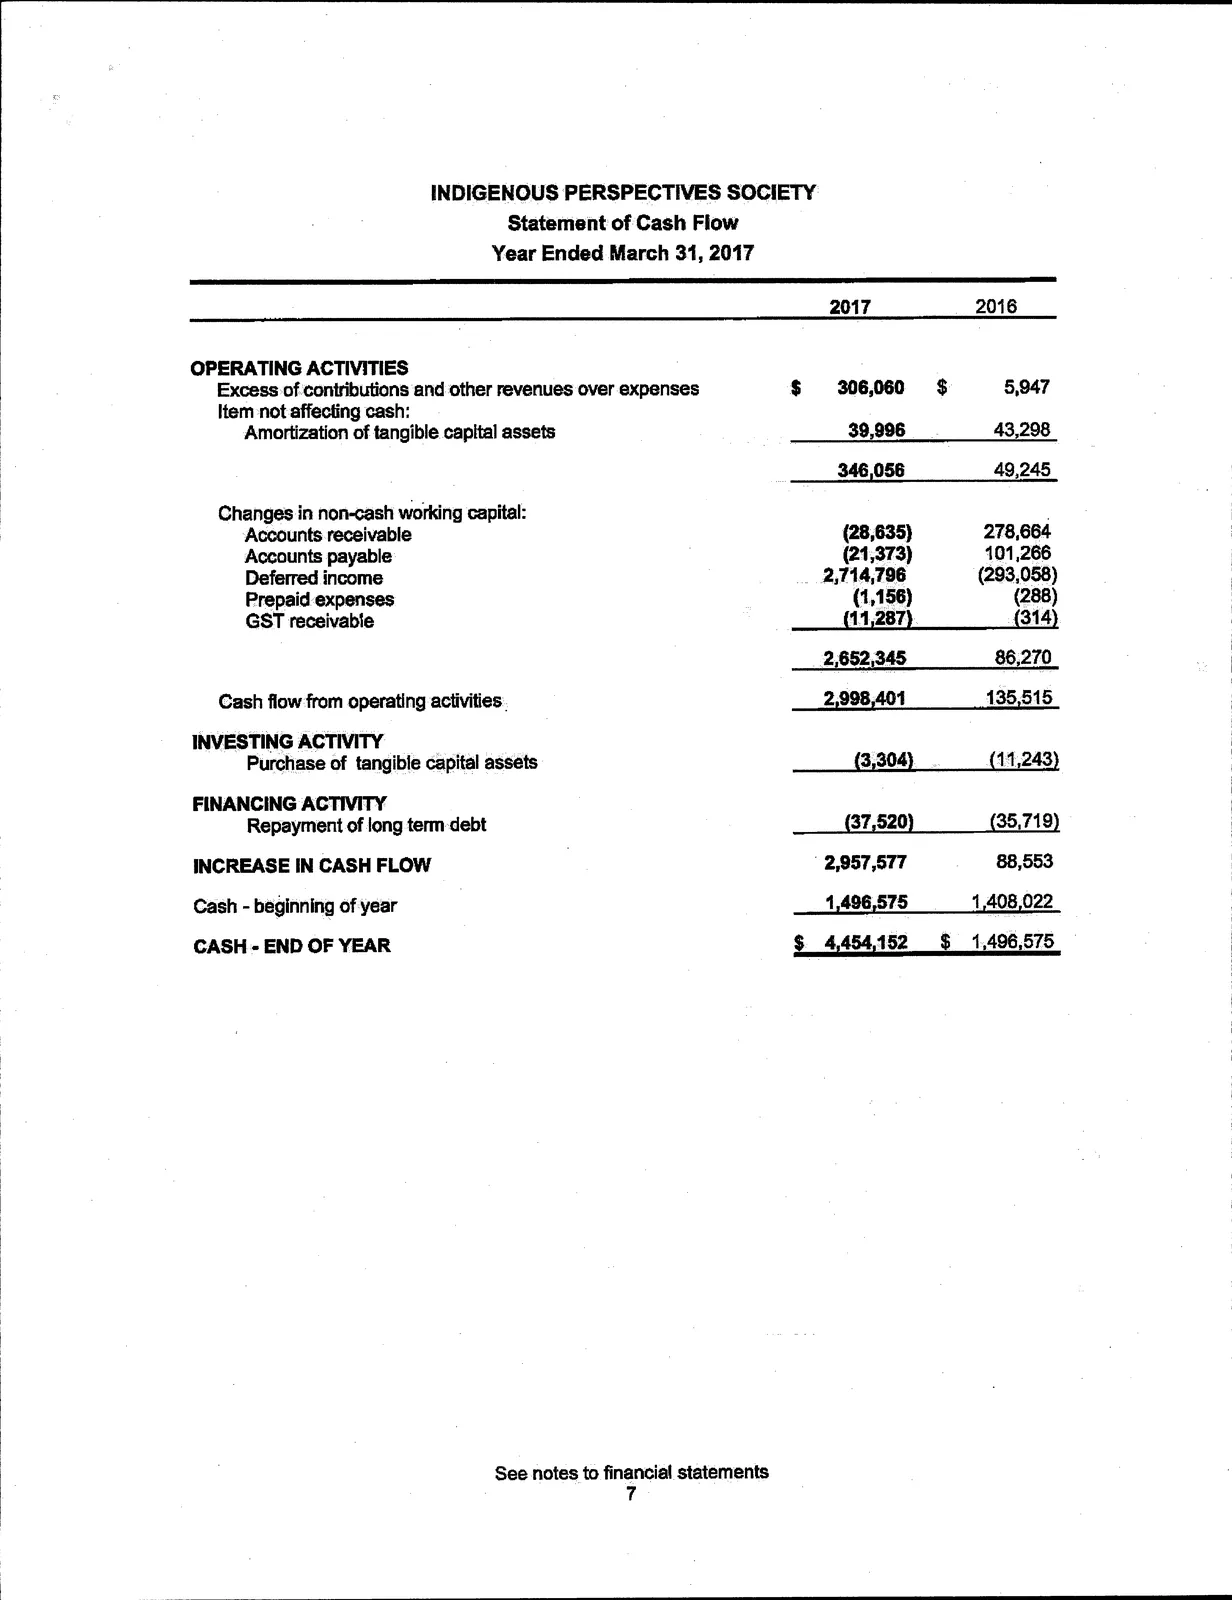
| OPERATING ACTIVITIES | 2017 | 2016 |
|---|---|---|
| Excess of contributions and other revenues over expenses | $306,060 | $5,947 |
| Items not affecting cash: | ||
| Amortization of tangible capital assets | 39,996 | 43,298 |
| Changes in non-cash working capital: | ||
| Accounts receivable | (28,635) | (13,304) |
| Accounts payable | (21,373) | (11,243) |
| Deferred income | 2,714,796 | (293,058) |
| Prepaid expenses | (1,156) | (37,520) |
| GST receivable | 5,947 | (35,719) |
| Cash flow from operating activities | 278,664 | 2,957,577 |
| INVESTING ACTIVITY | ||
| Purchase of tangible capital assets | (101,266) | 88,553 |
| FINANCING ACTIVITY | ||
| Repayment of long term debt | (293,058) | 88,553 |
| INCREASE (DECREASE) IN CASH FLOW | 86,270 | (35,719) |
| Cash — beginning of year | 1,496,575 | 1,408,022 |
| Cash — end of year | $4,454,152 | $1,496,575 |
See notes to financial statements
Notes to Financial Statements
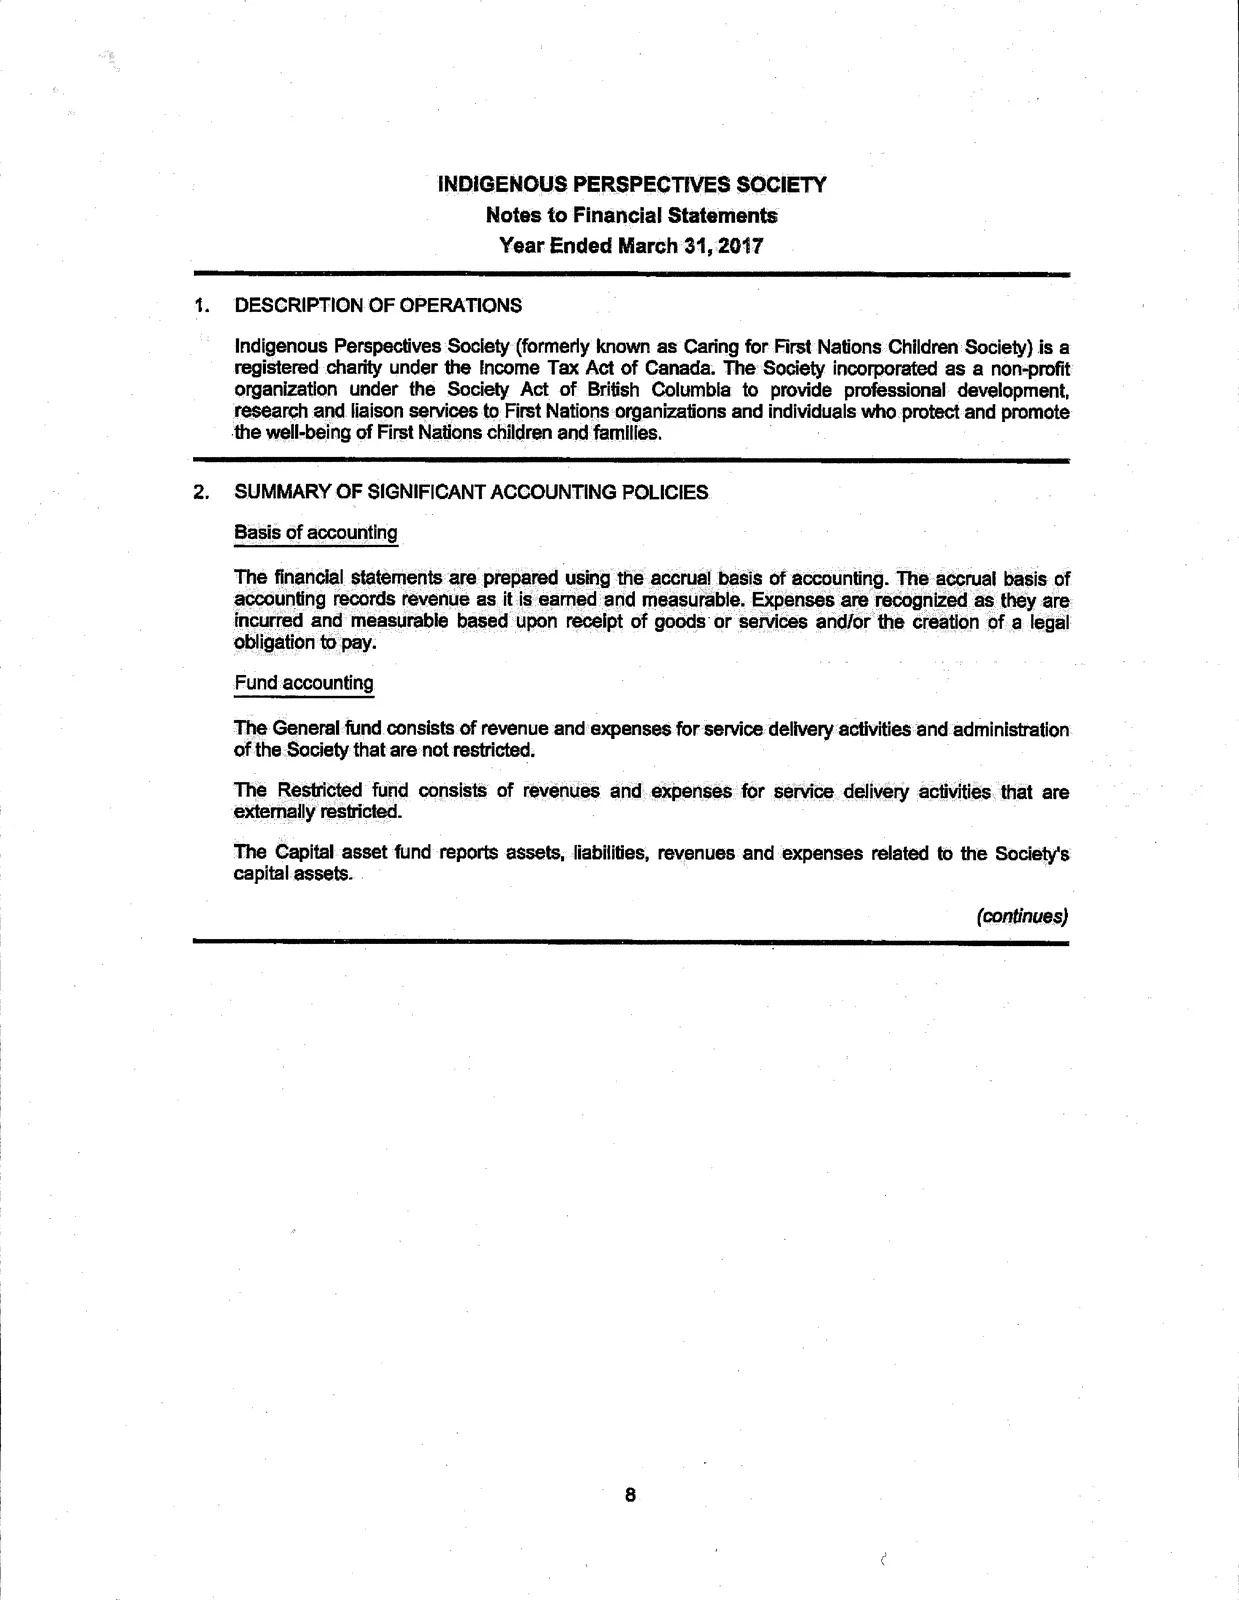
1. Description of Operations
Indigenous Perspectives Society (formerly known as Caring for First Nations Children Society) is a registered charity under the Income Tax Act of Canada. The Society incorporated as a non‑profit organization under the Society Act of British Columbia to provide professional development, research and liaison services to First Nations organizations and individuals who protect and promote the well‑being of First Nations children and families.
2. Summary of Significant Accounting Policies
Basis of accounting
The financial statements are prepared using the accrual basis of accounting. The accrual basis records revenue as it is earned and measurable. Expenses are recognized as they are incurred and measurable based upon receipt of goods or services and/or the creation of a legal obligation to pay.
Fund accounting
- General fund: consists of revenue and expenses for service delivery activities and administration of the Society that are not restricted.
- Restricted fund: consists of revenues and expenses for service delivery activities that are restricted to those activities.
- Capital asset fund: reports assets, liabilities, revenues and expenses related to the Society's capital assets.
(continued)
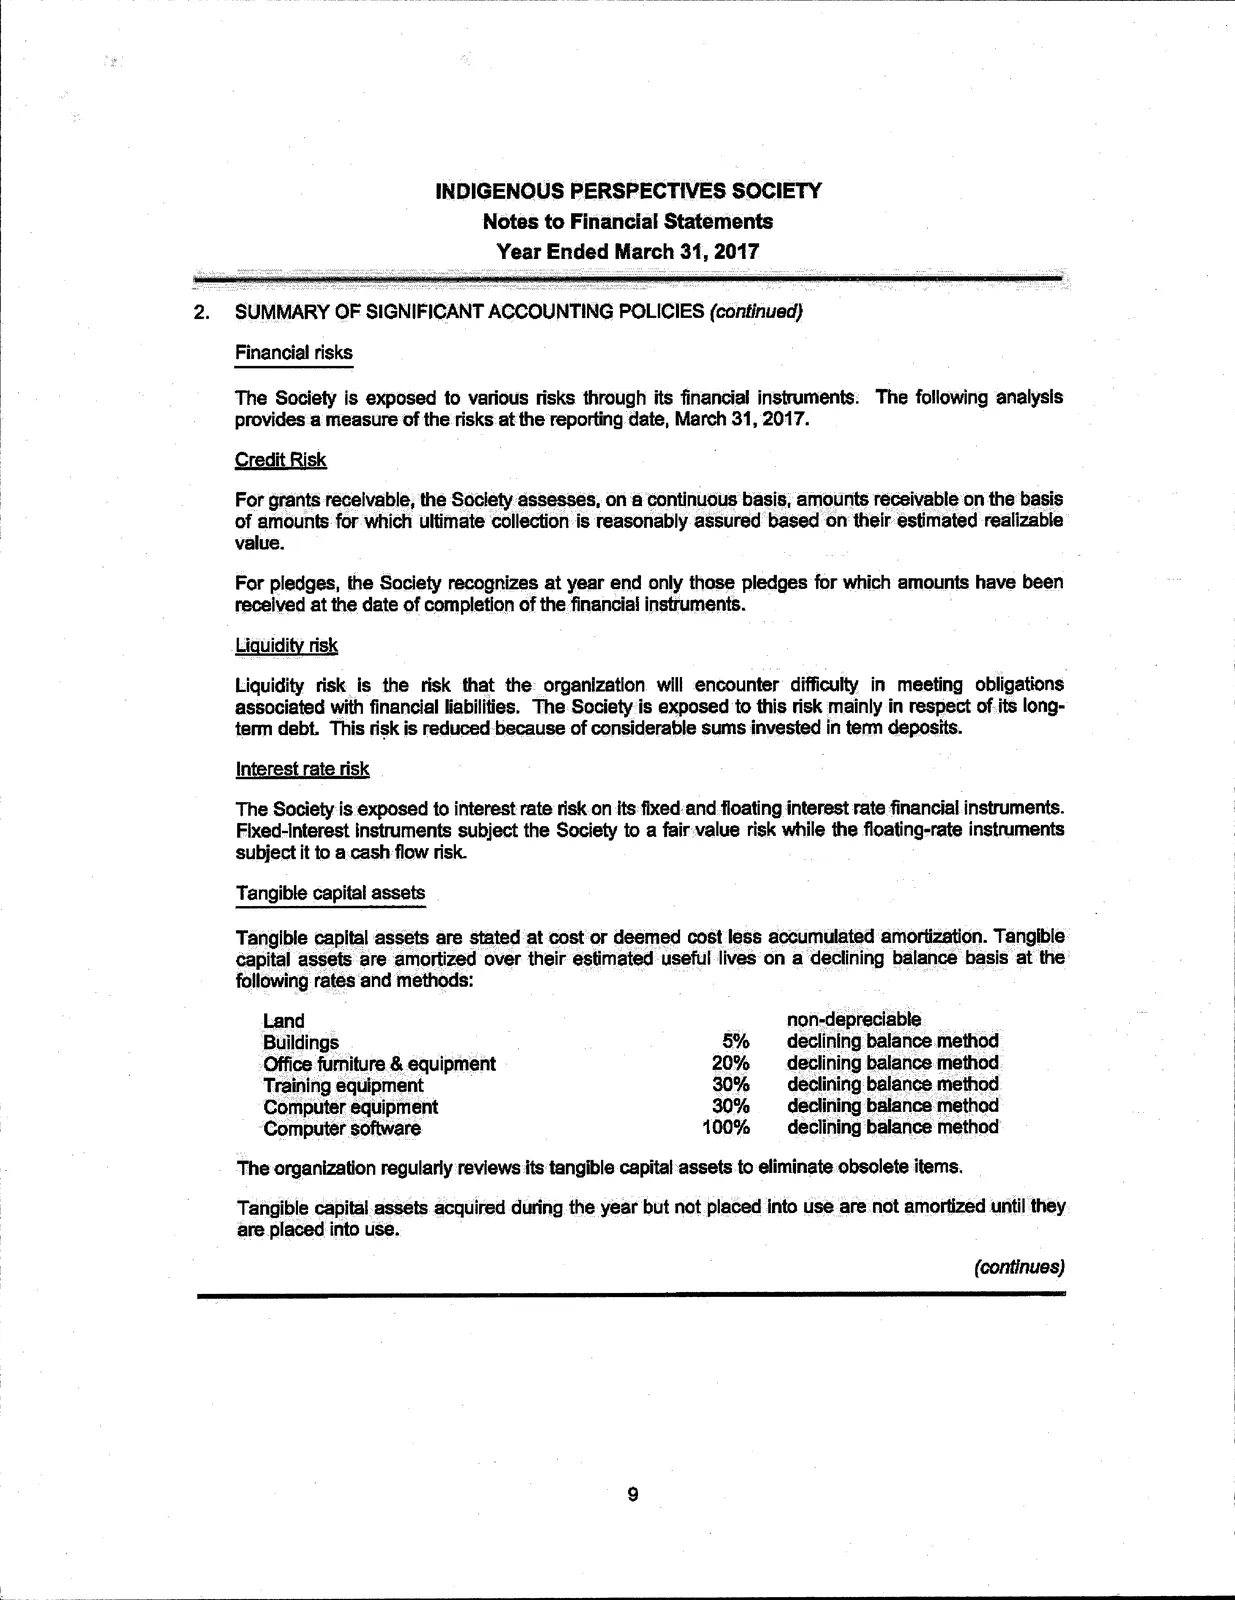
2. Summary of Significant Accounting Policies (continued)
Financial risks
The Society is exposed to various risks through its financial instruments. The following analysis provides a measure of the risks at the reporting date, March 31, 2017.
- Credit risk: For grants receivable, the Society assesses, on a continuous basis, amounts receivable on the basis of amounts for which ultimate collection is reasonably assured based on their estimated realizable value. For pledges, the Society recognizes at year end only those pledges for which amounts have been received at the date of completion of the financial instruments.
- Liquidity risk: The risk that the organization will encounter difficulty in meeting obligations associated with financial liabilities. The Society is exposed to this risk mainly in respect of its long‑term debt. This risk is reduced because of considerable sums invested in term deposits.
- Interest rate risk: The Society is exposed to interest rate risk on its fixed and floating interest rate financial instruments. Fixed‑interest instruments subject the Society to a fair value risk while floating‑rate instruments subject it to a cash flow risk.
Tangible capital assets
Tangible capital assets are stated at cost or deemed cost less accumulated amortization. Tangible capital assets are amortized over their estimated useful lives on a declining balance basis at the following rates and methods:
- Land — non‑depreciable
- Buildings — 5% declining balance method
- Office furniture & equipment — 20% declining balance method
- Training equipment — 30% declining balance method
- Computer equipment — 30% declining balance method
- Computer software — 100% declining balance method
The organization regularly reviews its tangible capital assets to eliminate obsolete items. Tangible capital assets acquired during the year but not placed into use are not amortized until they are placed into use.
Tangible Capital Assets (Note 3)
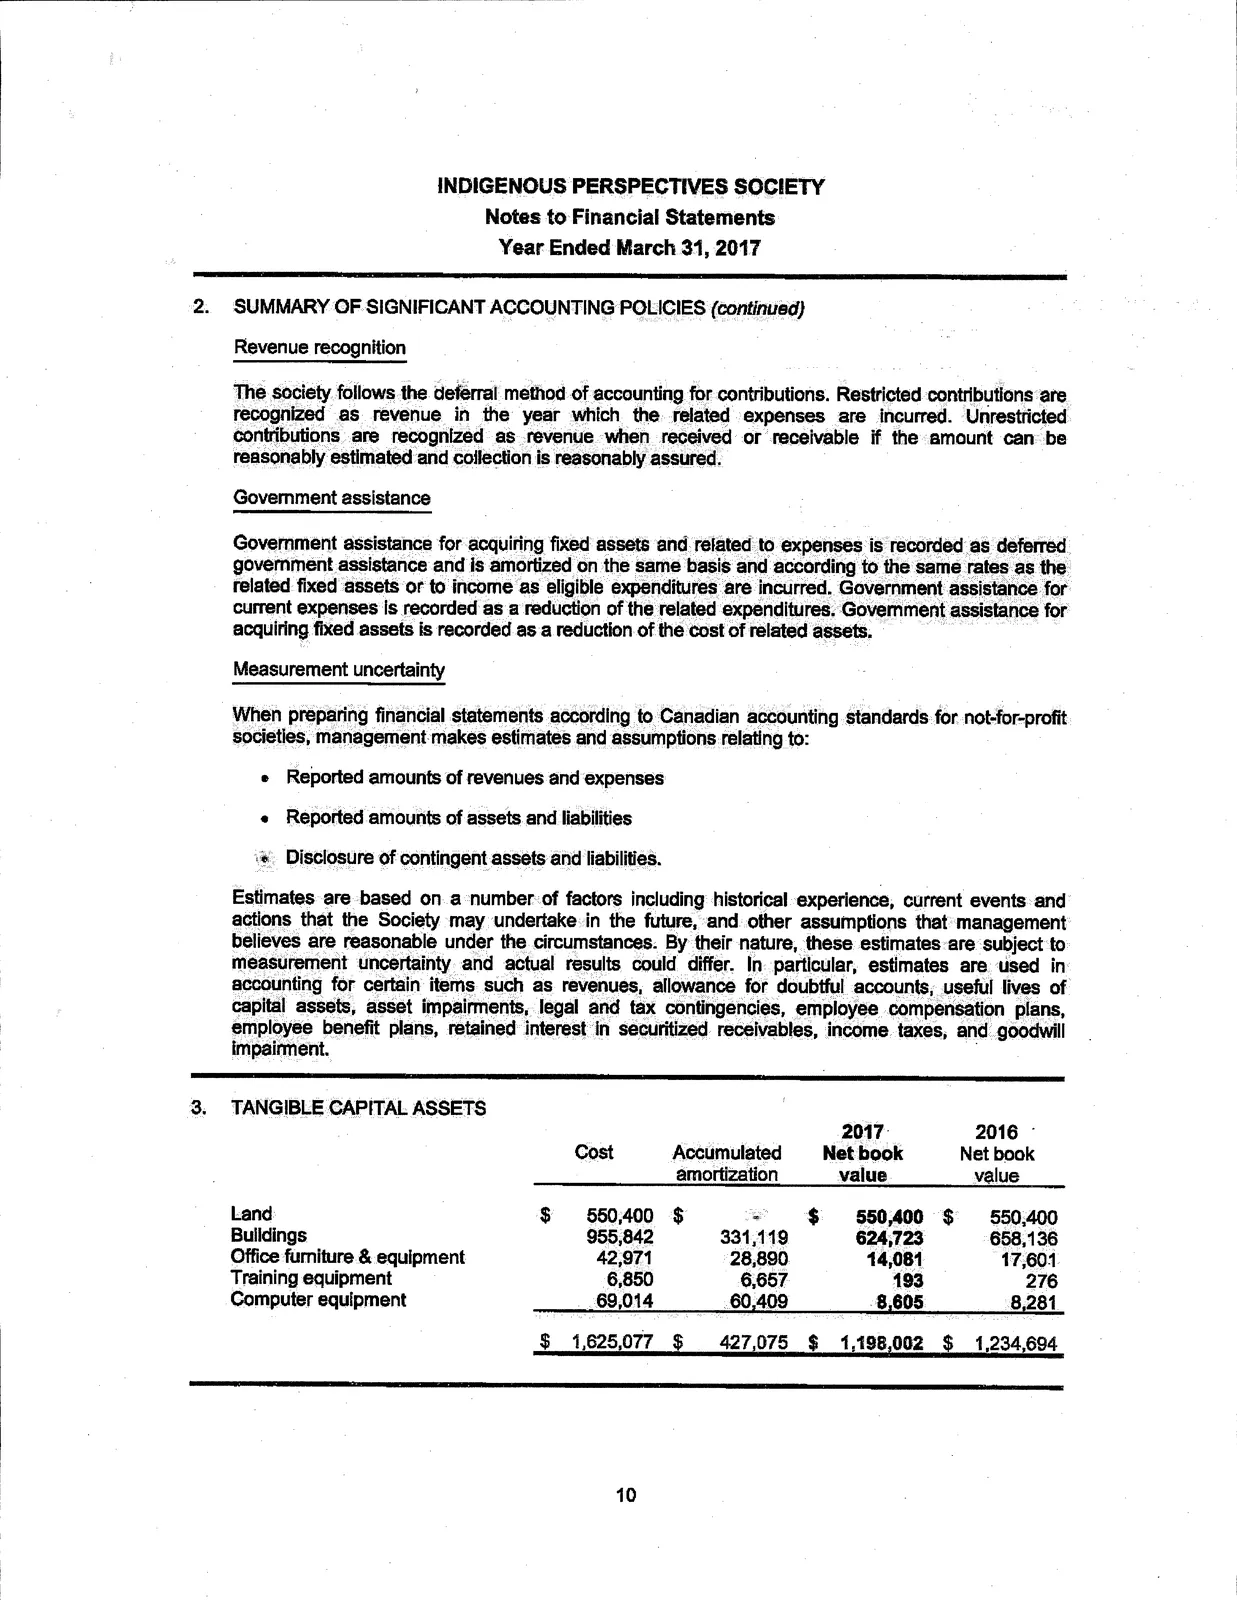
| Cost | Accumulated amortization | Net book value (2017) | Net book value (2016) | |
|---|---|---|---|---|
| Land | $550,400 | — | $550,400 | $550,400 |
| Buildings | 955,842 | 331,119 | 624,723* | 658,136 |
| Office furniture & equipment | 42,971 | 28,890 | 14,081 | 6,657 |
| Training equipment | 6,850 | 276 | 6,574* | — |
| Computer equipment | 69,014 | 60,409 | 8,605 | 8,281 |
| Total | $1,625,077 | $427,075 | $1,198,002 | $1,234,694 |
*Net book values shown as derived from the cost and accumulated amortization figures provided.
Long Term Debt (Note 4)
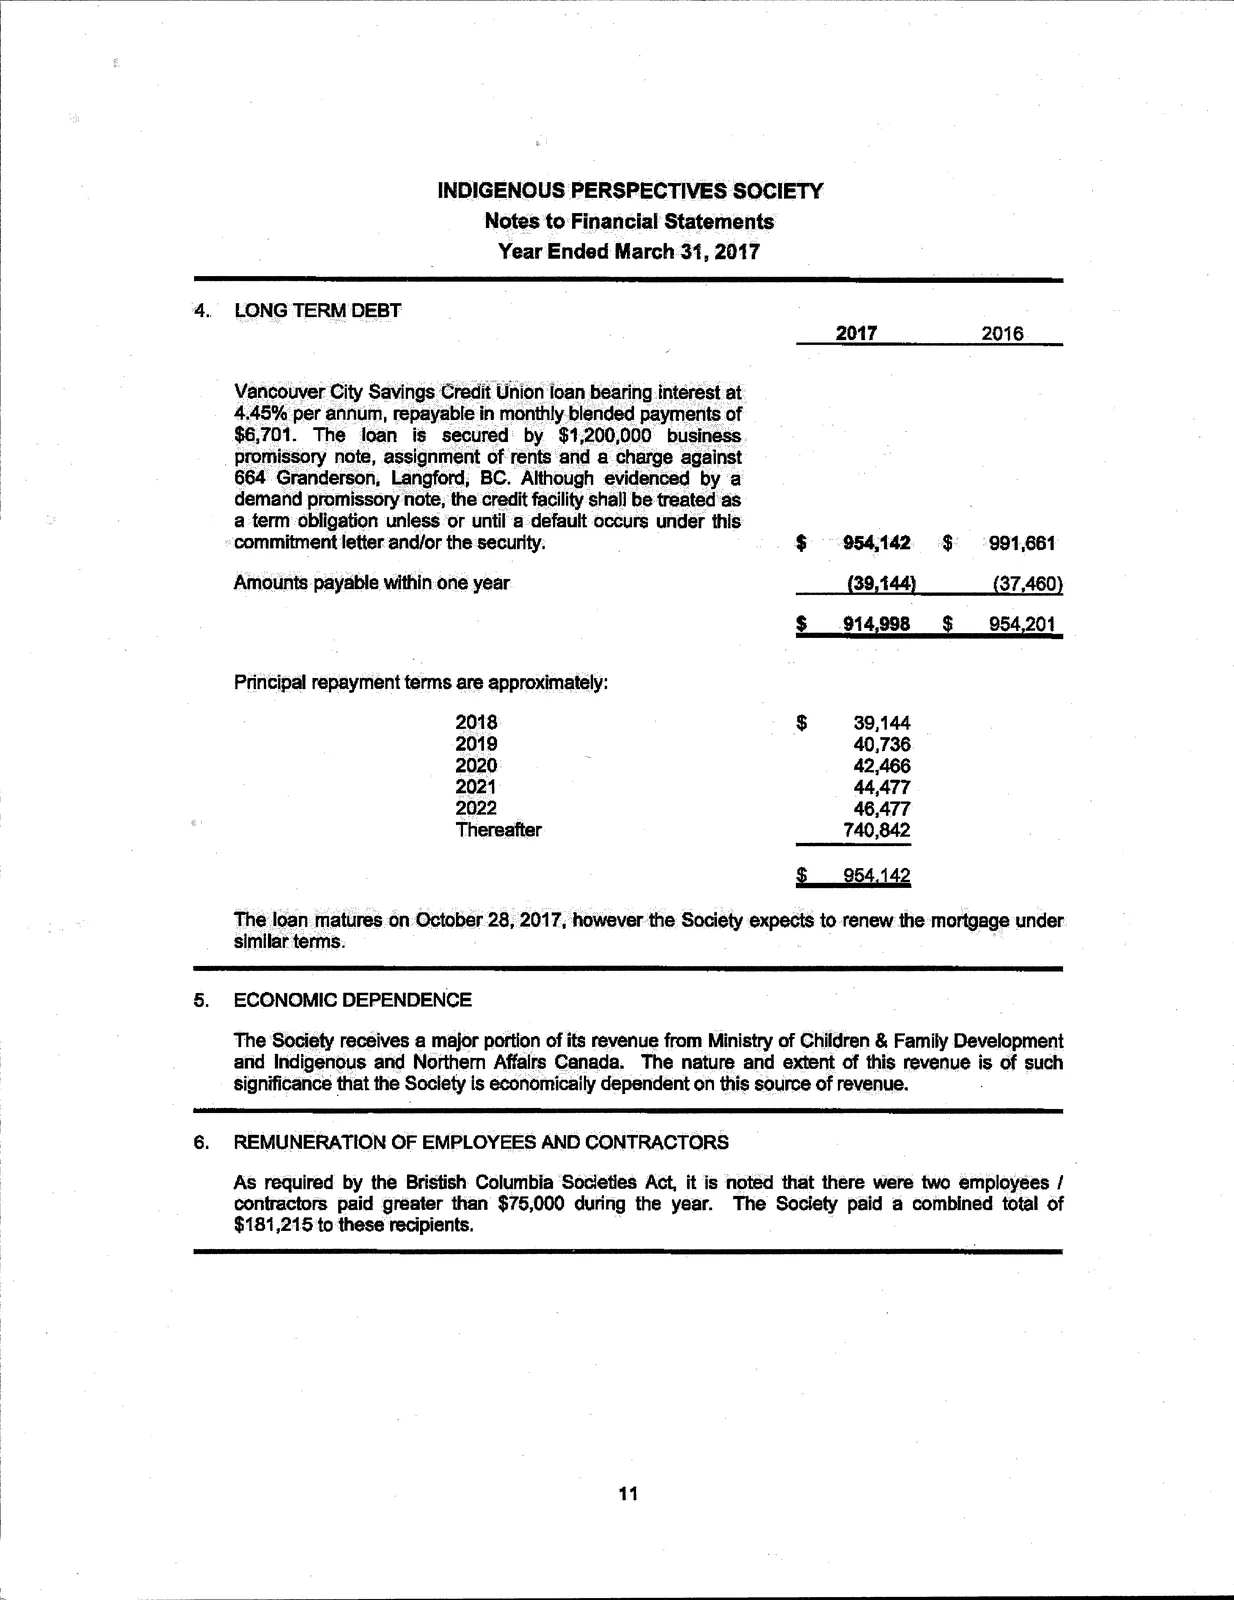
Vancouver City Savings Credit Union loan bearing interest at 4.45% per annum, repayable in monthly blended payments of $6,701. The loan is secured by a $1,200,000 business promissory note, assignment of rents and a charge against 664 Granderson, Langford, BC. Although evidenced by a demand promissory note, the credit facility shall be treated as a term obligation unless or until a default occurs under this commitment letter and/or the security.
| 2017 | 2016 | |
|---|---|---|
| Amounts payable within one year | $39,144 | $37,460 |
| Long term debt (principal) | $914,998 | $954,201 |
Principal repayment terms (approximate):
2018 — $39,144
2019 — $40,736
2020 — $42,466
2021 — $44,477
2022 — $46,477
Thereafter — $740,842
The loan matures on October 28, 2017; however the Society expects to renew the mortgage under similar terms.
Other Notes
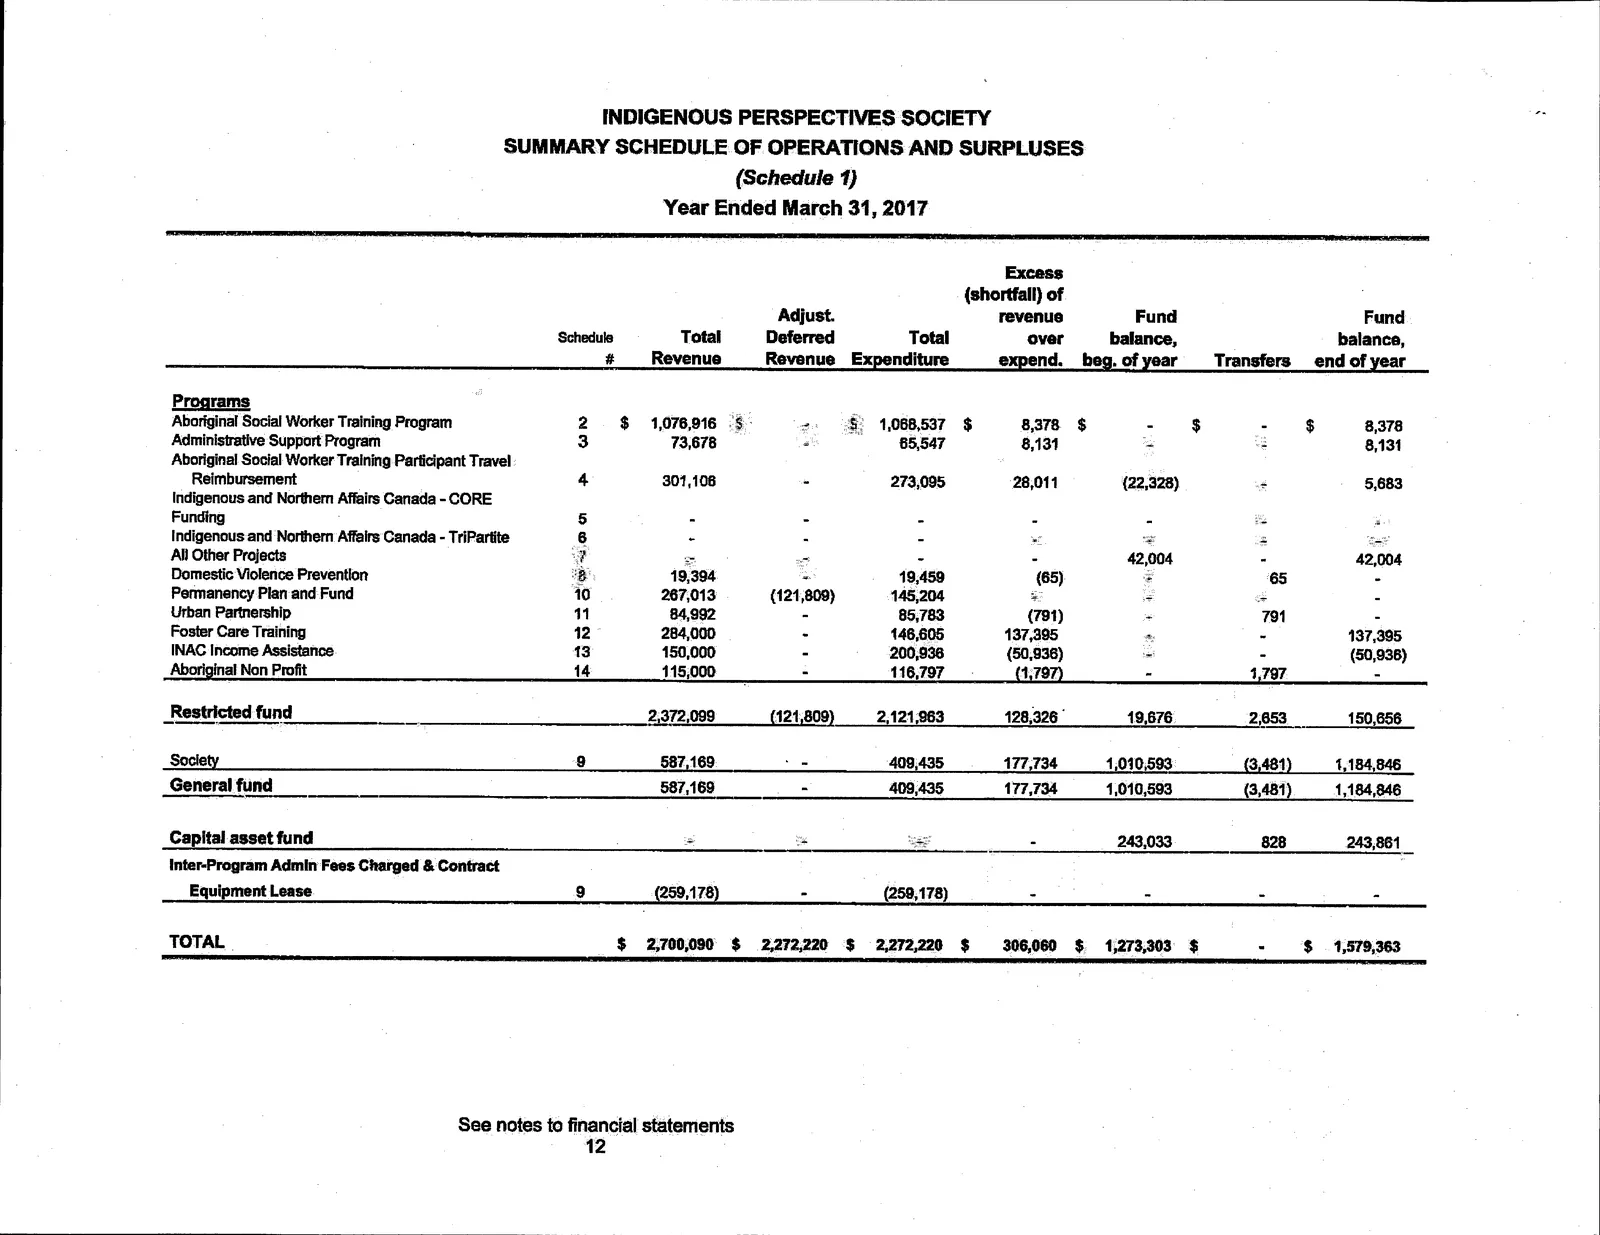
5. Economic Dependence
The Society receives a major portion of its revenue from the Ministry of Children & Family Development and Indigenous and Northern Affairs Canada. The nature and extent of this revenue is of such significance that the Society is economically dependent on this source of revenue.
6. Remuneration of Employees and Contractors
As required by the British Columbia Societies Act, it is noted that there were two employees/contractors paid greater than $75,000 during the year. The Society paid a combined total of $181,215 to these recipients.
Summary Schedule of Operations and Surpluses (Schedule 1)
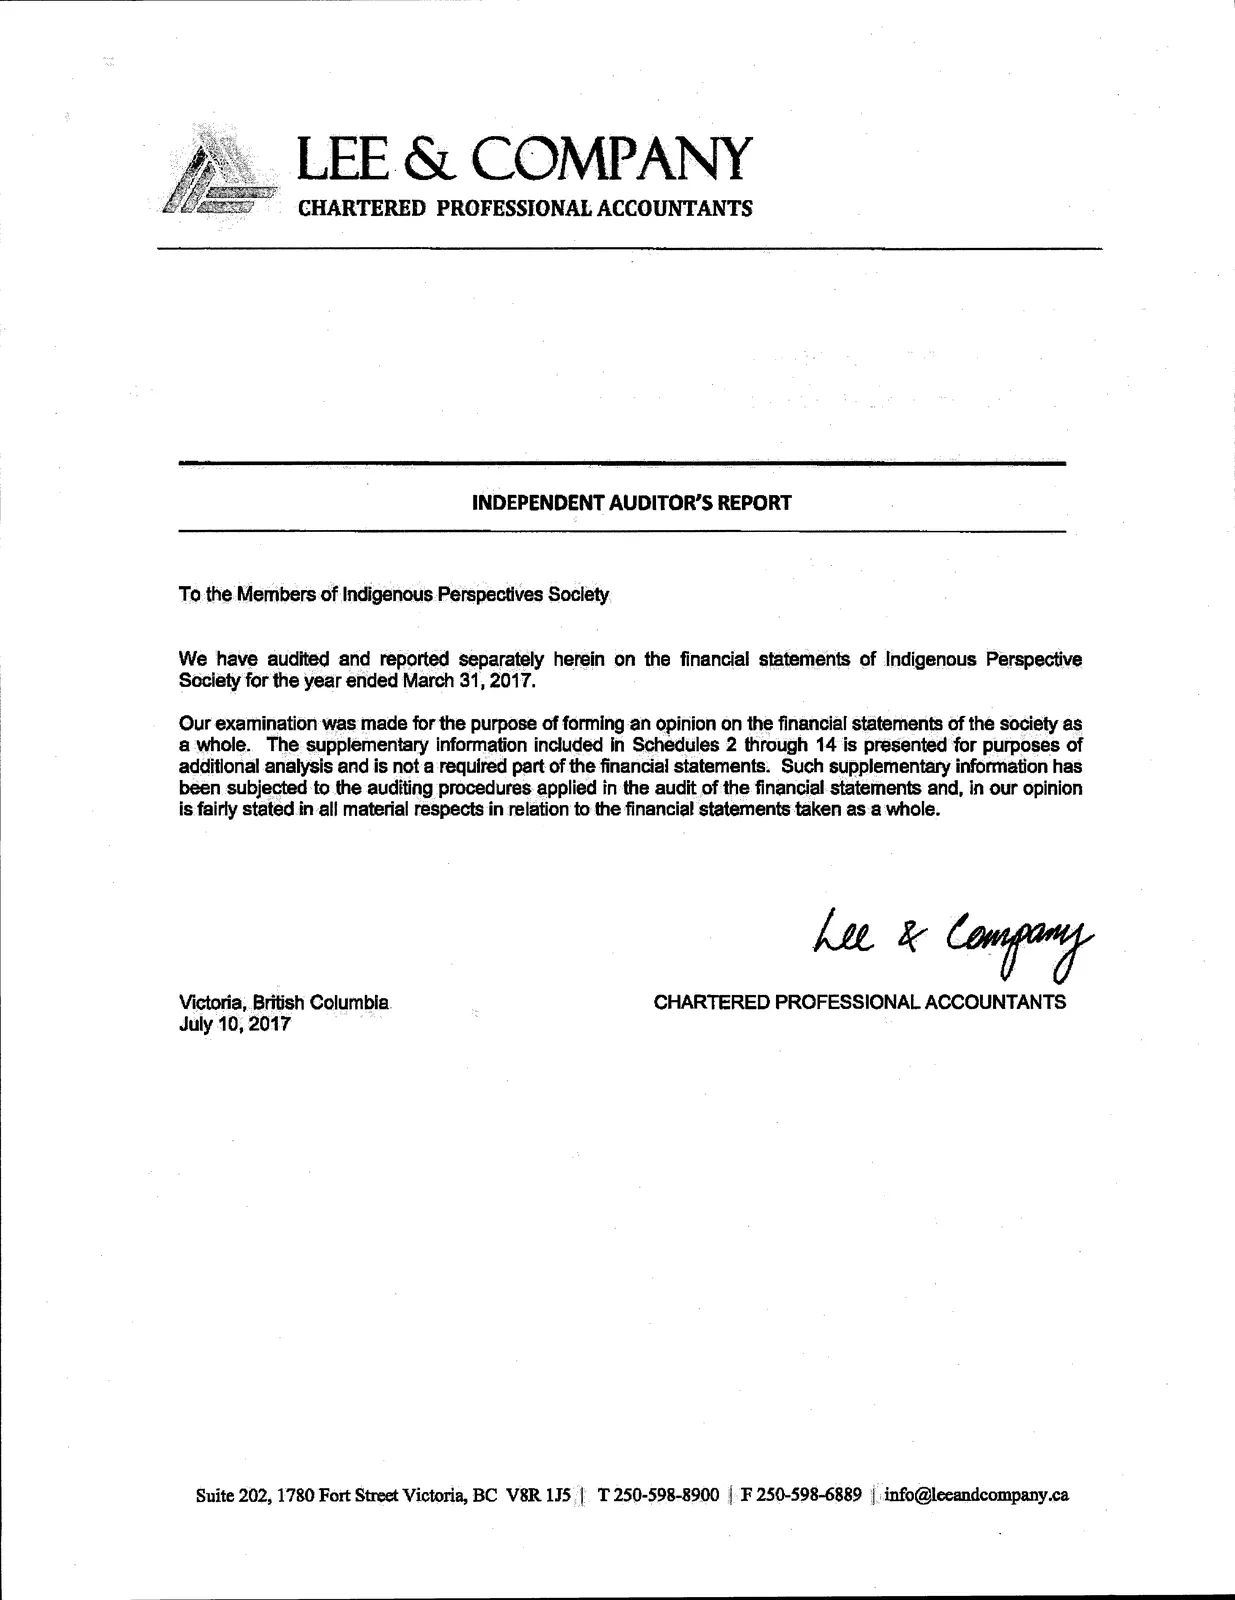
| Program | Schedule # | Revenue | Adjusted Revenue | Expenditure | Excess (shortfall) | Deferred balance beginning of year | Fund transfers | Fund balance end of year |
|---|---|---|---|---|---|---|---|---|
| Aboriginal Social Worker Training Program | 2 | $1,076,916 | $1,068,537 | $1,068,378 | $8,378 | — | — | $8,378 |
| Administrative Support Program | 3 | 73,678 | 65,547 | 65,547 | 8,131 | — | — | $8,131 |
| Aboriginal Social Worker Training Participant Travel Reimbursement | 4 | 301,108 | 273,095 | 273,085 | 28,011 | (22,328) | (11,215) | $5,683 |
| Indigenous and Northern Affairs Canada — CORE Funding | 5 | — | — | — | — | — | 176 (interfund) | — |
| Indigenous and Northern Affairs Canada — Tripartite | 6 | — | — | — | — | — | — | — |
| All Other Projects | 7 | — | — | 42,004 | (42,004) | — | — | $42,004 |
| Domestic Violence Prevention | 8 | 19,394 | 19,459 | 19,459 | (65) | 65 | — | — |
| Permanency Plan and Fund | 10 | 267,013 | (121,809) | 145,204 | — | — | — | — |
| Urban Partnership | 11 | 84,992 | — | 85,783 | (791) | 791 | — | — |
| Foster Care Training | 12 | 284,000 | — | 146,605 | 137,395 | — | — | $137,395 |
| INAC Income Assistance | 13 | 150,000 | — | 200,936 | (50,936) | — | — | (50,936) |
| Aboriginal Non Profit | 14 | 115,000 | — | 116,797 | (1,797) | 1,797 | — | — |
| Restricted fund total | $2,372,099 | (121,809) | $2,121,? | $128,326 | $19,676 | $2,653 | $150,656 | |
| Society (General) | 9 | 587,169 | 409,435 | 409,435 | 177,734 | 1,010,593 | (3,481) | $1,184,846 |
| Capital asset fund | 243,033 | 828 | — | 243,861 | — | — | 243,861 | |
| Inter‑Program Admin Fees Charged & Contract Equipment Lease | 9 | (259,178) | — | (259,178) | — | — | — | — |
| Total | $2,600,099 | $1,272,220 | $2,272,220 | $306,060 | $1,273,303 | $1,579,363 |
See notes to financial statements
Auditor's Supplementary Report on Schedules
Lee & Company, Chartered Professional Accountants, reported separately on the financial statements of Indigenous Perspectives Society for the year ended March 31, 2017. The supplementary information included in Schedules 2 through 14 is presented for purposes of additional analysis and is not a required part of the financial statements. Such supplementary information has been subjected to the auditing procedures applied in the audit of the financial statements and, in our opinion, is fairly stated in all material respects in relation to the financial statements taken as a whole.
Victoria, British Columbia
CHARTERED PROFESSIONAL ACCOUNTANTS
July 10, 2017
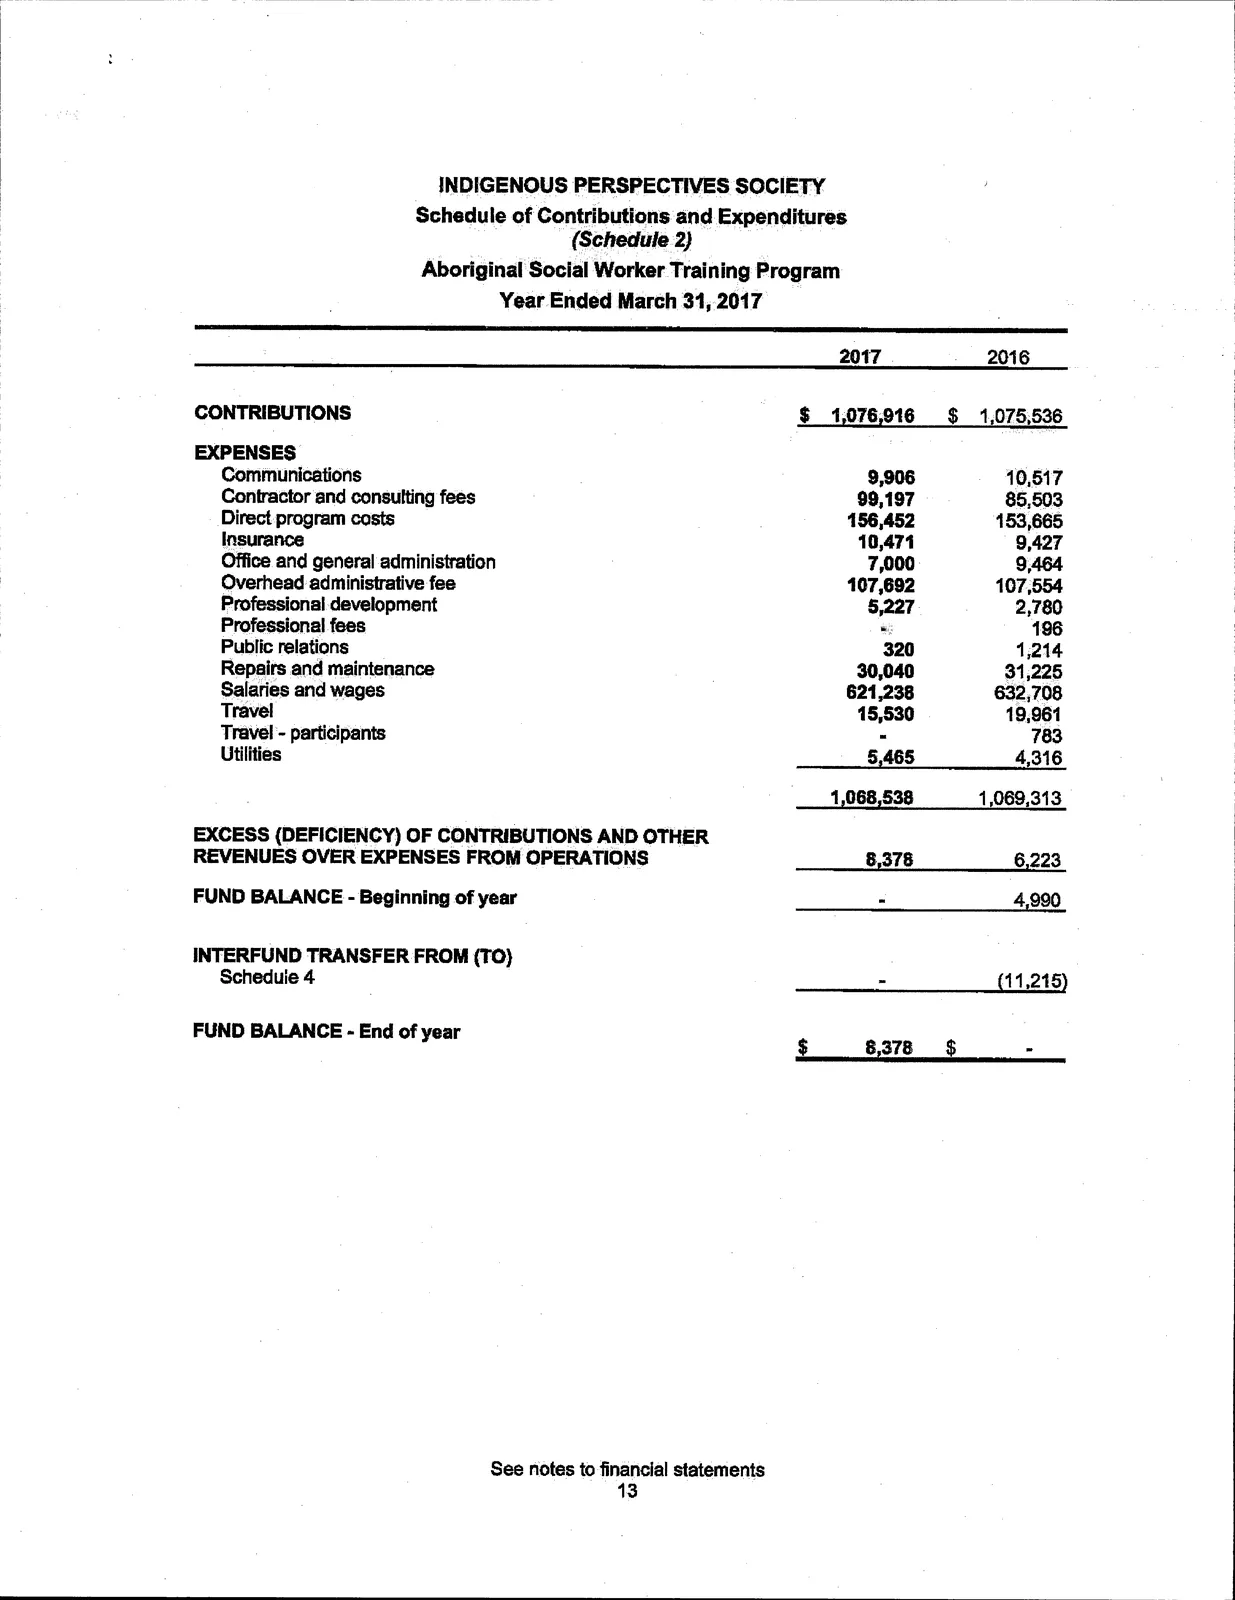
Schedule 2 — Aboriginal Social Worker Training Program
Year Ended March 31, 2017
| 2017 | 2016 | |
|---|---|---|
| CONTRIBUTIONS | $1,076,916 | $1,075,536 |
| EXPENSES | ||
| Communications | 9,906 | 10,517 |
| Contractor and consulting fees | 99,197 | 85,503 |
| Direct program costs | 156,452 | 153,665 |
| Insurance | 10,471 | 9,427 |
| Office and general administration | 7,000 | 9,464 |
| Overhead administrative fee | 107,692 | 107,554 |
| Professional development | 5,227 | 2,780 |
| Professional fees | 196 | — |
| Public relations | 320 | 1,214 |
| Repairs and maintenance | 30,040 | 31,225 |
| Salaries and wages | 621,238 | 632,708 |
| Travel | 15,530 | 19,961 |
| Travel — participants | 783 | — |
| Utilities | 5,465 | 4,316 |
| Total expenses | $1,068,538 | $1,069,313 |
| Excess (deficiency) | $8,378 | $6,223 |
| Fund balance — beginning of year | $4,990 | |
| Interfund transfer from Schedule 4 | (11,215) | |
| Fund balance — end of year | $8,378 |
See notes to financial statements
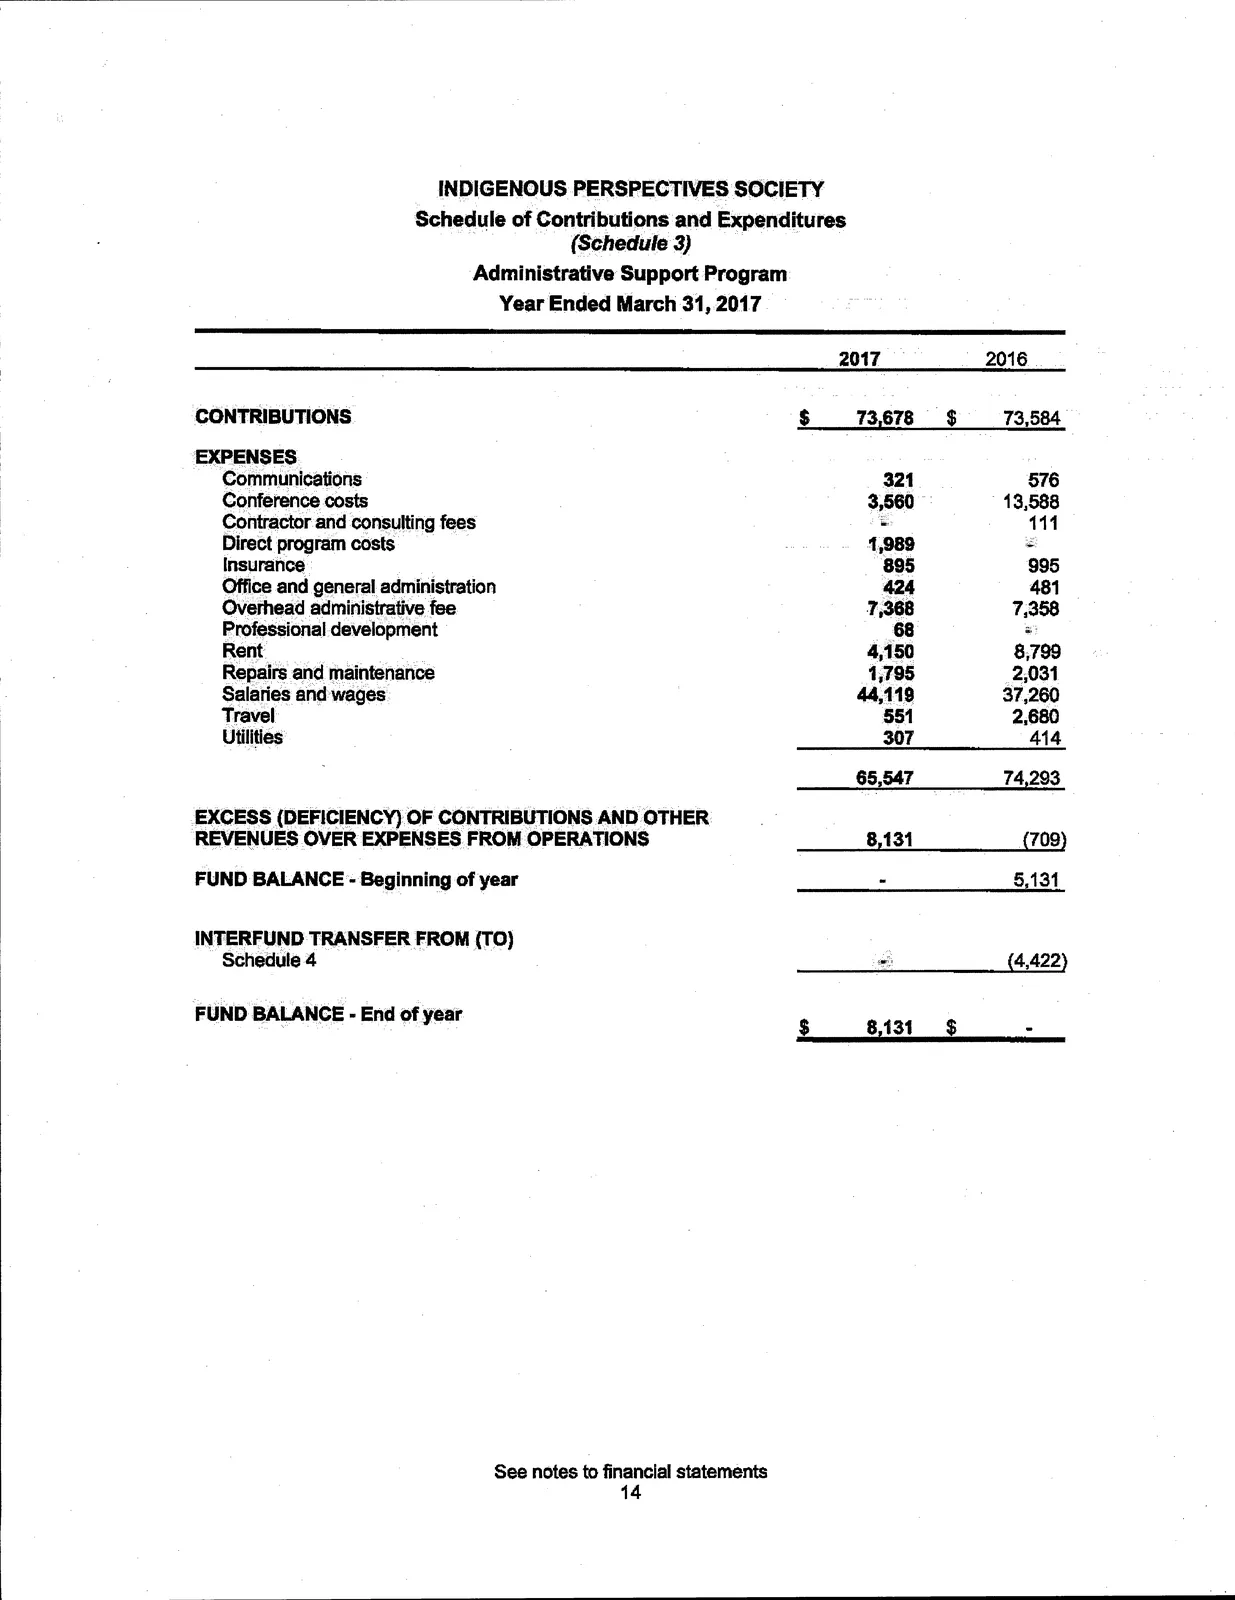
Schedule 3 — Administrative Support Program
Year Ended March 31, 2017
| 2017 | 2016 | |
|---|---|---|
| CONTRIBUTIONS | $73,678 | $73,584 |
| EXPENSES | ||
| Communications | 321 | 576 |
| Conference costs | 3,560 | 13,588 |
| Contractor and consulting fees | — | 111 |
| Direct program costs | 1,989 | — |
| Insurance | 895 | 995 |
| Office and general administration | 424 | 481 |
| Overhead administrative fee | 7,358 | 7,358 |
| Professional development | 68 | — |
| Rent | 4,150 | 8,799 |
| Repairs and maintenance | 1,795 | 2,031 |
| Salaries and wages | 44,118 | 37,260 |
| Travel | 551 | 2,680 |
| Utilities | 307 | 414 |
| Total expenses | $65,547 | $74,293 |
| Excess (deficiency) | $8,131 | $(709) |
| Fund balance — beginning of year | $— | $5,131 |
| Interfund transfer from Schedule 4 | (4,422) | |
| Fund balance — end of year | $8,131 |
See notes to financial statements
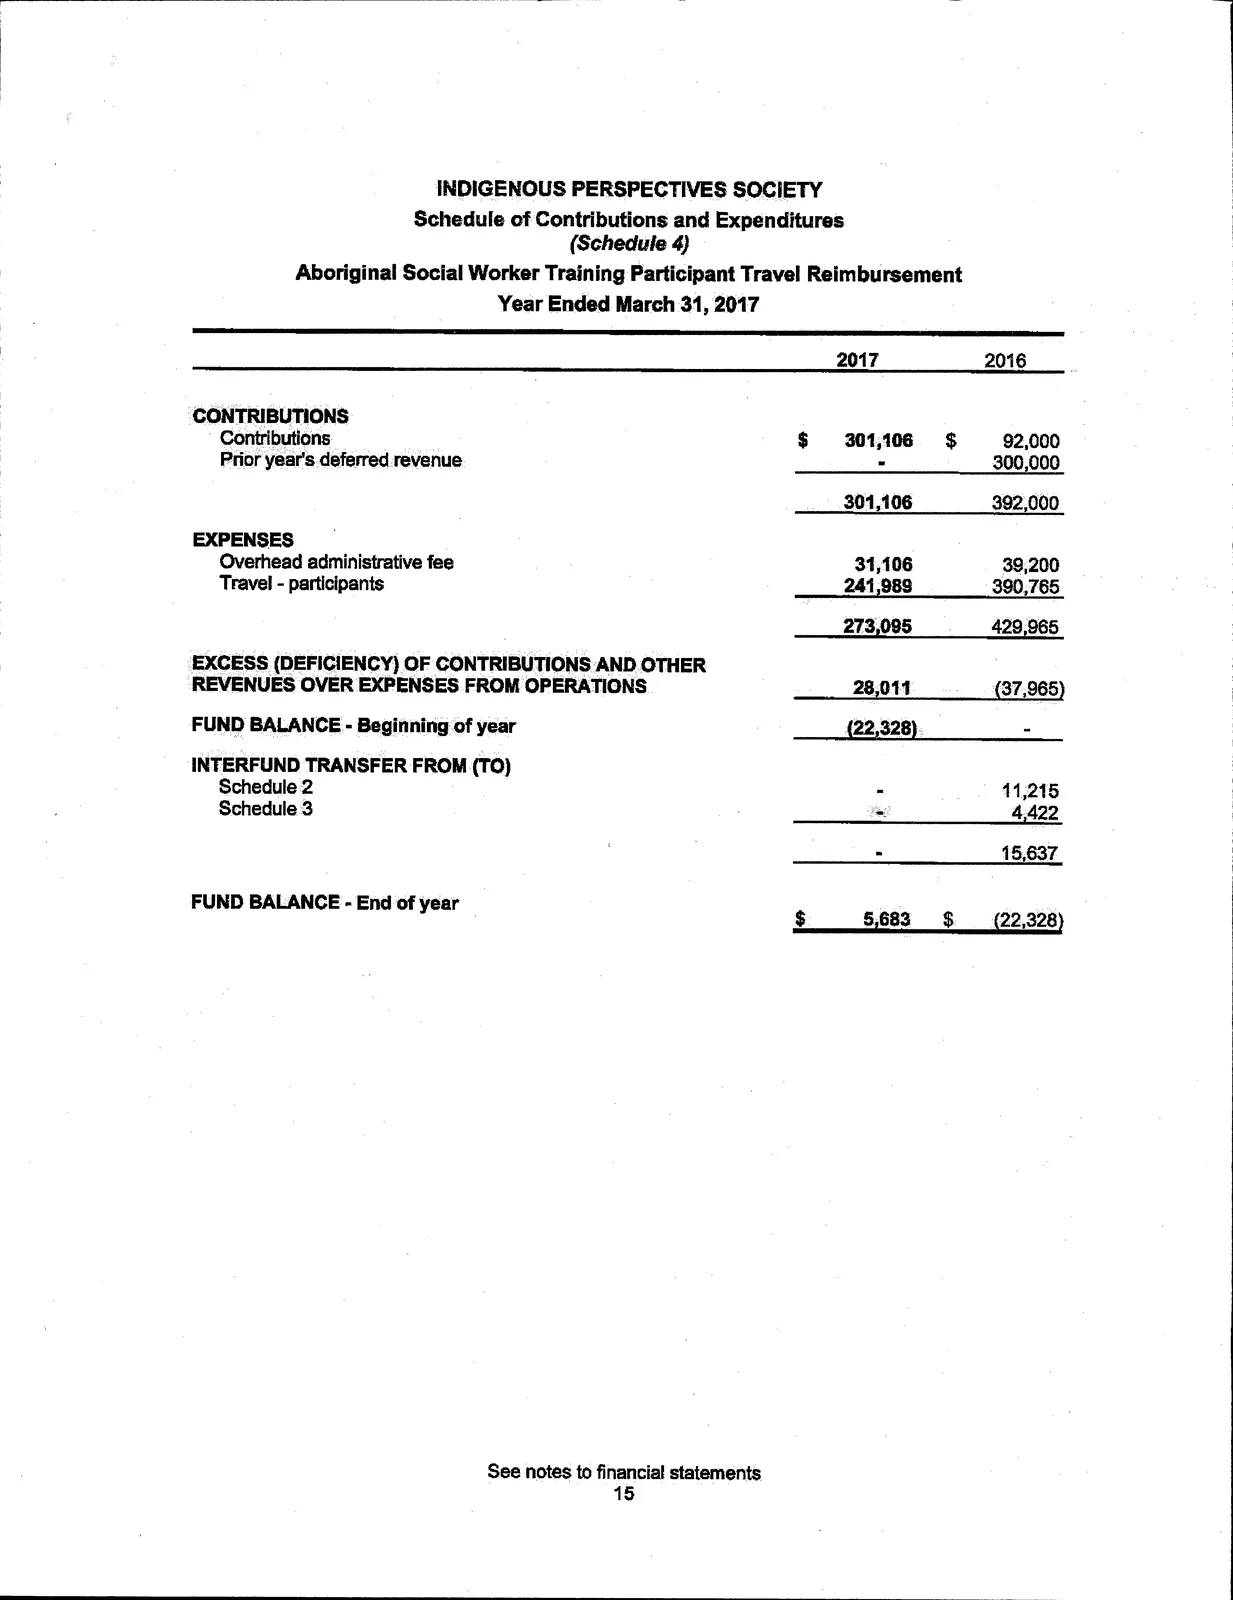
Schedule 4 — Aboriginal Social Worker Training Participant Travel Reimbursement
Year Ended March 31, 2017
| 2017 | 2016 | |
|---|---|---|
| CONTRIBUTIONS | ||
| Contributions | $301,106 | $392,000 |
| Prior year's deferred revenue | 92,000 | — |
| EXPENSES | ||
| Overhead administrative fee | 31,106 | 39,200 |
| Travel — participants | 241,689 | 390,765 |
| Total expenses | $273,085 | $429,965 |
| Excess (deficiency) | $28,011 | (37,965) |
| Fund balance — beginning of year | (22,328) | |
| Interfund transfers from (to) Schedules | 11,215 / 4,422 | |
| Fund balance — end of year | $5,683 | $(22,328) |
See notes to financial statements
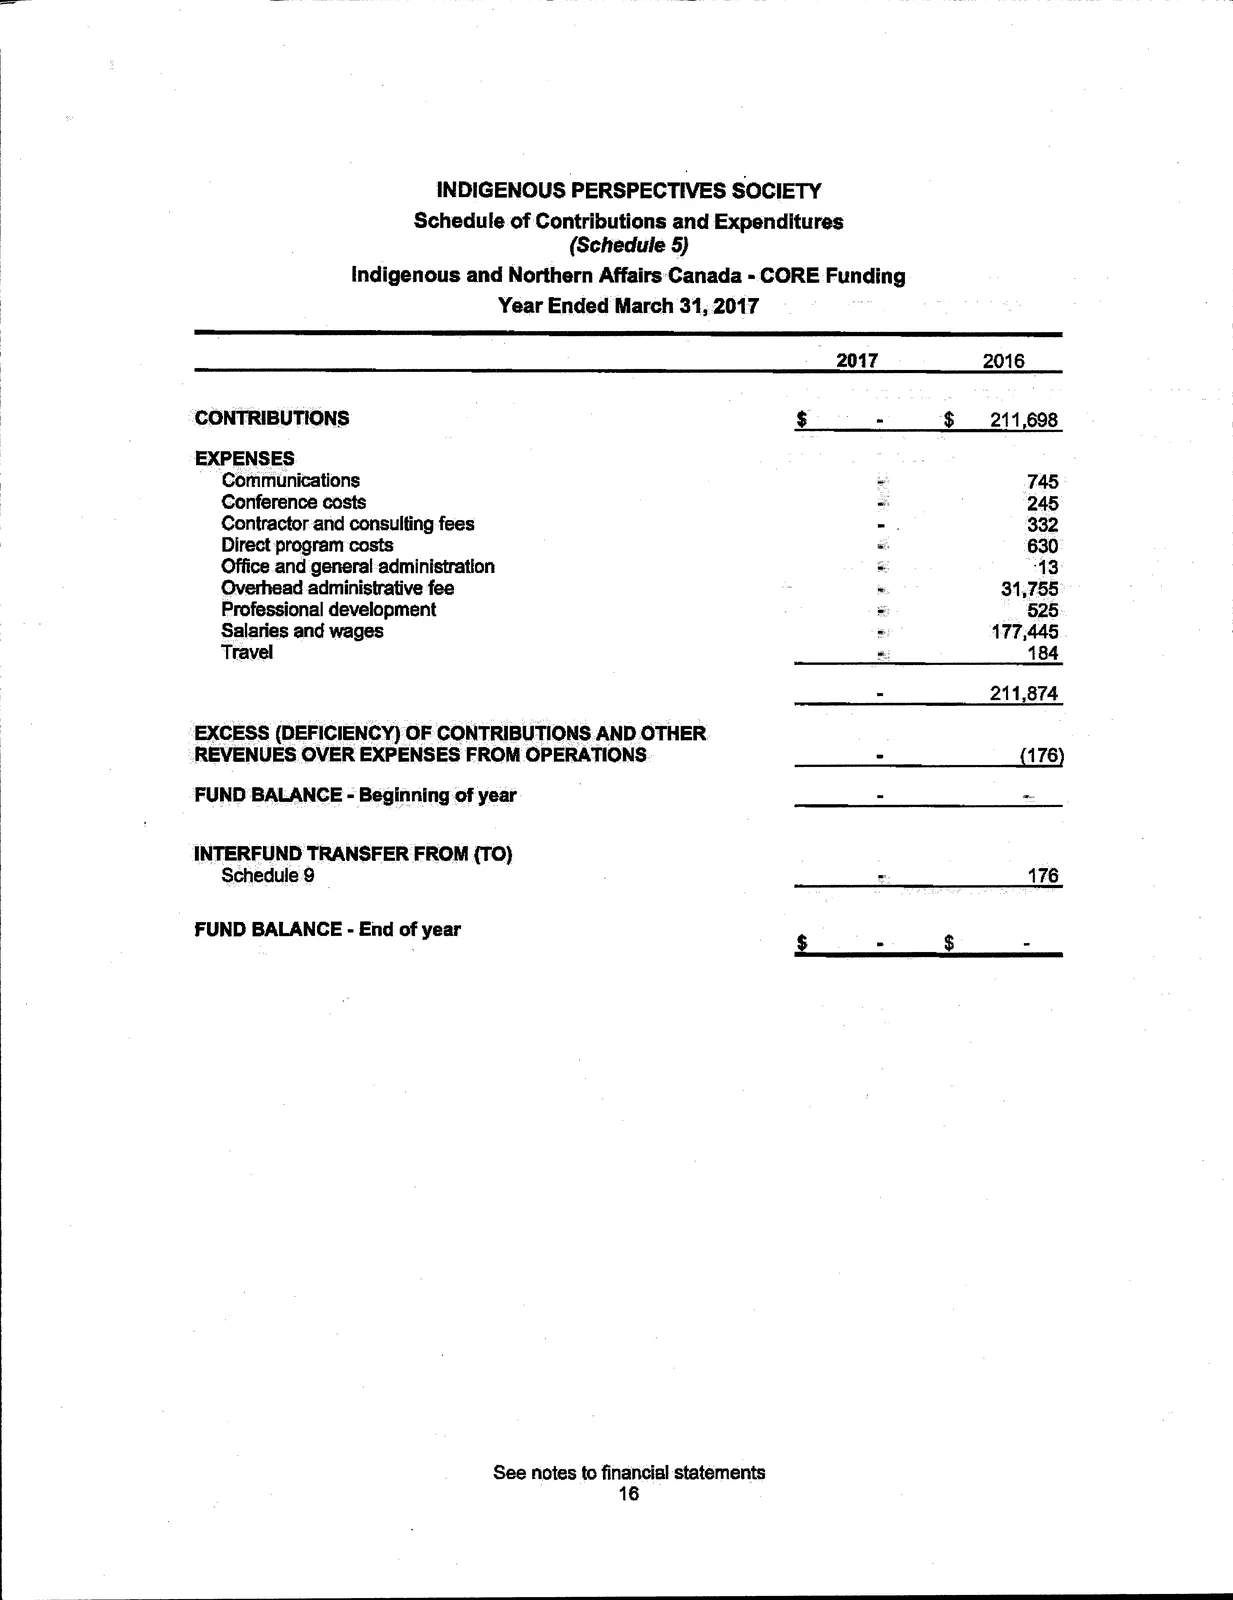
Schedule 5 — Indigenous and Northern Affairs Canada — CORE Funding
Year Ended March 31, 2017
| 2017 | 2016 | |
|---|---|---|
| CONTRIBUTIONS | — | $211,698 |
| EXPENSES | ||
| Communications | — | 745 |
| Conference costs | — | 245 |
| Contractor and consulting fees | — | 332 |
| Direct program costs | — | 650 |
| Office and general administration | — | 13 |
| Overhead administrative fee | — | 31,755 |
| Salaries and wages | — | 177,445 |
| Travel | — | — |
| Total expenses | — | $211,874 |
| Excess (deficiency) | — | $(176) |
| Interfund transfer from Schedule 9 | 176 | |
| Fund balance — end of year | — |
See notes to financial statements
Schedule 6 — Indigenous and Northern Affairs Canada — Tripartite
| 2017 | 2016 | |
|---|---|---|
| EXPENSES | ||
| Overhead administrative fee | 1,494 | 280 |
| Travel — participants | 8,281 | 466 |
| Total expenses | 9,775 | 746 |
| Fund balance — beginning of year | — | |
| Interfund transfer from (to) Schedule 9 | — | |
| Fund balance — end of year | — |
See notes to financial statements
Schedule 7 — All Other Projects
Year Ended March 31, 2017
| 2017 | 2016 | |
|---|---|---|
| EXPENSES | ||
| Contractor and consulting fees | — | 49,244 |
| Direct program costs | — | 3,234 |
| Office and general administration | — | 24 |
| Overhead administrative fee | — | 8,285 |
| Salaries and wages | — | 5,715 |
| Total expenses | — | 66,502 |
| Fund balance — beginning of year | 42,004 | 108,506 |
| Fund balance — end of year | $42,004 |
See notes to financial statements
Schedule 8 — Domestic Violence Prevention
Year Ended March 31, 2017
| 2017 | 2016 | |
|---|---|---|
| CONTRIBUTIONS | Revenue — Domestic Violence Prev | $19,394 |
| EXPENSES | ||
| Conference costs | 5,326 | 4,900 |
| Direct program costs | 3,400 | 2,368 |
| Office and general admin | 73 | 500 |
| Overhead admin fees | 2,909 | 2,641 |
| Salaries and wages | 2,851 | 2,629 |
| Travel | — | — |
| Total expenses | $19,459 | $8,138 |
| Excess (deficiency) | $(65) | $(8,138) |
| Fund balance — beginning of year | $17,604 | |
| Interfund transfer from (to) Schedule 6 | 65 / (9,466) | |
| Fund balance — end of year | — |
See notes to financial statements
Schedule 9 — Society
Year Ended March 31, 2017
| CONTRIBUTIONS | 2017 | 2016 |
|---|---|---|
| Admin costs recovered | $259,178 | $254,293 |
| Other Society Revenue | 24,292 | 150,105 |
| Prints Training | 42,499 | 50,464 |
| Foster Care Transition Revenue | 43,200 | 40,000 |
| Total contributions | $587,169 | $494,862 |
| EXPENSES | 2017 | 2016 |
|---|---|---|
| Amortization | $39,996 | $43,298 |
| Board costs | 4,728 | 7,? |
| Communications | 3,563 | 4,023 |
| Conference costs | 4,000 | 4,000 |
| Contractor and consulting fees | 638 | 1,? |
| Direct program costs | 4,033 | 5,034 |
| Insurance | 41,631 | 2,115 |
| Interest on long term debt | 3,675 | 42,892 |
| Office and general administration | 44,693 | 24,634 |
| Professional development | 16,044 | 22,784 |
| Professional fees | 12,919 | 15,425 |
| Property taxes | 20,241 | 15,935 |
| Public relations | 26,418 | 2,446 |
| Rent | 2,? | 14,? |
| Repairs and maintenance | 4,976 | 12,519 |
| Salaries and wages | 141,861 | 102,102 |
| Travel | 14,286 | 19,427 |
| Utilities | 2,014 | 1,433 |
| Total expenses | $409,435 | $371,848 |
| Excess (deficiency) | $177,734 | $123,014 |
| Fund balance — beginning of year | $1,010,593 | |
| Interfund transfers from (to) Schedules (5, 6, 8, 11, 14) | various | various |
| Fund balance — end of year | $1,184,846 | $1,010,593 |
See notes to financial statements
Schedule 10 — Permanency Plan and Fund
Year Ended March 31, 2017
| 2017 | 2016 | |
|---|---|---|
| CONTRIBUTIONS | Revenue | $267,013 |
| Current year's deferred revenue | (121,809) | 293,058 |
| EXPENSES | ||
| Communications | 8 | 36 |
| Conference costs | 27 | 2,045 |
| Contractor and consulting fees | — | 996 |
| Direct program costs | 95,044 | 159,135 |
| Overhead administrative fee | 26,701 | 56,090 |
| Salaries and wages | 6,775 | 10,975 |
| Travel | 16,618 | 63,713 |
| Travel — participants | — | — |
| Total expenses | $145,204 | $293,058 |
| Excess (deficiency) | — | — |
| Fund balance — beginning of year | — | |
| Fund balance — end of year | — |
See notes to financial statements
Schedule 11 — Urban Partnership
Year Ended March 31, 2017
| 2017 | 2016 | |
|---|---|---|
| CONTRIBUTIONS | $84,992 | $54,156 |
| EXPENSES | ||
| Communications | 315 | — |
| Contractor and consulting fees | 23,960 | — |
| Direct program costs | 8,967 | 789 |
| Office | 4,845 | — |
| Rental | 5,175 | — |
| Salaries and wages | 62,105 | 29,434 |
| Travel | 4,375 | — |
| Total expenses | $85,583 | $54,183 |
| Excess (deficiency) | $(591) | $(27) |
| Fund balance — beginning of year | — | |
| Interfund transfer from (to) Schedule 9 | 791 / 27 | |
| Fund balance — end of year | — |
See notes to financial statements
Schedule 12 — Foster Care Training
Year Ended March 31, 2017
| 2017 | 2016 | |
|---|---|---|
| CONTRIBUTIONS | $284,000 | — |
| EXPENSES | ||
| Communications | 3,189 | — |
| Conference costs | 35 | 9,095 |
| Contractor and consulting fees | 9,182 | — |
| Direct program costs | 465 | 30,329 |
| Insurance | 195 | — |
| Office | 4,670 | 12,? |
| Professional development | 129 | 1,048 |
| Public relations | — | — |
| Rent | 66,592 | — |
| Repairs and maintenance | 8,863 | — |
| Salaries and wages | 443 | — |
| Travel | 146,605 | — |
| Utilities | 137,395 | — |
| Total expenses | $146,605 | $137,395 |
| Excess (deficiency) | $137,395 | — |
| Fund balance — end of year | $137,395 |
See notes to financial statements
Schedule 13 — INAC Income Assistance
Year Ended March 31, 2017
| 2017 | 2016 | |
|---|---|---|
| CONTRIBUTIONS | $150,000 | — |
| EXPENSES | ||
| Conference costs | 64,575 | — |
| Direct program costs | 1,966 | — |
| Office | 30,739 | — |
| Travel | 7,183 | — |
| Travel — participants | 96,473 | — |
| Total expenses | $200,936 | — |
| Excess (deficiency) | $(50,936) | — |
| Fund balance — end of year | $(50,936) |
See notes to financial statements
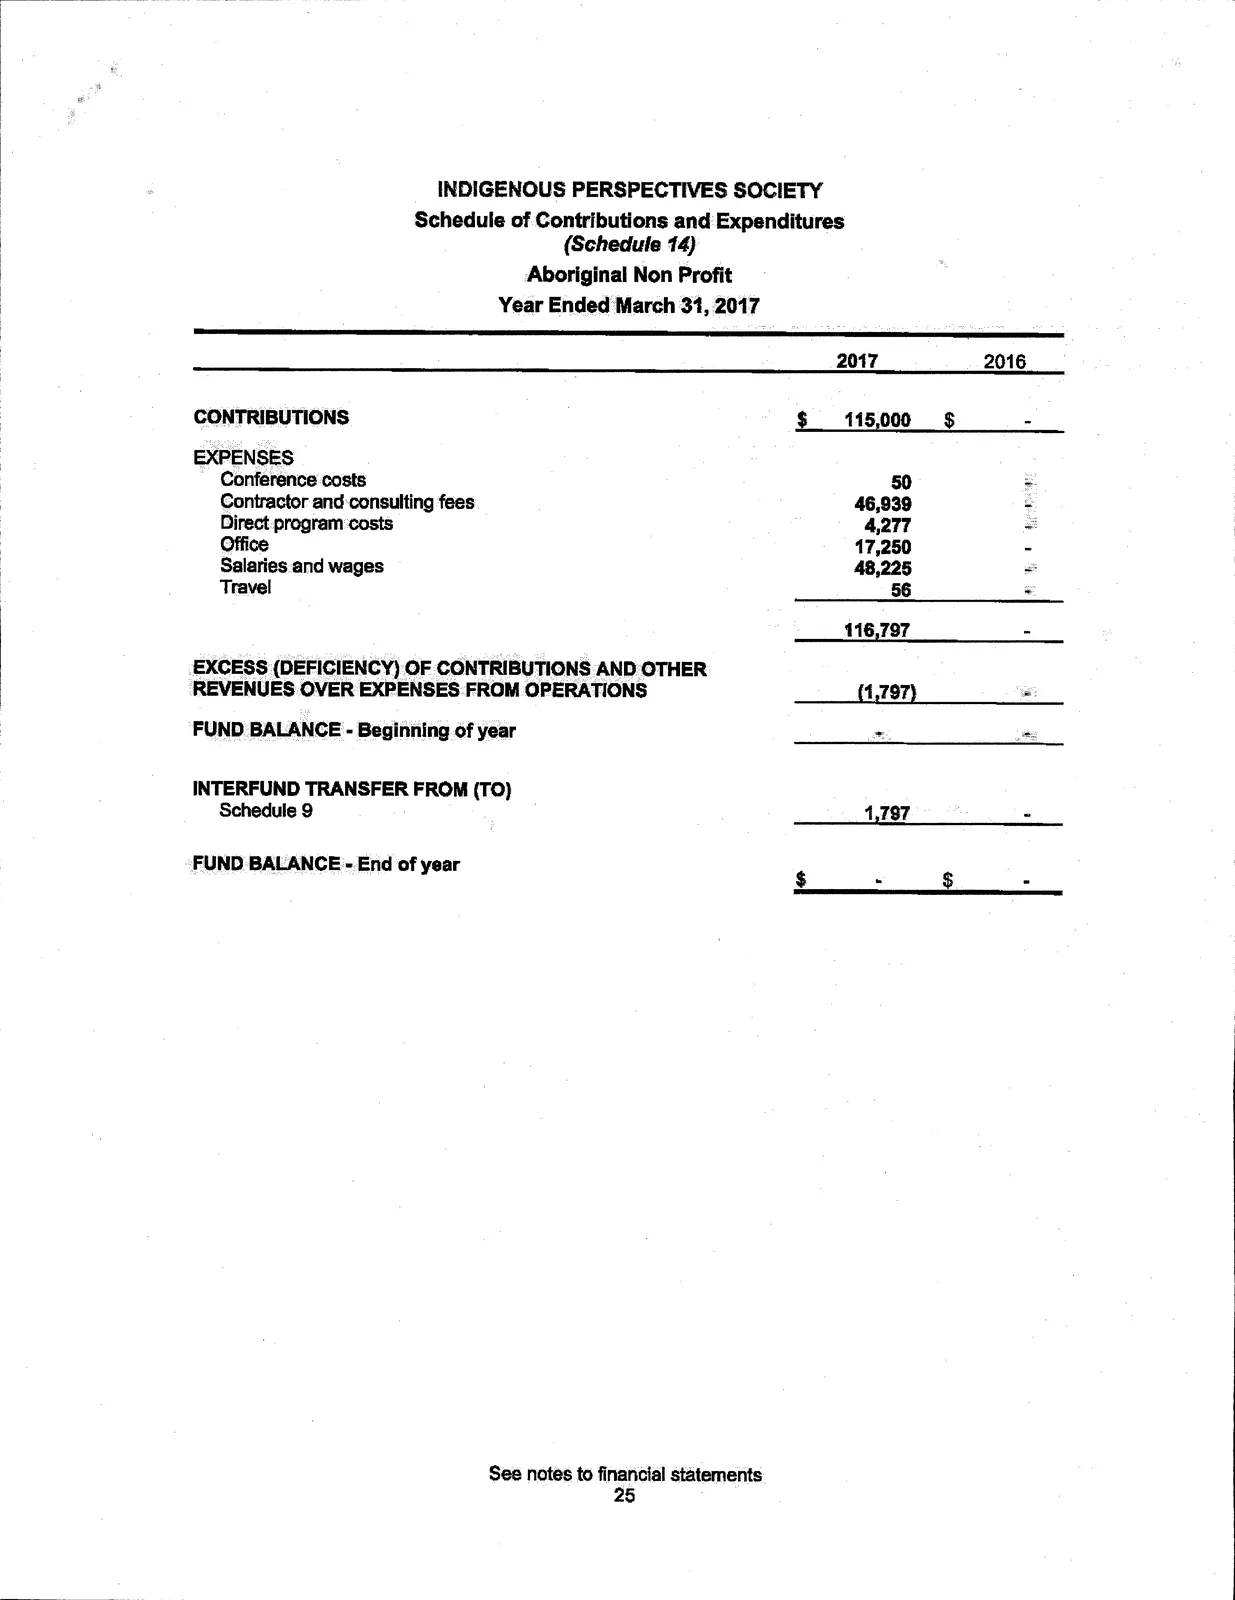
Schedule 14 — Aboriginal Non Profit
Year Ended March 31, 2017
| 2017 | 2016 | |
|---|---|---|
| CONTRIBUTIONS | $115,000 | — |
| EXPENSES | ||
| Conference costs | 50 | — |
| Contractor and consulting fees | 46,939 | — |
| Direct program costs | 4,277 | — |
| Office | 17,250 | — |
| Salaries and wages | 48,225 | — |
| Travel | — | — |
| Total expenses | $116,797 | — |
| Excess (deficiency) | $(1,797) | — |
| Interfund transfer from (to) Schedules | 1,797 | |
| Fund balance — end of year | — |
See notes to financial statements